
How to Make a Good First Impression: 14 Tips to Try
Did you know that it only takes a tenth of a second to make a first impression? So when you meet someone for the first time, you need to be on your game from the very beginning — but do you know exactly how to make a good first impression?
Whether you’re meeting new connections, team members, potential employers, or customers, here is alist of tips to help you put your best foot forward and make a great first impression.
- Arrive early.
- Be empathetic.
- Actively listen.
- Be mindful of your body language and posture.
- Modulate your pitch and tone of voice.
- Choose your words wisely.
- Dress the part.
- Make eye contact.
- Know your audience.
- Come prepared.
- Be authentic.
- Put your phone away.
- Make a connection.
- Don’t forget to follow up.

14 Tips for Making a Good First Impression
1. Arrive Early.
Actor Billy Porter said it in his book Unprotected: A Memoir, “Fifteen minutes early is on time, on time is late, and late is unacceptable.”
Arriving a little early for a meeting shows your punctuality and gives you a little more time to ensure everything is in place. If you’re giving a presentation, arriving early gives you a moment to test the equipment you’re using. If you’re early to a job interview, you’ll have time to go over your elevator pitch to yourself, adjust your tie, or make sure your hair isn’t out of place.
2. Be Empathetic.
Empathy is the ability to understand and share the same feelings as another person. It can help you come across as personable when it comes to first impressions. Of course, you want to be professional and not cross boundaries. However, showing that you understand the person or group you’re speaking to and that what they’re saying resonates with you will help you form a genuine connection.
To show empathy, ask questions with genuine curiosity and listen to understand — not just respond. And make a point to stay focused and engaged in the interaction.
3. Actively listen.
Most people don’t like repeating themselves or answering the same question multiple times — it makes them feel like they aren’t being listened to. You don’t want your first impression to be that you’re an inattentive listener, so practice active listening.
Active listening is giving the speaker your undivided attention and paying attention to what’s said and the intention behind it. Listen for opportunities to ask questions pertaining to the discussion. Asking the right questions shows you’re engaged — just don’t ask something the speaker already answered.
4. Be mindful of your body language and posture.
When you’re meeting someone for the first time, keep your posture open — don’t tightly cross your arms or legs, ball your hands into fists, or hunch over in your seat. Lean in when you talk to show you’re actively listening and tuned into the conversation. Don’t be afraid to take up some space at the table. If you usually use hand gestures or move around to communicate, don’t hold back. You don’t want to appear stiff and uncomfortable.
These nonverbal cues can make a powerful subconscious impact, so be aware of your body language and posture during meetings in general — particularly during initial pitches or interviews.
Refrain from tapping, touching your face too often, placing objects in front of yourself, blinking excessively, and sitting or standing too close to others (respect the bubble, people). Some body language habits can suggest dishonesty, such as avoiding eye contact and touching your mouth, so avoid those habits as well.

5. Modulate your pitch and tone of voice.
A high-pitched tone of voice can make you seem childish or nervous — especially if you tend to “uptalk” or use a rising inflection at the end of your sentences.According to the Corporate Finance Institute, job interviewers may get the impression that a candidate is insecure or unsure of themselves if they speak with an upward inflection. This is because upward inflections make sentences sound more like questions than statements.
Not sure if you’re guilty of this? Try practicing your presentations or recording yourself reading aloud. You’d be surprised at how different you sound to others versus in your own head.
Be sure to speak clearly and at a steady pace (not too fast and not too slow), and avoid filler words such as “um,” “ah,” and “like” because those words show hesitation. Try practicing not relying on filler words in front of a camera to train yourself.
6. Choose your words wisely.
Words matter even more than you think. Positive and persuasive words and phrases will often open doors and make people feel comfortable in your presence, ultimately making them more willing to work with you.
For instance, let’s look at many marketers’ favorite show: Mad Men. Some of Don Draper’s best pitches (e.g., Carousel and Lucky Strike) were full of positive language. That said, positive language doesn’t need to be cheesy or trendy, as Draper illustrates. Instead, positive language can uplift your audience by simply being clear and straightforward.
This point is especially valuable if you’re making a first impression in a job interview. You want potential employers to find you positive, flexible, and capable, so use language that reflects optimism and agency instead of negativity.
7. Dress the part.
Regardless of how little you personally care about fashion or style, what you wear matters. While you want to look clean and neat, it’s also essential to match or slightly exceed the relative level of formality of the person or business you are meeting with — whether that is business formal, highly casual, or something in between.
“You are your brand, especially if you are a business owner, so making sure that your look communicates your best self is important,” explains Laurel Mintz, CEO of Elevate My Brand.
If you want to show off your personality, try including one accessory that could be considered a memorable item or even a conversation piece. This could be anything from a unique piece of jewelry to a fancy tie to a pair of fun socks.
For example, former Jacksonville, Florida, television reporter Ken Amaro is known to sport a bow tie in all his TV appearances. While he wears most reporters’ typical professional suit attire, the bow tie helped him stand out. It even became the name of an annual golf tournament in Jacksonville — The Ken Amaro Bow Tie Golf Classic.
8. Make eye contact.
Focus on the person or people you are speaking with. It’s hard to connect with someone when you’re looking down at a screen, so try to make eye contact with everyone in the room.
However, keep in mind that if some people aren’t already persuaded or inclined to be on your side, they may focus more on your mouth or any presentation materials you’re showcasing instead of your eyes. This can make maintaining eye contact difficult, but if you speak clearly, concisely, and appear confident — you should eventually be able to gain your audience’s attention enough to shift their focus to your eyes.
9. Know your audience.
Do your research. If your meeting is planned in advance, you should know plenty about the person or business you’re meeting with before arriving. Google the people you’ll meet, the company founders/co-founders, their history, their competition, their main products, and any other relevant information before you walk into the room.
To gather the background information you need, check the company’s website or the LinkedIn profile of whoever you plan on speaking to. Some companies and organizations have Wikipedia pages as well. I know there has always been debate over Wikipedia’s reliability, but scrolling down to the “Reference” section of a Wikipedia article will take you to different articles, videos, and other sources of information to draw from.
10. Come prepared.
There’s nothing worse than an unproductive meeting. To make a great first impression, respect everyone’s time. If you’re meeting with someone working remotely, plan accordingly. Is your laptop WiFi reliable? Is your device (phone, computer, etc.) charged and working correctly? Did you test your web camera if you’re using one?
The last thing you want is for a meeting or interview to run long because you spent half the time fixing an awkward mishap. That said, if you’re being productive and everyone has the bandwidth, it might be okay if the meeting runs long — just make sure you check in with the group before making the call. Meeting time management is key to building an engaged group of clients or colleagues. Plus, it shows respect for their schedules.

11. Be authentic.
When you’re meeting someone for the first time, don’t try to be someone you’re not. If you don’t know the answer to something they ask, don’t fake it. The ability to lean into your weaknesses shows that you are self-aware.
However, don’t over-emphasize your shortcomings, either. It might seem shockingly simple, but over-highlighting weaknesses and how you might fix them could cause you to focus on the negatives — making them the most significant part of your overall impression.
While you don’t want to hide any weaknesses (people will likely figure it out anyways), you do want to be honest and move on to your good qualities — especially at the beginning of a business relationship.
12. Put your phone away.
That goes for tablets, laptops, and other electronics, too. It’s one thing to use technology to deliver a presentation, but if they’re not needed — turn off sounds and vibrations on your mobile devices and put your screens away. Give your complete and undivided attention to the people you’re meeting for the first time to convey your commitment, focus, and good manners.
13. Make a connection.
Pay close attention to who you’re meeting with for the first time and try to forge a connection based on what they share with you. Whether it’s their alma mater or their hometown, developing a connection outside the professional conversation can be a great way to build rapport.
Just don’t be too forward. Avoid making comments about their appearance that could be perceived as inappropriate, and stick to connections you might have in common. Those are more genuine than compliments, anyway.
14. Don’t forget to follow up.
After an initial meeting, don’t forget to follow up by sending any necessary information such as notes, presentation docs, next steps, or a simple thank you email.
These small gestures will help prove that you’re serious about the connections made and the information shared and that you’re making them a priority rather than just another task to check off your to-do list.
Sending out updated information after a meeting can also be a way to get a second chance at a first impression. How so? It helps to show another side of you or your business — perhaps a more responsible side. It also allows you to clear up any misunderstandings or expand upon points you made in the initial meeting.
Don’t let a negative first impression get in the way of your ability to get to know someone. Follow these 14 tips to ensure that the first time you meet with someone won’t be the last.
Now, learn how to shoot a new professional headshot that makes an excellent first impression before you even meet your colleagues.

How To Be a Good Interviewer
Having a good conversation with a candidate helps you understand who they are, their skill set, and what they’d bring to your team.
So, being a good interviewer goes hand-in-hand with hiring successful talent that can contribute to meeting your business goals.
Read on to learn everything you need to know about becoming an effective interviewer.

Why is it important to be a good interviewer?
Being a good interviewer is essential because it helps you hire the right people for the job. Therefore, the skill is key for any employer that wants to hire the right candidates who are motivated, able to do the job, and are a good cultural fit for the company.
Being a good interviewer also shows respect for the interviewee. It demonstrates that you value their time and insights and are willing to invest the effort to get to know them better.
How to Be an Effective Interviewer
The best interviewers make interviews feel like conversations instead of interrogations, and they work to develop rapport with candidates to help them feel comfortable opening up and sharing information about themselves.
Let’s go over how to do this.
1. Start the conversation on a lighter note.
Candidates may be nervous at the beginning of the interview, so it can always be helpful to make small talk and begin the conversation on a lighter note before the actual interview starts. However, make sure you don’t spend so much time on small talk that you need to cut the interview short later on.
2. Do your research.
Re-review the candidate’s application, resume, and cover letter before the interview, so you know their qualifications and why they’re interested in the role.
This gives you a refresher on their background and helps you generate focused questions about what they’ve already shared that will help you dig deeper into their interest in and relationship to the role.
3. Ask open-ended questions.
Open-ended questions encourage candidates to elaborate on their answers and give you more information to work with. When you do this, ensure that you give the interviewee time to answer the question entirely.
This also means avoiding yes or no questions when not entirely necessary. For example, you can confirm with someone that they spent three years working at their last company, but asking a yes or no question about their role at said company doesn’t give you the information you’re looking for.
3. Listen more than you talk.
Aim to do more listening so you can gather as much information as possible. This is a quick tip because it leads directly to the next tip: practicing active listening.
4. Practice active listening.
Active listening is a communication style that involves focusing entirely on the person who is speaking so you can take in what they’re saying and participate in the conversation in a meaningful way.
It’s important during interviewers because it helps you learn more about the candidates and ask relevant follow-up questions when they have said something you want to learn more about.
Active listening is also an important part of being a good interviewer because it shows respect for the candidate. They can likely tell if you’re not fully immersed in what they’re saying, and if they feel you’re not interested, they may feel less confident in sharing information about themselves. Instead, active listening shows them that they have your full attention and you’re genuinely interested in learning more about them.
5. Take notes.
Taking notes goes hand in hand with active listening because it shows that you’re actively listening to what the candidate is saying. It is also a way for you to note something a candidate says that you want to ask them about later instead of interrupting their train of thought.
Taking notes also gives you a refresher on your conversations with candidates when you’re making final hiring decisions in the future.
6. Be aware of your body language.
Body language that shows attention and respect for the candidate can help them feel more comfortable opening up and sharing information about themselves. As a result, your body language during an interview makes a big difference in being a good or bad interviewer.
So, aim to make eye contact, smile, and avoid crossing your arms or fidgeting. A lack of these things can make an interviewee feel like you don’t want to be there, making them feel anxious and that you care about what they have to say.
8. Eliminate distractions.
Eliminating distractions is helpful for you and the candidate because anything that shifts focus away from the conversation can affect how well the interview goes. For example, an alarm that goes off can cause someone to lose their train of thought on a valuable piece of information.
9. Be prepared to answer questions.
Most candidates will have questions for you, such as what a day-to-day looks like for the role they’ve applied for, what company culture is like, and what your team is like, and you should be prepared to answer them.
Candidates are also interviewing you and your business, so answering their questions and giving them the information they need helps them ensure they are a good fit.
For example, if a candidate realizes that they might not be a good fit for your company, they save you the stress that can come from someone accepting an offer and promptly leaving the company if they come to that realization after they’ve begun the job.
Being a good interviewer helps your team meet your goals.
Someone who can put candidates at ease and help them feel comfortable talking about their experience and sharing their skills is a great interviewer because the more you learn about the candidate, the easier it is to make an informed decision about their fit for the role.
Next time you have an interview, leverage the tips mentioned above, and you’ll likely find yourself having valuable conversations and hiring impressive candidates that can help you meet your business goals.

15 Brands That Demonstrate Social Responsibility in 2022
Consumers want brands to make a difference.
In fact, Havas’ Meaningful Brands Report 2021 found that 73% of respondents think brands must act now for the good of society and the planet. In that same survey, 64% of respondents said they prefer to buy from companies with a reputation for purposeful action, not just their profits.
When brands act for the good of society and the planet, they’re being socially responsible. In this post, we’ll discuss:
- What is social responsibility?
- How can brands be socially responsible?
- 15 Socially Responsible Brands

What is social responsibility?
For businesses, social responsibility is showing care and value for society and the planet in addition to, or equal to, how much care is shown for their profits and their bottom line.
How can brands be socially responsible?
Brands can be socially responsible by ensuring employees have a safe work environment and are paid a living wage, charitable giving to programs that give back to the community, championing diversity, equity, and inclusion, sustainable business practices, — the list goes on.
Early 2020 brought many businesses to a reckoning regarding social responsibility, as social justice issues were at the forefront of many conversations during the first few months of the year.
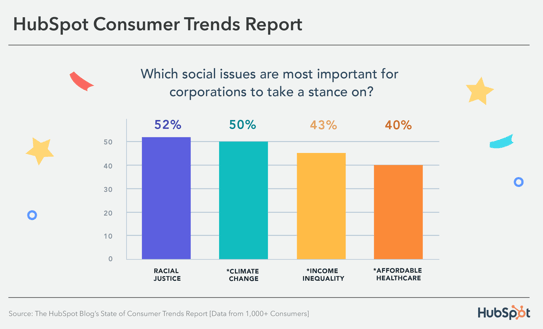
Consumers still want brands to be responsible — in fact, 45% of people think that brands need to do more to advocate for social justice issues. The social issues that consumers believe businesses should take a stance on are racial justice, climate change, income inequality, and affordable healthcare.
Let’s go over some examples of brands that exemplify social responsibility that you can take inspiration from.
15 Socially Responsible Brands
1. Back Market
Back Market combats the tons of waste produced by electronic devices by refurbishing used electronics and selling them to consumers. The business encourages consumers to trade in their used electronics for cash instead of throwing them away and also provides an eco-friendly alternative to those looking to buy.
2. Warby Parker
Warby Parker is famous for its at-home try-on program, where customers can try glasses frames at home before committing to a purchase.
Its Warby Parker Impact Foundation works with government agencies, nonprofits, and local community groups to increase access to vision care for adults and children underserved in this type of care. In addition, its Buy a Pair, Give a Pair program donates one pair of glasses per pair bought and, to date, has distributed over 10 million glasses.
3. Ben & Jerry’s
Ben & Jerry’s is famous for taking a stand on global issues like refugee rights, LGBTQ+ rights, climate justice, voting rights — the list goes on.
To raise awareness for these issues, it partners with nonprofits to build support with its customers, and the Ben & Jerry’s foundation regularly gives funding to businesses in Vermont (its home state) and around the country that work to facilitate social change.
4. Oliberté
Oliberté founded the world’s first fair trade certified factory in Ethiopia. It has since transferred its operations to Canada but continues to show commitments to employee equity by giving employees a percentage of the earrings for every pair of shoes sold, where “sold” begins when a shoe has left the factory.
It is also part of the One Perfect for the Planet Program, where at least one percent of annual sales are contributed to environmental causes.
5. Patagonia
Patagonia is known for its environmentalist practices, like supporting grassroots activists through funding. Its Worn Wear program encourages customers to give their used Patagonia clothing back to the business to be refurbished and resold instead of throwing it away, and Patagonia Provisions makes and sells organic foods that ensure healthy soil, are cultivated under ethical employee conditions, and fair and humane treatment of animals.
6. EnrichHer
EnrichHer is a finance technology platform that gives small women-owned businesses loans to help with business operations. It also offers training programs with one-on-one and peer support, tools to help owners access funding, and networking opportunities to help businesses find resources and tools to help them better their business.
7. IKEA
IKEA is dedicated to environmentalism with its plans to use only sustainable materials and recycled or renewable plastic by 2030. The IKEA Foundation also works with NGOs to create employment and entrepreneurship programs and funds environmental ventures around the world, like renewable energy projects.
8. Cracked It
Based in the UK, Cracked It is a phone repair service that employs formerly incarcerated youth, a community often discriminated against and looked over when seeking employment. It teaches job-relevant and life skills and prepares youth for future employment opportunities to come down the line.
9. Allbirds
Allbirds, a footwear and apparel company, uses natural, renewable, and sustainable materials to create its products, demonstrating a commitment to environmentalism and sustainability.
Allbirds Flight Plan lays out the business’ sustainability commitments that culminate in cutting its carbon footprint in half by 2025 through investments in regenerative agriculture, renewable energy, and responsible energy use. Allbirds ReRun is similar to Worn Wear, and used products are donated, refurbished, and resold to reduce waste.
10. Cora
Cora sells organic personal care products and, with every purchase, donates products and body literacy resources to communities often overlooked in related discussions. 75% of the donations it makes are to organizations that serve BIPOC communities and, to date, has donated 6,600,000 products and diverted 14,000 from landfills.
11. Loop
Black people in Black communities pay 70% more for car insurance than those in predominantly White upper-middle-class neighborhoods. Loop, an AI-powered car insurance company, recognizes the disparity and commits to making car insurance more equitable, available, and affordable for people of color, most significantly by only considering factors related to driving history.
12. Glass Half Full
Glass Half Full is a Louisiana-based business that collects glassware that it recycles and repurposes into sand and glass cullet. Its outputs help the environment, as the sand can be used for disaster relief, coastal restoration, and eco-construction, and glass cullet can be repurposed into new glassware.
Since its creation, it has diverted 2 million pounds of glass from NOLA landfills.
13. Culture Brands
Culture Brands is an agency with media platforms and consumer brands that engage directly with the African American community, helping people feel seen and engage with content related to their experiences. Because Of Them We Can is one of its platforms that shares content that amplifies Black voices and entrepreneurial successes.
14. Tony’s Chocolonely
Tony’s Chocolonely is a chocolate company committed to environmentalism and equitable and fair working conditions.
Tony’s Open Chain sourcing principles outline the business commitments, including paying a premium for cocoa beans to ensure farmers receive a living wage, and CLMRS, which identifies illegal child labor and improves the living conditions for farmers and their families.
It also helps its customers learn more about chocolate farming practices, as they can trace the entire lifecycle of the bean that made the chocolate bar they hold in their hands.
15. Accion International
Accion International’s mission is to build a financially inclusive world by providing economic opportunities to communities often overlooked and left out of financial conversations.
It provides financial support to low-income entrepreneurs, entrepreneurs of color, and women, in addition to educational resources, coaching, and business networks that can be helpful when it comes to building and growing a business. In 2021, Accion International was able to reach and impact 220M+ people.


Phone Photography 101: How to Take Good Pictures With Your Mobile Device
Before the days of smartphones — if you can remember such a time — taking a great photo was a labor-intensive process. Now, it’s easy to master how to take good photos with your phone — no fancy cameras or desktop editing software required.
Brands are catching on, too — these kinds of visuals remain important to marketing. But make no mistake: Taking a great photo on your smartphone is not as simple as pointing and shooting. There are plenty of bad smartphone photos out there — I’m sure you’ve seen at least a few.

What’s the secret to taking great pictures with your smartphone, then? As it turns out, there are a few of them. Check out these tips below to improve your smartphone photography game. (And once you have the photo-taking part down, check out some of the best photo editing apps for mobile.)
How to Take Good Photos With Your Phone: 25 Tips & Tricks
1. Use gridlines to balance your shot.
One of the easiest and best ways to improve your mobile photos is to turn on the camera’s gridlines. That superimposes a series of lines on the screen of your smartphone’s camera that are based on the “rule of thirds” — a photographic composition principle that says an image should be broken down into thirds, both horizontally and vertically, so you have nine parts in total.
According to this theory, if you place points of interest in these intersections or along the lines, your photo will be more balanced, level, and allow viewers to interact with it more naturally.

To switch the grid on …
- iPhone: Go to “Settings,” choose “Photos & Camera,” and switch “Grid” on.
- Samsung Galaxy: Launch the camera app, go to “Settings,” scroll down and switch the “gridlines” option to “on.”
2. Set your camera’s focus.
Today’s phone cameras automatically focus on the foreground of your frame, but not every picture you take on your phone has an obvious subject. To adjust where you want your camera lens to focus, open your camera app and tap the screen where you want to sharpen the view.
If you’re taking a photo of something in motion, for example, it can be difficult for your camera to follow this subject and refocus as needed. Tap the screen to correct your phone camera’s focus just before snapping the picture to ensure the moving subject has as much focus as possible. A square or circular icon should then appear on your camera screen, shifting the focus of your shot to all of the content inside that icon.
3. Use HDR mode.
High dynamic range or HDR, is a camera app feature that helps balance the light and dark elements in a high-contrast photo. It can be used to give photos a more creative, or artsy vibe, but it is commonly used to produce an image that looks similar to how you see it with your eyes.
Often with smartphone cameras, it’s hard to get the perfect exposure for light and dark areas. You could be taking a photo of someone in a shaded area outside against a bright background or in a room with low light against a bright wall. Setting the exposure to the background could make the person being photographed underexposed. Conversely, setting the exposure to the subject could result in the background being overexposed.
HDR prevents this by retaining both the details in darker areas and shadows and bright areas. The iPhone takes photos in HDR by default. For android phones, you may need to adjust HDRsettings manually.
4. Use natural light.
It’s hard to find a great smartphone photo that was taken with a flash. Most of the time, they make a photo look overexposed, negatively altering colors and making human subjects look washed out.
Take advantage of the sources of natural light you can find, even after dark. This gives you a chance to play with shadows, like in the second image below, or create a silhouette with other ambient sources of light, like traffic and surrounding buildings.

Once you’ve taken the photo, play with the “Exposure” tool in your favorite photo editing app to see if you can make the image slightly brighter, without making it too grainy.
5. Focus on one subject.
Many of the best photos include just one, interesting subject. So when taking a picture of one, spend some extra time setting up the shot. Some professional photographers say that the subject shouldn’t fill the entire frame, and that two-thirds of the photo should be negative space — that helps the subject stand out even more.
But be sure you tap the screen of your smartphone to focus the camera on your subject — that’ll help to ensure that it’s focused and the lighting is optimized.
Pro Tip: Once you’ve taken your photo, you can use filters and apps to make the subject even more vivid, or to crop it to frame the subject correctly. The brightness, contrast, and saturation of the photo can also be adjusted accordingly — all from your phone.

6. Hold your phone still.
While smartphones have given us the benefit of taking photos on the go, the cameras on our phones are still sensitive to movement. To help avoid blurry or warped photos, steady your camera first.
You can lean on a friend or wall to prevent your arms or hands from wobbling, or prop your phone up using books or similar objects to steady your phone.
7. Consider buying a mobile tripod.
Although mobile devices make it easy to snap any photo on the go, there’s never been an easy way to ensure the shot stays level and balanced when you shoot — especially if you want to be in the picture and not just take a typical selfie with your extended arm.
Mobile tripods give you the freedom to mount your smartphone for quick hands-free shots without lugging any heavy equipment with you. Most mobile tripods are barely bigger than your mobile device and can bend to any angle. Learn how these miniature tripods can help enhance your mobile video experience below.
8. Embrace negative space.
“Negative space” simply refers to the areas around and between the subjects of an image — and it can take a photo from “good” to “great.”
When you include a lot of empty space in a photo, your subject will stand out more and evoke a stronger reaction from your viewer. And what does negative space look like? It’s often a large expanse of open sky, an empty field, a large wall, or water, as in the example below.

9. Find different perspectives.
Taking photos from a unique, unexpected angle can make them more memorable — it tends to create an illusion of depth or height with the subjects. It also makes the image stand out, since most mobile photos are taken either straight -on or from a bird’s eye view.
Try taking a photo directly upward and playing with the sky as negative space, like in the first photo below. Or, you can try taking it at a slight downward angle.
Pro Tip: If you take a photo and find the perspective is a little askew or tilted, use the SKRWT photo editing app to make the lines look clean and square.

10. Play with reflections.
There’s something so idyllic about seeing the sky reflected in a body of water. There’s a reason why we love seeing that — our eyes are drawn to reflections. So look for opportunities to play with them in photos.
There are plenty of out-of-the-box places to find reflections — puddles, larger bodies of water, mirrors, sunglasses, drinking glasses, and metallic surfaces are just a few.

11. Use leading lines.
In some photos, there’s a line that draws the viewer’s eye toward a certain part of the frame. Those are called leading lines. They can be straight or curvilinear— think staircases, building facades, train tracks, roads, or even a path through the woods.
Leading lines are great for creating a sense of depth in an image, and can make your photo look purposefully designed — even if you just happened to come upon a really cool shape by accident.

12. Look for symmetry.
Symmetry can be defined as “a vague sense of harmonious and beautiful proportion and balance.” And pictures that contain symmetry can be incredibly pleasing to the eye — it’s also one of the simplest and most compelling ways to compose a photo.
In photography, symmetry usually means creating an image that can be divided into two equal parts that are mirror images of each other. That’s a bit different than reflections — symmetry can be found “in the wild,” as per the staircase picture, or you can set up your photo accordingly, like photographer Eric Christian did in the first photo below.
And remember — use those gridlines from tip #1 to line everything up perfectly.

13. Keep an eye out for repetitive patterns.
Repetitive patterns are very pleasing to the eye — they appear whenever strong graphic elements are repeated over and over again, like lines, geometric shapes, forms, and colors. These patterns can make a strong visual impact, and photographing something like a beautiful, tiled floor can be enough to create a striking image. Other times, it’s more fun to keep an eye out for where they appear naturally or unintentionally, like with the congruent fire escapes on the left.

14. Play around with color blocking.
Isn’t it cool when an entire photo is black and white, except for a single object? It turns out that yes, indeed, there are apps for that. One of our favorites is Touch Color — an app that automatically converts a picture to grayscale and lets you fill in the parts you want to colorize.
Color blocking can help to highlight the elements of a photo that you want to stand out, like a plant or something else with a bold hue. It achieves a similar goal as negative space, in that it can help a single subject stand out — but with color blocking, the photo’s other elements remain intact for a cohesive image.

15. Avoid zooming in.
When you take a photo from a distance, it’s tempting to zoom in on something specific you’re trying to capture. But it’s actually better not to zoom in — doing so can make the photo appear grainy, blurry, or pixelated.
Instead, try to get closer to your subject — unless it’s a wild animal, in which case we would advise keeping your distance — or take the photo from a default distance, and crop it later on. That way, you won’t compromise quality, and it’s easier to play around or optimize a larger image.
16. Capture small details.
You may have heard the phrase, “It’s the little things.” Sometimes, that also applies to photos. Close-up images that capture small, intricate, and delicate details can make for really compelling visual content. Keep an eye out for textures and patterns like peeling paint, a gravel road, or a tile tabletop.
Pro Tip: Use the “sharpen” tool in your favorite photo editing app to (conservatively) sharpen the details of your photo. You might also download the Camera+ app and use its Clarity filter, which is what The Wall Street Journal‘s Kevin Sintumuang calls the app’s “secret sauce — it adds pro-camera crispness to almost any shot.”

17. If you use flash, only do so during the day.
Sometimes, using your camera’s flash can improve a photo — but rarely does it do so at night. Because dark shots reveal a much sharper contrast against your phone’s flash, it can make any flash look invasive and uneven
In already well-lit spaces, however, a flash can help to soften some dark shadows behind or beneath your main subject.
When framing your next shot, look on the ground or against vertical surfaces for any dark shadows you might want to remove. If you see any, flip on the flash manually in your camera app. Setting your phone’s camera flash to “auto” won’t guarantee that your phone will notice the shadows you want to get rid of. Just remember to turn the flash off again when you’re done.
Consider the importance of flash for enhancing or hiding certain lines and features the next time you’re shooting product photography.
18. Set your camera app’s exposure manually.
Another mobile camera feature you’ll want to set manually is your exposure. Tapping your screen when your phone’s camera is on doesn’t just refocus the lens on a new subject — it also automatically adjusts how much light the camera lets in. This, too, won’t always look just right. It’s best to adjust it by hand.
To change your mobile camera’s exposure by hand, open your camera app and tap the screen. When you see the lens refocus, you’ll see a very small sun icon and a vertical scale. Slowly swipe your finger up and down this scale to adjust the light level.
19. Create abstracts.
Abstract photos are meant to capture the essence of an object, or a series of them, without revealing the entire landscape as a whole. In other words, they serve the purpose of creating unique, surprising images from ordinary subjects.
This look can be accomplished by cropping an abstract portion of an otherwise normal photo, or by taking close-up shots of objects that leave the viewer wondering — in admiration, of course — what the subject might be. And subjects with patterns or repetition are great candidates for abstract photography, like in the photo of sliced figs below.

20. Take candids.
Posed photos can be great for the sake of memories — happy moments with friends, family, or the occasional run-in with a celebrity. But sometimes, candid shots of people doing things, or people with people, can be far more interesting.
That’s because candid photos are better able to effectively capture the emotion and essence of a moment. One of the best ways to capture this kind of shot is to just take as many photos as possible. You’ll have more to choose from, and the best photos often happen when the “stars align,” so to speak, in a single moment — everyone’s eyes are open, one person is tilting their head just so, and you finally got a shot of your chronically closed-lip friend smiling with his teeth.

21. Be unconventional.
Composition is a huge part of what makes a photo great, but so is the photo’s subject. Some of the most delightful and remarkable photos come out of cool, unique ideas. Images are more effective than text at evoking emotion from your viewers — that often means getting your photos to say something.
Try thinking outside of the box when it comes to what you’re capturing — your viewers could be pleasantly surprised by a cool or unexpected subject.

Want more tips on creating visual content? Check out these examples of explainer videos.
22. Make ’em laugh.
Speaking of evoking emotion, sometimes the most memorable photos are the ones that make us giggle. The image below of an older woman wearing a brightly-colored shirt stating “Hi hater” is funny because it’s unexpected — and there’s a part of us that admires her, too. The second image of the dog toy on a dinner plate pokes fun at classic Instagram food shots, but it’s from a dog’s perspective. If you can make your audience laugh, they’re likely to enjoy your photo.

23. Clean your phone’s lens.
A smartphone camera might be more convenient to carry around than a full-fledged photojournalist’s camera, but it comes at the cost of protection.
Your phone is usually in your pocket or your bag when you’re out of the house. All the while, the device’s camera lens is collecting all kinds of dust and lint. Be sure to clean this lens with a soft handkerchief before taking a photo. You might not be able to tell just how dirty the lens was until you start editing your picture, and making sure the lens is crystal clear before taking a shot can keep you from starting from scratch.
24. Attach an external lens.
Want to get really fancy? External lenses are for you. There are actually several out there that can be attached to the top of your smartphone’s native camera lens — from fish-eye to wide-angle lenses, these add-ons can bring an entirely new quality and perspective to your photos.
According to Wirecutter, the best camera lenses for iPhone photography are made by Moment, a manufacturer of mobile lenses. Start there, or do some research to find the lens add-ons that fit your smartphone photography needs.

25. Don’t be afraid to edit.
Composing and taking your smartphone photo is just the first step to making it visually compelling. Editing your photos is the next step — and a very critical one, at that. Filters can be a valuable photographic tool, particularly when it comes to two goals: 1) Removing blemishes from a picture, and 2) making food look even more delicious.
Beauty filters are a common fix— and now, the iPhone photos app offers many similar filters. There are also apps like Pho.to, which can automatically retouch facial photos without a lot of work. And when it comes to those photos of your daily meals? One of the latest apps available is Foodie, which comes with its own set of filters optimized for different types of food.
But there are many other great photo and video editing apps out there for mobile devices — check out this post to see some of the best ones out there.

Take Better Photos
Thanks to our mobile devices and the editing apps that come with them, we can now take high-quality photos and edit them without too many bells and whistles — all from the same device that we use to make calls.
Editor’s note: This post was originally published in November 2018 and has been updated for comprehensiveness.

The Ultimate Guide to Google Analytics in 2022
Are you confused — even intimidated — by Google Analytics? Good news: you’re not alone. GA is notoriously complicated, and with the latest release — GA4 — things are just about clear as mud.
In fact, when I first started to delve into GA’s waters, I wondered if I’d ever truly get it. There were so many concepts to learn and reports to run. How did people ever conquer this thing?!

Lots and lots of reading plus some trial and error, it turns out.
I’m not saying I’ve reached total mastery — there’s always something new to pick up — but I’m vastly more comfortable.
And I want you to be, too. So, here’s the cheat sheet for Google Analytics/GA4. This guide might be long, but it’ll take you from zero to hero in ~7,000 words. And if you still have questions, let me know! I’m @ajavuu on Twitter.
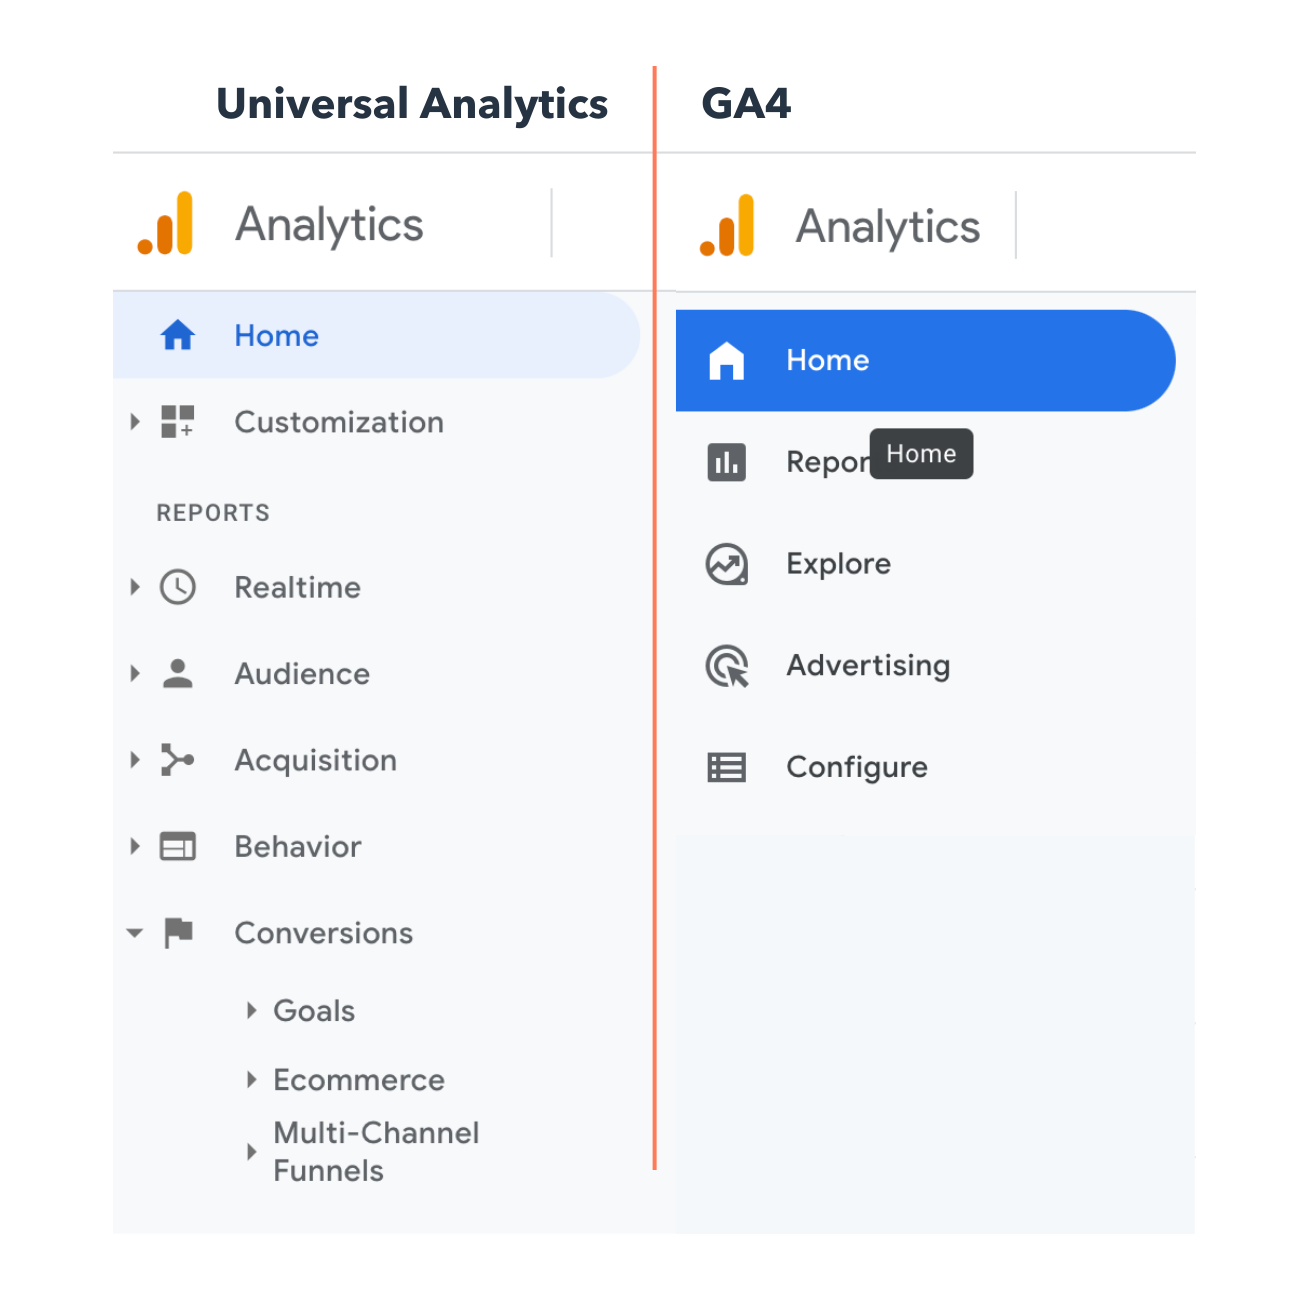
Before we move forward, you should know that there are currently two versions of Google Analytics: Universal Analytics and GA4.
What is Universal Analytics?
Universal Analytics is the current version of Google Analytics. If you set up your Google Analytics account before October 2020, you likely have Universal Analytics.
What is GA4?
GA4 is the latest version of Google Analytics. It has a slightly different UI and the reports, tools, and features have been upgraded. If you created a Google Analytics account after October 2020, you likely have GA4.
You’ll know if you have Universal Analytics or GA4 by the way your home screen looks. On the left is Universal Analytics and on the right is GA4.
Other marketing analytics options, such as HubSpot, can give you all the data you need with much less work.
Now, what steps will you need to follow when setting up GA? Good question.
Before you start using Google Analytics, you’ll have to set up a Google account. This means you must have a registered Google Account email address and password.
Once you’ve created a Google account, that doesn’t mean you automatically have access to GA — rather, you have to register for Analytics (which we’ll review how to do in the next section). But the important thing to note as you go to set up GA is that you can only access the tool by using a valid Google account.
Here are the steps on how to use Google Analytics for your website. (I’m using my class reunion website as an example.)
Step 1: Create a Google Analytics account.
First, you’ll have to create a Google Analytics account. Or, sign in to your current account.

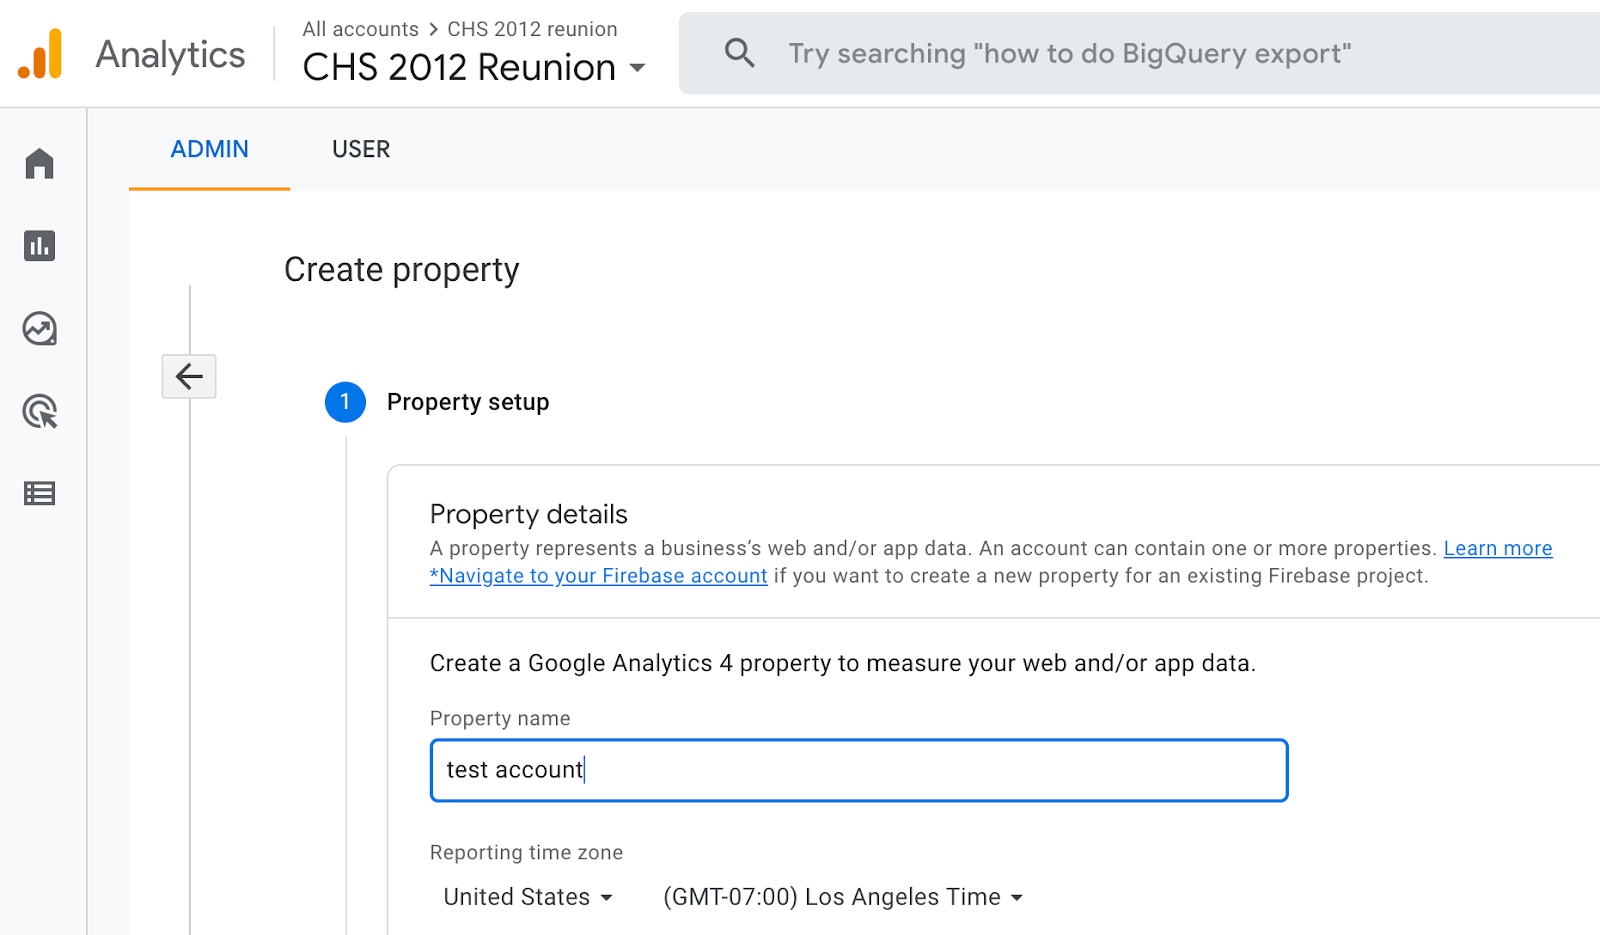
Step 2: Add the name, URL, and industry of the website you want to track.
Choose which account you want to add the property to.

You should create and name your Property at this point and enter the website’s URL as well as industry and reporting time zone. Then you’ll be able to Create and Finish this step of the process.
Step 3: Add a Data Stream or View to your property.
Note: GA4 no longer uses “Views” but it instead has “Data Streams” with similar functionality. Keep this in mind when sollowing these steps using Universal Analytics.
To add a view to your Universal Analytics account, go to the account and property you want to add a view to — use the menu to Create a View, name your view, select the type of view (web or app), and answer a few other questions. Remember, you can add up to 25 views to a property in GA.
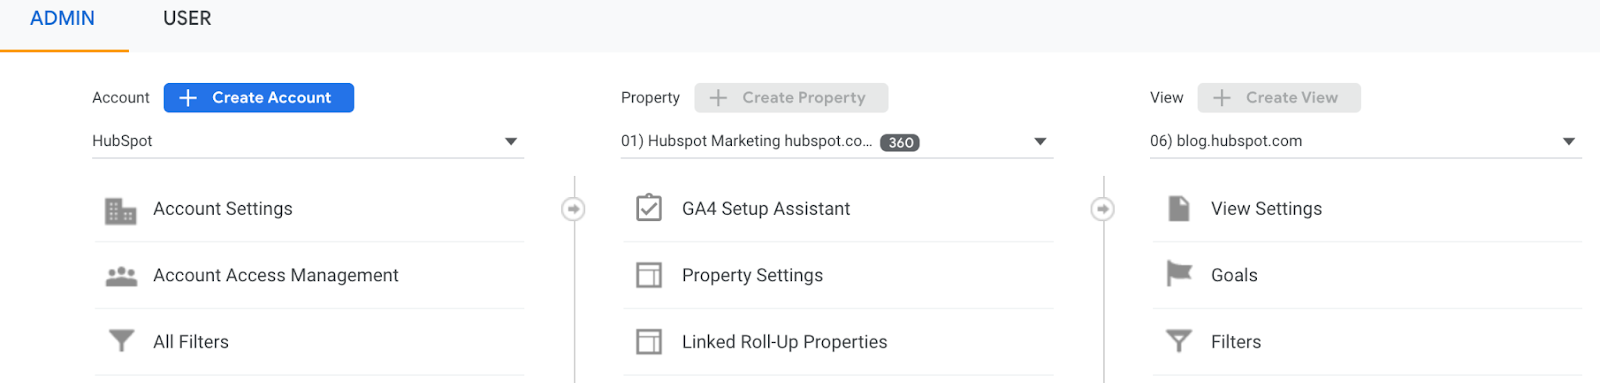
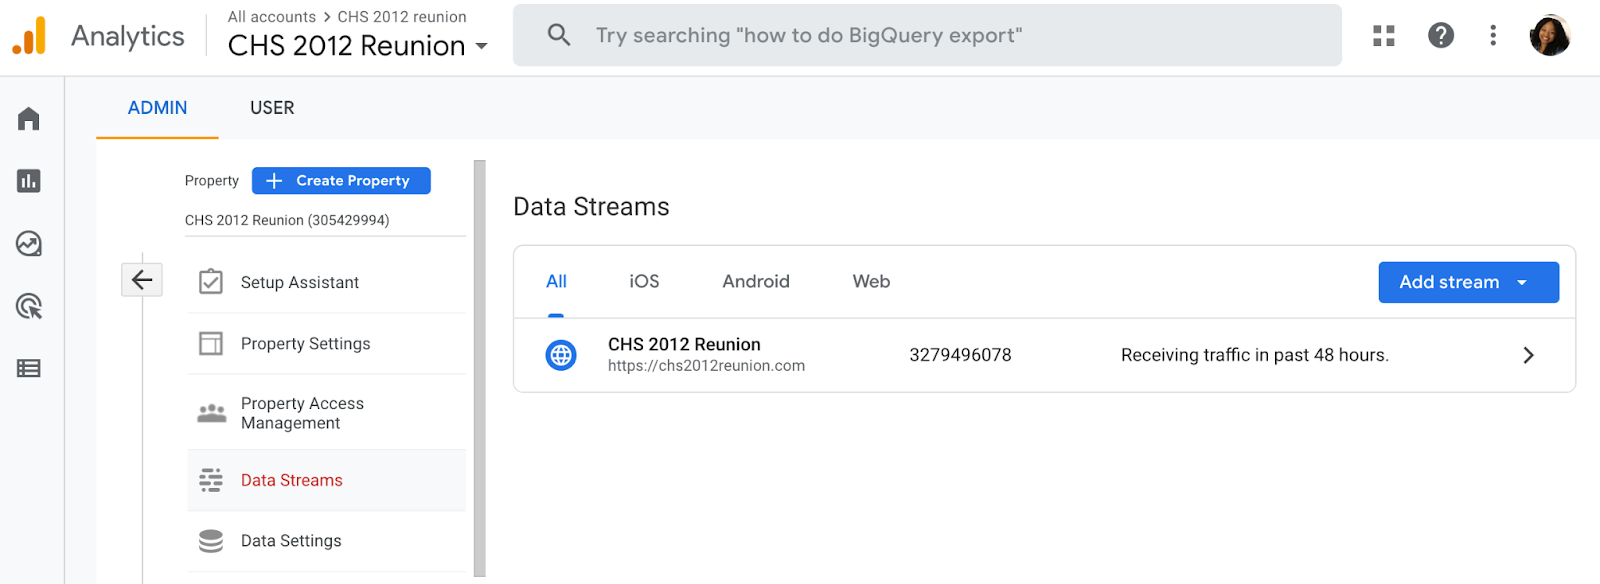
To add a data stream to your GA4 account, go to the account and property you want to add a data stream to — use the menu to add a Data Stream. Choose or add a stream, and save it.
Step 4: Add your tracking code directly after the <head> tag of your site.
When you create a property, you’ll have access to a unique ID for tracking and a global site tag (code you need to add to each site page you want to measure). This is how you’ll be able to collect data in your property.
Then, paste your global site tag right after the opening <head> tag on each site page you plan on measuring.
You’ll be asked to choose your type of site (static, dynamic, web hosting, Google Tag Manager) so that you can set up the data collection accurately.
(For more, read our guide to installing the Google Analytics tracking code on your site.)
Step 5: Visit your GA portal and verify the code is working.
Lastly, verify your code is working. You can do this by looking at the Real-Time reports section while clicking around on your site in a different tab or on your phone. The report should show at least one visitor to the site (that’s you!)

And that’s pretty much it! After that review, you may be wondering the following:
Do you need to add the GA code to every page of your site?
That’s a lot of manual work — especially if your website has more than 50 pages. Plus, what happens when you create new pages? Do you need to add the tag every time?!
The short answer is: no.
The longer answer: you only need to add the tag to every page template. So, if you have one page type on your site (meaning every individual page uses the same header module), you only need to add it to that module — and it’ll be applied to every page.
If you have two page types, you’d need to paste the code into the two separate header modules. Three page types? Three header modules.
And if you use a CMS like HubSpot, this task is even easier. These tools come with a separate field where you paste your tracking code just once. HubSpot users can follow these simple instructions for adding GA.
Additionally, to set up GA properly, you’ll want to understand the various layers of the tool — specifically, the hierarchy.
Understanding the Basics of Google Analytics
Google Analytics is made up of many parts, so it’s important to have a clear lay of the land as you begin learning. This section is dedicated to Google Analytics guidelines to help you master the basics of this powerful tool.
Google Analytics Hierarchy
Here’s a look at the GA hierarchy. Remember, Universal Analytics uses “Views” while GA4 uses “Data Streams”, so both are demonstrated in the visual below.
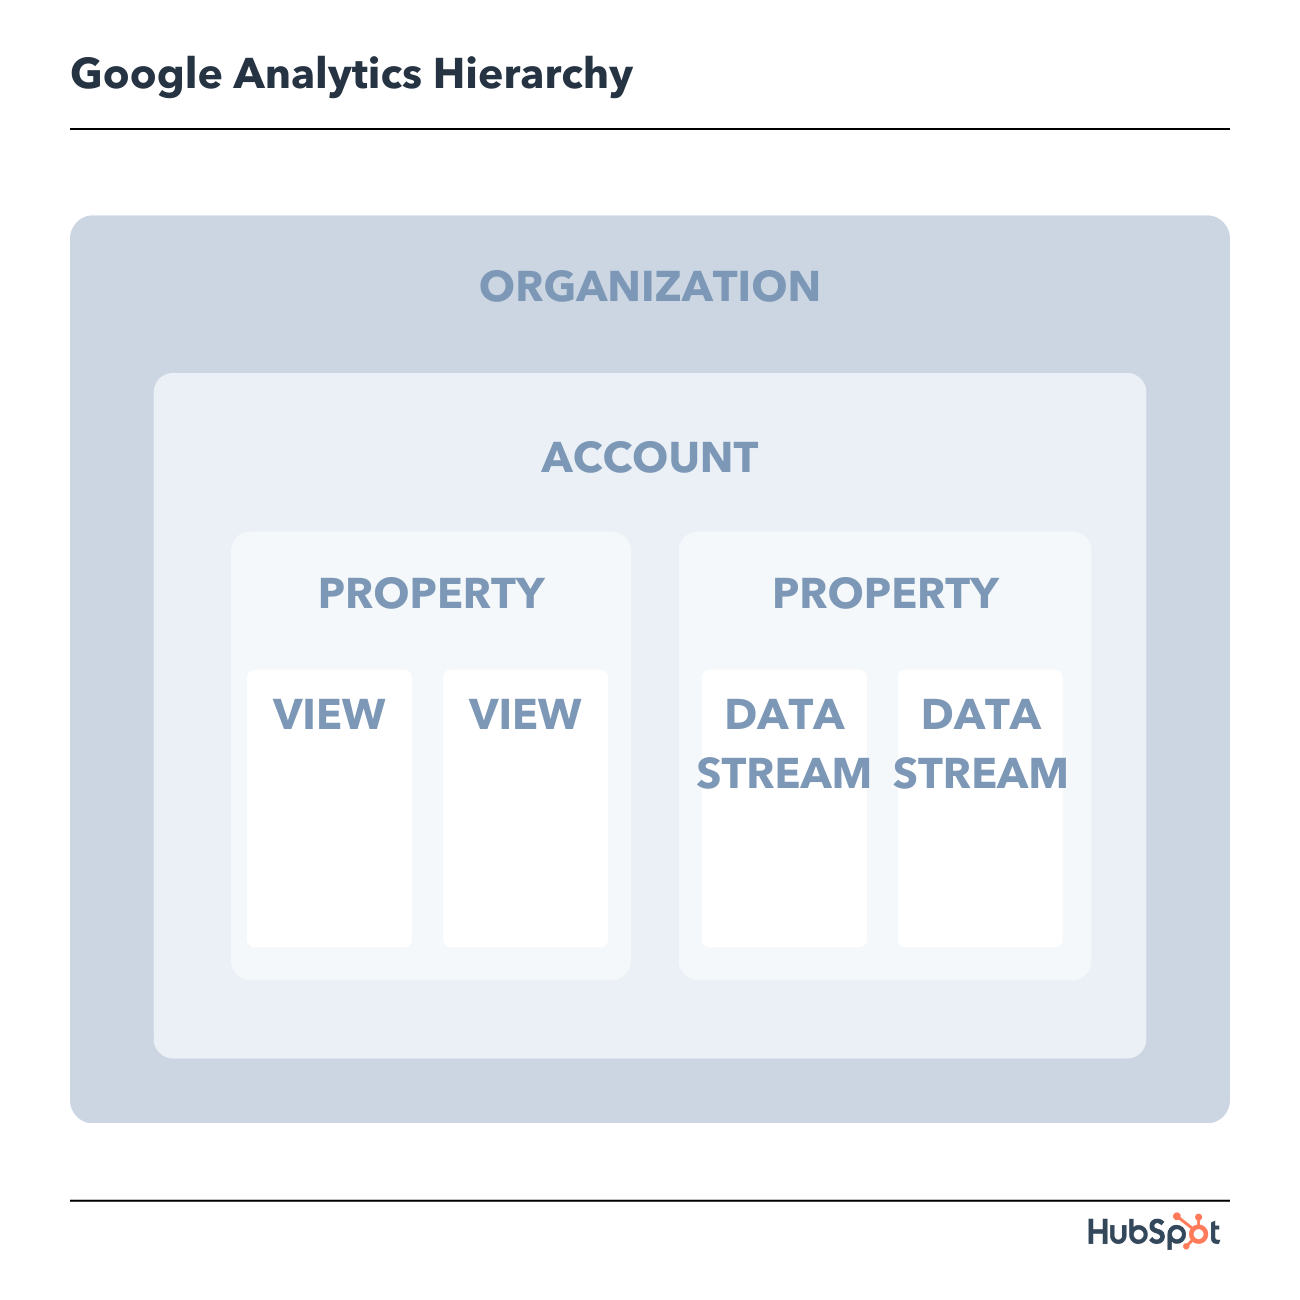
Let’s dive into each of the sections within the hierarchy.
1. Organization
The organization is the highest level. It represents a company. For example, our organization is HubSpot, Inc. One organization can encompass multiple GA accounts.
Organizations are recommended for larger businesses, but not mandatory.
2. Account(s)
Accounts are not optional. Using Google Analytics requires at least one (sometimes several) accounts.
An account doesn’t mean a user account. I can log into the HubSpot Google Analytics accounts using my Google email ID. HubSpot’s head of technical SEO can also log into the same account using his Google email ID. Our historical optimization specialist can also log into the same account using his Google email ID.
Important details:
- You can assign one property to each account or multiple properties to one account. Every account can hold up to 50 properties.
- You can give user permissions for an entire Analytics account, a property in an account, or a view in a property.
You might be wondering, “What’s better: creating a new account for every property or adding every account to the same property?”
It depends on your use case and goals.
For example, suppose you have one website — the Stark Industries corporate site — and five subdirectories, including the Stark Industries blog, careers section, media resources, case studies, and investor relations information.
You want to create separate properties for each subdirectory so the people on each team can look at how their portion of the site is performing, as well as the larger site.
But maybe you have another site that discusses Tony Stark’s work with S.H.I.E.L.D. You want the S.H.I.E.L.D. team to see data for this subdirectory, but you don’t want them to see data for the rest of the website. You create a new account and property for the S.H.I.E.L.D. site.
3. Property
A property is a website or app. Each property can support up to 25 views.
4. View
At the minimum, you need two views per property:
- One with zero configuration — essentially the “raw” version of the view
- One with filters set up to exclude any traffic from within your company (i.e. a filter for your IP address) as well as bots and spam traffic
A view only captures the information after your filters and configured settings have been applied. And once you delete a view, that data is gone forever. For those reasons, it’s critical to keep an unfiltered view of your data.
5. Data Stream
A data stream in GA4 is a flow of data that gives you more insights into how your site is performing across different operating systems. There are three preset data streams you can choose from including web, iOS, and Andriod; or you can choose to create a custom data stream.
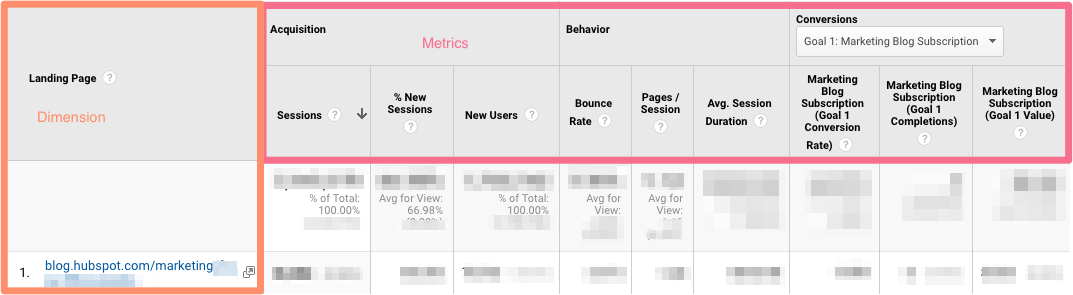
6. Google Analytics Dimensions and Metrics
To use GA successfully, you need to understand dimensions versus metrics. I’ve found the easiest way to think about it is:
- Dimensions: categorical variables. Simple examples include names, colors, and places.
- Metrics: quantitative variables. Basic examples include age, temperature, and population.
Or as my Data Analytics professor put it, “Metrics are what you can do math on.” Not the most eloquent phrasing, but it works.
Dimension Examples
- Browser
- Location
- Landing page
- Device
- Customer type
Metric Examples
- Sessions
- Pageviews
- Conversions
- Bounce rate
- Session duration
In any GA report, your dimensions are your rows and your metrics are your columns.
Custom Dimensions and Metrics
GA lets you create custom dimensions and metrics from Analytics data plus non-Analytics data. To give you an idea, suppose you track the membership type of customers who have created an account in your CRM. You could combine this information with page views to see page views by member type.
Or maybe you run a blog. If you want to understand how audience engagement impacts other metrics (like conversions, pages per session, etc.), you could create three custom dimensions for each type of reader:
- Advocate: user who shared one-plus posts on social media
- Subscriber: user who signed up for your email list
- Customer: user who purchased premium access
Using these dimensions will give you invaluable information.
7. Google Analytics Audiences
An audience is a group of users that have something in common. That commonality could be anything: maybe you’re targeting consumers in Australia, so you have an “Australian audience,” or you want to sell to millennials, so you have a “25-34 audience.”
GA comes with several built-in audiences (including the two I just mentioned, location and age). You don’t need to do a thing to set these up — once you have the tracking code installed, GA will automatically break down your visitor data into these audience reports.
However, you can also create custom audiences. Perhaps you’re only interested in “Australian millennials”; you’d need to make a custom audience that only includes visitors who are A) in Australia and B) between the ages of 25 and 34.
Creating an audience is fairly easy. Honestly, the hardest part is figuring out what you’re trying to accomplish and then identifying the user characteristics that’ll help you do that.
Once you’ve done that, follow these instructions to create a new audience segment. From there you can import a segment to use as the basis for your Audience Report.
8. Google Analytics Segments
A segment is a subset of your data. I like to picture an entire pizza made up of all different slices — one slice has pesto and mozzarella, another has sausages and spicy peppers, another has ham and pineapple, and so on. Metaphorically speaking, each slice is a segment.
You can create segments based on:
- Users (e.g. users who have bought something on your site before, users who have signed up for a consultation, etc.)
- Sessions (e.g. all sessions that were generated from a specific marketing campaign, all sessions where a pricing page was viewed)
- Hits (e.g. all hits where the purchase exceeded $85, all hits where a specific product was added to the cart)
Like audiences, GA provides you with several segments. I wouldn’t stop there: you can get incredibly granular with your segments.
To give you some inspiration, here are a few of HubSpot’s segments:
- Users who viewed a specific product page and watched the demo video
- Users who viewed the same product page and didn’t watch the demo video
- Users who view a specific Academy course page
- Users who view a specific Academy lesson page
- Users who view a blog post and a product page
The sky is your limit — well, that, and GA’s segment cap.
Google Analytics Reports
There are five primary reports available in Google Analytics that can give you insight into your website’s performance. You’ll find these reports on the lefthand size of the screen.
All of these options can be a bit overwhelming. And depending on which version of Google Analytics you have (universal analytics or GA4), you’ll see different reports.
Let’s walk through each report together. First, we’ll start with Universal Analytics reports and then move on to GA4 reports.
Universal Analytics Reports
1. Google Analytics Real-Time Report

As the name suggests, the Real-Time report gives you insight into what’s happening on your site at this very moment. You can see how many visitors are on your site, which pages they’re visiting, which social platforms they’re coming from, where they’re located, and more.
While this report is fun to look at occasionally, it’s probably the least valuable. Here are some ways to use Real-Time:
- See how much traffic you’re getting from a new social or blog post
- Know immediately if a one-day sale or event is driving views and/or conversions
- Make sure tracking URLs and custom events that you’ve just set up are working as they should
These are useful, but as you’ll see, the other reports pack a far greater punch.
2. Google Analytics Audience Report
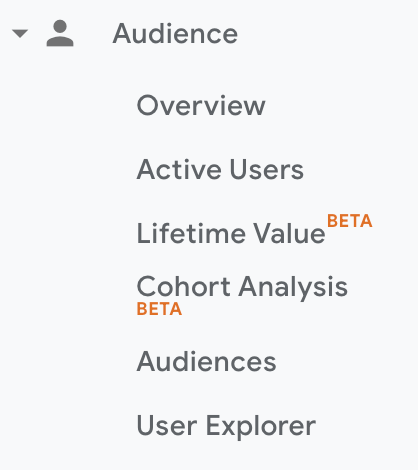
The GA Audience report gives you a high-level overview for the property you’re currently looking at. Check this report once a day to get a sense of how you’re trending overall.
Underneath “Overview,” you’ll see “Audiences,” as well as expandable menus for “Demographics,” “Interests,” “Geo,” “Behavior,” “Technology,” “Mobile,” “Cross-Device,” “Custom,” and “Benchmarking.”
Explore each of these sections to get a sense of what they can tell you about your visitors.
Every section describes an audience.
Active Users
Whoever named this report belongs in the same group as the person who named guinea pigs: “active users” doesn’t refer to users currently on your site — that’s the Real-Time report — and guinea pigs are neither pigs nor from Guinea.
The Active Users report shows you the number of users who visited in the last day (1-day active users), week (7-day active users), two weeks (14-day active users), and four weeks (28-day active users.)

What’s the value of this report, you ask?
If you have more one-day users than longer-term ones, you’re struggling with retention. People aren’t coming back to your site or app — you need to figure out why.
I’d also recommend looking at this report with various segments; for instance, perhaps you see that users in a certain age bracket have much better retention than the average.
Lifetime Value Report
First things first: do you need a refresher on Customer Lifetime Value (CLV) and how to calculate it? We’ve got you.
The Lifetime Value report gives you a sense of how valuable users are to your company. You can see lifetime value for, say, the users you generated from email marketing versus the ones you acquired from organic search. Armed with this information, you can decide which channel to invest more in.
A few notes: Lifetime Value is capped at 90 days. The Acquisition date range, however — which you can adjust — reflects all the users you acquired in that time frame.
Imagine you’re interested in looking at transactions per user for users you acquired in the week before Black Friday. You’d adjust the date range to that week specifically. Then you’d see the average transactions per user for that cohort over the following 90 days.
Because HubSpot is a SaaS company, not an ecommerce business, I look at goal completions per user, page views per user, and sessions per user by Acquisition Channel.
If my team has recently wrapped up a marketing campaign, I’ll look at the same metrics by Acquisition Campaign.
But if you are in ecommerce and want to see transaction and revenue data, you’ll need to have ecommerce tracking set up.
(By the way, here’s how to track revenue in HubSpot.)
Cohort Analysis
Some people have gone so far as to call Cohort Analysis “the single most powerful report in GA.”
So, how does it work? This report groups users by one characteristic — so far, “Acquisition Date” is the only “Cohort Type” you can use. By the way, Acquisition Date is the day a user first visited your website.
You have several options from there.
- First, pick your cohort size: day, week, or month.
- Next, pick your metric, or what you want to explore for this cohort. It can be further broken down into Per user, Retention, and Total.
- Per user means the total count of that metric divided by the cohort size. So if you choose Transactions per user, for example, you’ll see the average number of transactions per user for that cohort.
- Retention is simple: user retention, or the number of users who returned that day, week or month (determined by the cohort size you selected) divided by the total number of users in that cohort.
- Total: the total number of sessions, transactions, etc. that occurred for that cohort size.
- Choose your date range. GA lets you see up to three months of data.
Now let’s dive into reading the report, because it’s not obvious.
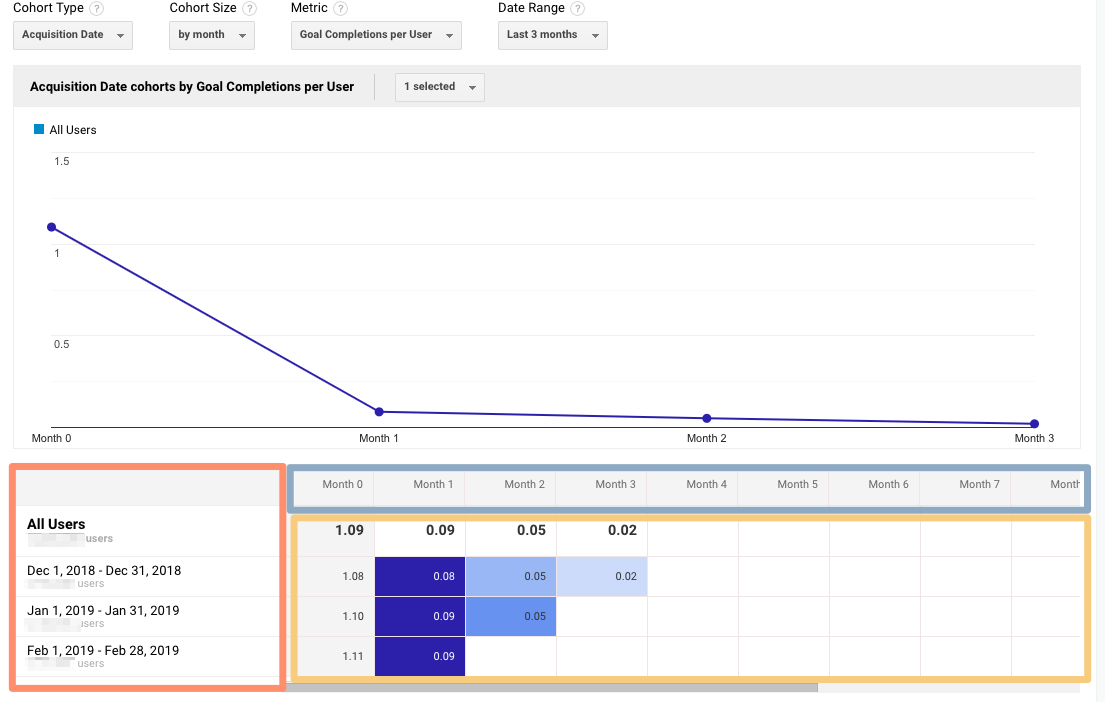
The left-hand column shows you the Cohort Type you picked — Acquisition date, by default — broken down by Cohort Size (day, week, or month).
The first row shows you the totals for all the users in that cohort. Each row underneath that represents the activity in that day, week, or month (in this example, we’re looking at month.)
The row outlined in light blue reflects the Cohort Size you’ve chosen. Remember that data only goes back three months at the max.
The row outlined in yellow shows you the values for the metric you chose (in this case, Goal Completions per User). In the eternal words of Calvin Harris: baby, this what you came for.
Look at the first row. This tells you the average goal completions for the entire cohort in the first month after they were acquired was 1.09. Average goal completions for the entire cohort in the second month after they acquired dropped to 0.09. By the last month, it’s 0.02.
Now look at the next three rows. It looks like average goal completions per user in the first month after they were acquired increased slightly from December to January and again from January to February.
This is pretty usual behavior. Let’s imagine that instead, this report tells us average goal completions per user for February 1-28, 2019 (the last row) was 4.07. Woah! That’s nearly four times as high as December and January.
We’d definitely want to investigate further. And to do so, all we have to do is right-click on the cohort we’re interested in.
Make sure you click on the column if you want the entire day, week, or month analyzed. Click on a cell if you want to analyze only the users who, for example, completed a goal three days after they were acquired on February 27, 2019.

When you right-click, this box will pop up:

Give this cohort a descriptive name. Change the views to “Any View” if you want to use this segment across your entire property (which I usually recommend), then click “Create.”
Voila — now you can compare this cohort to any other segment in any report you choose.
3. Google Analytics Acquisition Reports
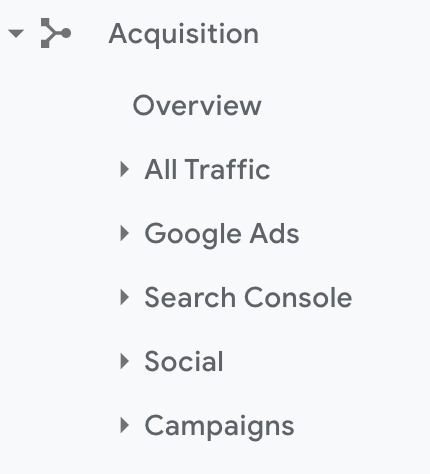
The Acquisition report breaks down your traffic by source: organic, direct, referral, email, social, paid search, display, affiliate, and (Other). (GA uses the (Other) category when it doesn’t know how to categorize a subset of traffic.)
From All Traffic, you can click into Channels.
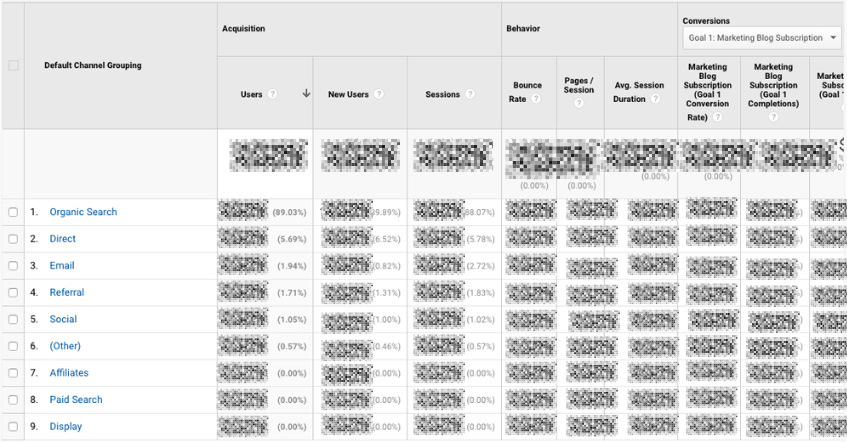
Click on any category to explore each source in detail.
Depending on the category, you’ll see landing pages (which URLs your visitors entered the site on), source (which website brought them to yours), or keyword (which query took them to your site.)

To see this information presented visually, click on All Traffic > Treemaps. This post walks you through how to read and adjust the Treemaps report.
The next report, Source/Medium, breaks down the general category of traffic (which you saw in “Channels”) into the search engine or domain.
It’s useful if you want to get more granular insight into the ways people are coming to your site. For example, you might notice that a whopping 70% of your referral traffic is coming from LinkedIn, while just 5% is coming from Pinterest. Depending on your marketing team’s priorities it may be time to shift focus.
The last report, Referrals, reveals the specific URLs that sent people to your site, e.g. your referral traffic.
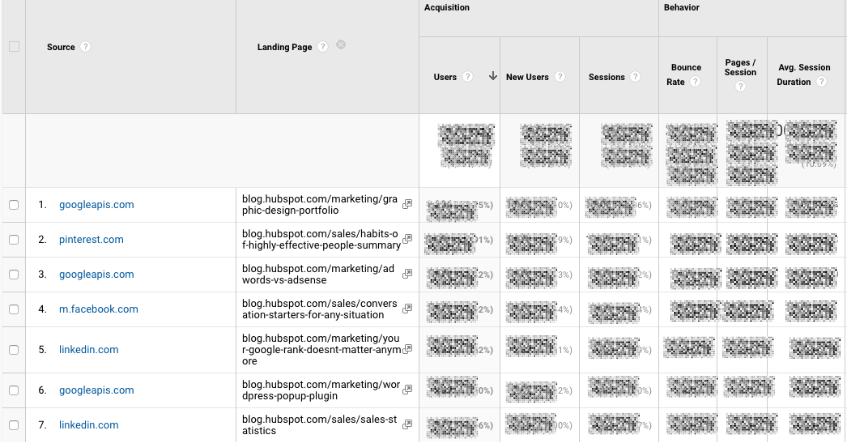
I like to add “Landing page” as a secondary dimension so you can see which pages on your site are receiving the referral traffic.
4. Google Analytics Behavior Reports
Out of all the reports in GA, I use the Behavior ones the most.
Site Content
This report gives you a review all of the blog posts, landing pages, web pages on your site.
All Pages
Let’s start with Site Content > All Pages. This shows the top-trafficked pages for your current view and/or segment. It’s useful in and of itself — you should always keep a careful eye on your most viewed URLs — but I especially like it when I’m analyzing traffic growth or declines.
To give you an idea, maybe total traffic to my website has dropped 10% month over month. I’d navigate to Site Content > All Pages and change the date range to this month compared to the last month (making sure the days of the week match up).

Then I can see the differences in page views by URL:
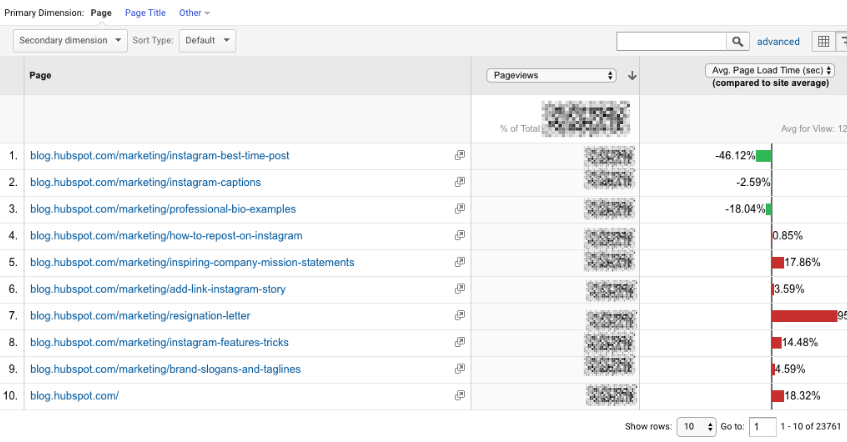
This helps me identify which pages received less traffic and contributed to that decline.
Helpful tip: I like to change the “Sort Type” from “Default” to “Absolute Change” so I see the results sorted by the greatest differences in percentage rather than total views.

I also add Page Title as a secondary dimension so I can see the name of each page alongside its URL.
Content Drilldown
This report breaks down the structure of your site by subdomain and then subfolder. To give you an idea, for HubSpot we can see data for each of our subdomains, including:
- blog.hubspot.com
- developers.hubspot.com
- community.hubspot.com
And so on. If I clicked into blog.hubspot.com, I could then see aggregated data for:
- blog.hubspot.com/sales
- blog.hubspot.com/marketing
- blog.hubspot.com/service
You get the drift. This report is probably most valuable for those managing highly complex properties.
Landing Pages
Landing pages is another one of my favorite reports. GA defines a landing page as the first page in a session — in other words, the visitor’s first interaction with your website.
There are a few ways to slice and dice this report.
First, if you’re interested in the sources (organic, paid social, direct, etc.) driving users to the landing page, you can add Source/Medium as a secondary dimension.
This is basically the opposite version of the report we added earlier.
Second, if you only want to see which landing pages users visited from a specific source, on a specific platform, or within a specific category, you can add the appropriate system segment:

Maybe you’re most interested in the landing pages that mobile and tablet users see — so you choose the Mobile and Tablet Traffic.
Or perhaps you’re curious about users who ended up buying something, so you choose the “Made a Purchase” segment. There are lots of possibilities here.
Exit Pages
This report shows the last pages users visited in their sessions before they left your site.
That’s a little confusing, so let’s use an example.
I want to find a place to grab dinner with my friends so I search, “Mediterranean restaurants near me.” A place that looks good pops up, so I click on it. First, I check out the menu. They have a hummus sampler — yum. Then I click on their press page. It links to a recent article on Eater, so I leave the site to read it. The reviewer loved the food. I’m sold.
The Press page would be my exit page.
You may hear that you should analyze your exit pages to understand why users are leaving your site — I think this example reveals why that strategy doesn’t always make sense. Just because someone has left doesn’t mean anything is wrong with the content.
Check this report out but take the data with a grain of salt.
Site Speed
This report is pretty self-explanatory: it tells you how quickly your site is loading for users. Obviously, the faster the better — not only do faster pages correlate with higher revenue, but Google’s algorithm takes page load time into account.
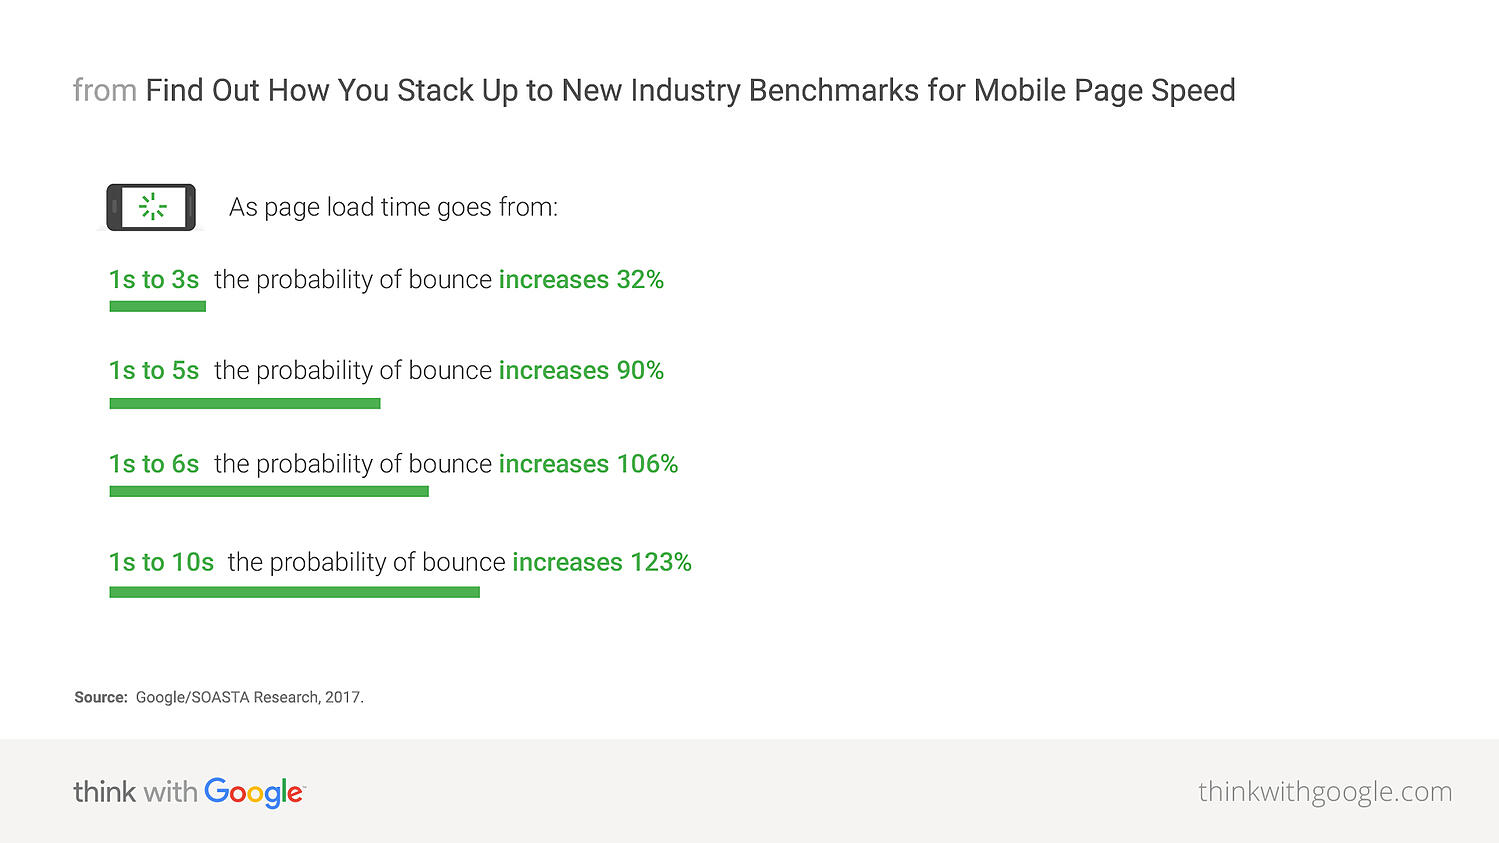
Site Speed Page Timings
This report delves into the average page load times for each URL. I use it to identify the slowest-loading pages on HubSpot’s site with the ultimate goal of figuring out why they’re taking their sweet, sweet time and how to speed them up.
The default metrics are page views and average page load time, but I also recommend looking at:
- Avg. page load time and bounce rate
- Change the Sort Type to “Weighted” so you see the blog posts with the highest page views first
- Avg. page load time and page value
- The latter gives you a sense of how much a specific page contributes to your total revenue
- Looking at these two together helps you find slow-loading pages that are valuable to your bottom line (even if they don’t get a ton of traffic), making them a high priority to fix
Site Search
First things first: if users can search your website, make sure you’ve set up Site Search in GA. You must enable it for every view separately (here are the step-by-step instructions).
Usage
I typically start with the “Usage” report, which tells me how many sessions occurred with and without one-plus searches. In other words, I learn how frequently people used site search for the view and time period I specified.
Search Terms
Here’s where you learn what people are searching for. Look for themes: if you see the same search terms coming up multiple times, there are a few conclusions you could draw.
Either you need to create new content that gives users the information they’re looking for, and/or you need to better surface existing content so it’s easier to find.
Pay attention to the “% Search Exits” column, as this tells you how many users clicked away from the search results page rather than choosing a result. You can usually infer there wasn’t a good answer for their question (or it wasn’t appropriately titled.)

Search Pages
This report displays which pages users are starting searches from. It’s important to think about this contextually. Maybe people are commonly beginning searches from your 404 page — that makes sense and isn’t anything to be alarmed about.
If, on the other hand, they’re starting searches from a product landing page, something’s wrong. The content clearly isn’t living up to the expectations they had when they clicked the ad link.
Loves Data provides a solid overview of GA’s Site Search reports if you want to explore them even further.
Events
A user clicks a button. Then they download a file. Next they watch a video.
No, this isn’t the world’s most boring bedtime story — it’s an example of a GA event. Three events, to be specific.
GA defines events as, “user interactions with content that can be measured independently from a web page or a screen load.”
Those user interactions are up to you; you’ll need to add special code to your site or app that tracks the specific actions you’re interested in. Here are the instructions.
If you’re not excited about events tracking already, I want you to get excited. There are infinite possibilities here: if you have an event set up for watching a product demo, and another for clicking a link to an external review of your tool, you can measure how many times each event happened.
Maybe you discover your video isn’t getting many plays. It’s probably time to optimize the current video, make it easier to find on your site, or create a new one. Or perhaps you see that way more users than you expected are checking out the third-party review of your product.
That tells you users want more social proof and testimonials. Since the review is favorable, you might want to put it front and center on your site.
Top Events
This report tracks the events taking place most frequently — pretty straightforward. You’ll see total events (e.g. how many times that event happened) and unique events (how many sessions included one or more occurrences of that event).
If you’ve set values for your events, this report also shows you how the total value of each event and its average value (or the total value divided by the frequency.)
Pages
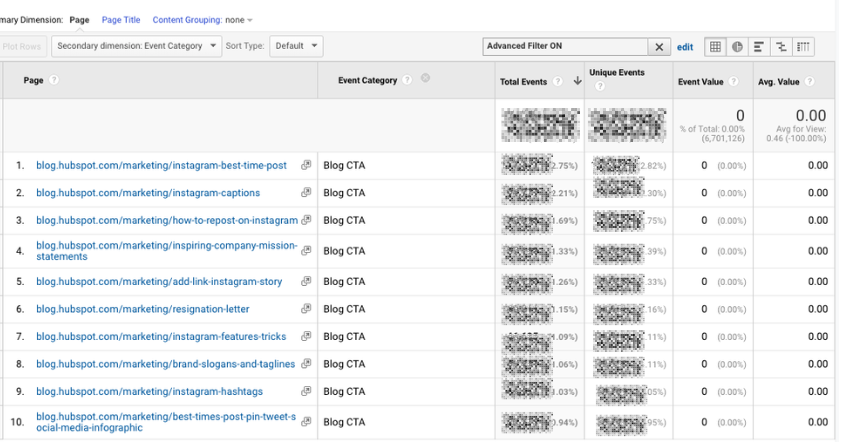
In this report, you can see which pages generate the most actions. I typically add “Event Category” as the secondary dimension, then filter for the event I’m most interested in.
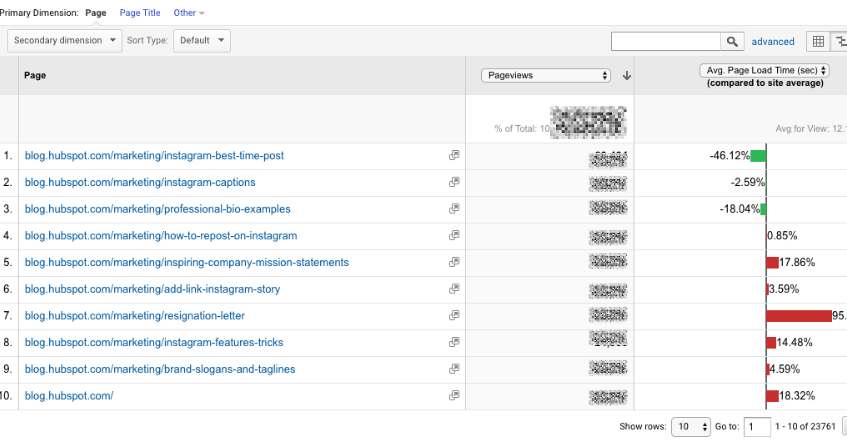
To give you an idea, my team tracks “Blog CTA.” This event fires whenever a user clicks a CTA embedded in a blog post. To get to the report below, I added “Event Category” as the second dimension, then filtered for “Page begins with blog.hubspot.com” (so I’d only see URLs on the blog) and “Event Category equals Blog CTA.”
Now I can see which posts generate the most CTA clicks. Hopefully, you’re starting to see the power of event tracking!
Events Flow
The Events Flow report tracks the order in which events take place on your site. It can tell you:
A. Whether particular events tend to happen first — and if they trigger other events
To give you an idea, maybe users frequently watch your demo video, then click the CTA to schedule a call with a salesperson.
B. Whether certain event categories are more common than others
Imagine you see that videos are played far more often than PDFs are downloaded.
C. Whether users act differently based on segment
For example, perhaps people coming in via organic scroll to the bottom of your pricing page far more than people coming in via social media.
Note:This report is very subject to sampling. (Read more about GA’s data sampling practices here.) Sampled data is usually pretty accurate, but it means the more important the conclusion you’re drawing, the less uncertainty you’ll be able to tolerate.
To reduce the level of sampling, make the date range smaller.
Publisher
If you monetize your website with Google AdSense or Ad Exchange, you can use the Ad Manager and Google Analytics integration to bring information on how your ad units are performing into GA.
I won’t go into any more detail here, but I recommend reading the following resources if you want to know more:
5. Google Analytics Conversion Reports

If you have a website, you have an objective — probably several — for the people who visit your site.
Ecommerce store owners want their visitors to subscribe to their mailing list, make a user account, add something to their cart, and/or complete the order confirmation process.
Media companies want their visitors to stay on their site for as long as possible and/or view a certain number of pages (all the better to maximize their ad revenue.)
B2B businesses want their visitors to download an ebook, sign up for a webinar, or book a call with a sales rep.
Google Analytics makes it possible to measure all of these things — plus many more.
A goal is essentially a conversion that you’ve defined (which is why this info shows up under the Conversion section.)
There are four main types of goals:
- Destination: This goal is completed when a user reaches a specific page, like a product page, order confirmation page, or thank you page
- Event: This goal is completed when a predefined event fires (like the Events you can set up as, well, Events — think watching a video or sharing something to social media)
- Duration: This goal is completed when a user’s session lasts longer than a pre-set time
- Pages/screens per session: This goal is completed when a user views a specific number of pages (or screens for an app) per session
Once you’ve identified your goals, take a look at these instructions for creating, editing, and sharing them. This guide on choosing goal values is also quite helpful.
Overview
Head here to learn how you’re doing goal-wise across the board. I get the most from this report when I compare date ranges and/or look at goal completions by segment.
For example, quickly looking at goal completions by device reveals mobile visitors sign up for the blog newsletter much less frequently than desktop and tablet visitors. That could be because it’s hard to sign up for the newsletter on a phone — or it could be mobile users are looking for one thing and ending their session as soon as they’ve found it. I should dig in more to decide which case it is.
Goal URLs
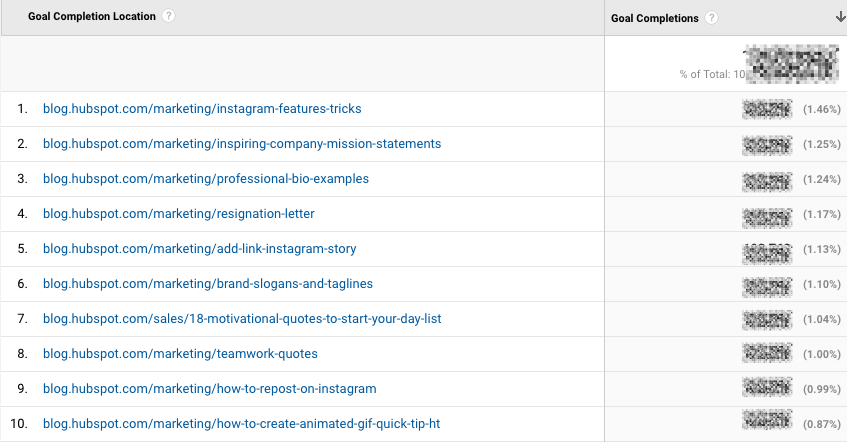
Knowing a goal was completed isn’t helpful in and of itself; you also need to know where it happened. Suppose you’ve embedded the same form in three separate pages on your site.
It’s great that Daenerys Stark from Dragonstone, Blackwater Bay just filled out your form to get in touch with a consultant, but which page did she fill it out on?
The Goal URLs report shows you. It breaks down conversions by “Goal Completion URL” (read: where it went down.)
Reverse Goal Path
Reverse Goal Path is the unsung hero of the Conversion section. Well, I’m singing its praises now. This report allows you to see the last three pages a user visited before completing the goal.
It’s useful for goals that aren’t sequential. Maybe you have a contact form that appears in multiple places on your site, or there are two different paths that lead users into buying your ebook. Thanks to this report, you can understand the various ways people arrive at the end destination — and there’s no need to set up a funnel.
I usually filter down to a specific goal completion location or goal previous step 1, 2, or 3.
For example, since I’m interested in seeing which blog posts generated leads from content downloads, I added “Goal Previous Step – 1 containing blog.hubspot.com” to the filter.

Here’s what I got:
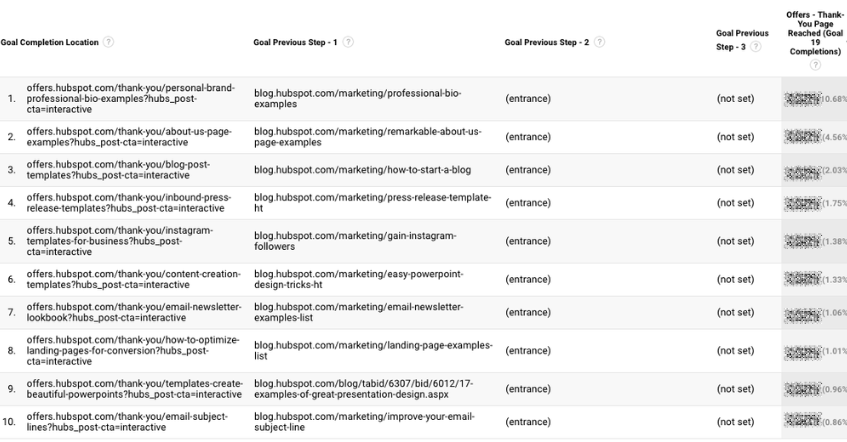
“(Entrance)” means the user came to the site on that step; “(not set)” means the user didn’t complete any steps prior to that one — because they weren’t on the website yet.
For a comprehensive exploration of Reverse Goal Path, take a look at OnlineMetrics’s guide.
Funnel Visualization
For sequential goals, Funnel Visualization is your go-to report.
Going back to the ecommerce example, the last goal would be “Arrived at the order confirmation page.” The goal before that, or goal #3, would be “Clicked checkout.” The goal before that, goal #2, would be “Added something to cart.” And the goal before that, goal #1, would be “Looked at product listing page.”
At each stage, you can see user drop-off. That lets you identify areas where you can improve conversion rates; for example, maybe you lose a lot of users during the checkout process. You change the flow so they can check out as a guest (versus needing to create an account), which dramatically reduces checkout abandonment.
To see this level of detail, you’ll need to map out your goals as a series. If all of your goals are simply the end objective, like “Arrived at the order confirmation page,” you won’t be able to reverse-engineer how users progress.
The Funnel Visualization report also requires you to mark the first step in the goal path as required or not. If you tell GA that yes, the first goal needs to be completed, Funnel Visualization will only show you the sessions where the user first finished goal #1. If a user skips goal #1 and goes straight to goal #2, their session won’t be represented here.
Goal Flow
If Funnel Visualization is the uptight relative who always made you take your elbows off the table and wash your hands before you ate, Goal Flow is the laid-back, fun relative who’d randomly take you out of school to go to the zoo.
All that to say: Goal Flow gives you a lot more freedom than Funnel Visualization. Unlike the latter, Goal Flow shows you all sessions that led to the completed end goal — regardless of whether the user completed the required goal #1 or not.
Another difference from Funnel Visualization: Goal Flow also shows you loopbacks — i.e. when a user goes back to a previous page or refreshes their current one.
If the user skips a step, Funnel Visualization “backfils” it. Goal Flow doesn’t.
If you edit an existing funnel or create a new one, Funnel Visualization will show you all your data from that moment onward. Goal Flow, on the other hand, can show you data from the past.
You can also toggle the Dimension and Level of detail of the report, as well as the segment, to get even more granular.
I recommend looking at various segments to see which convert at the highest and lowest rates — plus where they commonly drop out.
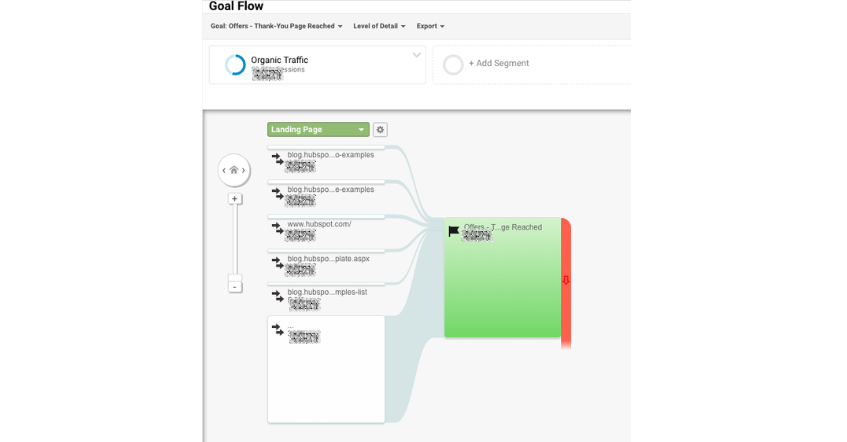
Note: This report is subject to sampling. (Read more about GA’s data sampling practices here.) Sampled data is usually pretty accurate, but it means the more important the conclusion you’re drawing, the less uncertainty you’ll be able to tolerate.
To reduce the level of sampling, make the date range smaller.
Smart Goals
This report is helpful if you’re A) using Google Ads and B) not measuring conversions. Basically, Google uses machine learning to identify your “best” sessions — or those likeliest to generate conversions — and then translates those themes into Smart Goals.
Once you have Smart Goals, you can use them in Google Ads to optimize your ads performance.
Smart Goals are controversial within the marketing community because the data is minimal and businesses will be far better served by setting up their own conversion tracking. Keep that in mind if you decide to use them.
GA4 Tools
Although many of the tools, reports, and features of GA4 are similar to those from Universal Analytics listed above, there are some key differences we’ll address in this section.
1. Home
The Home tab is a customizable dashboard of reports, stats, and other figures. You can adjust what you see in the Home tab so that you see a snapshot of the overall performance of your website.
In the example below, we can see users, new users, active engagement time, and total revenue because these metrics are most important for my site.

2. Reports

The Reports tab shows the Reports Snapshot first which includes the same information from the Home tab in this example.

You can also switch to other reports listed below:
- Reports Snapshot
- Realtime
- Life Cycle
- User
3. Explore

Explorations in Google Analytics let you look into the ways your visitors navigate your site to discover new pages and content. There are several preset explorations you can activate, or you can create a new one from scratch.
4. Advertising
When you click on the Advertising tab, you’ll start on the Advertising snapshot screen. Here, you’ll see the channels and touchpoints that drive the most conversions on your site. In order for this tab to be most helpful, you’ll need to set up goals and conversions in Google Analytics.

5. Configure

The Configure tab is where you’ll set up key pieces of your reports including events, conversions, audiences, and other custom definitions. As you get more familiar with your Google Analytics instance and the data you want to see, you can configure these settings to get a granular look into your data. This will allow you to solve problems, answer questions, and make decisions that are specific to your site and the outcomes you want to achieve from it.

Now You’re Ready to Track
Google Analytics is a highly valuable tool for any business as it gives you tangible data that you can apply to grow your business. Bookmark this guide and come back to it as your data tracking becomes more sophisticated.
Good luck on your Google Analytics journey.
Editor’s note: This post was originally published in August, 2017 and has been updated for comprehensiveness.


Web Forms: The Ultimate Guide
Are you one of the 266 million people who shopped online in the U.S. last year? If yes, there’s a good chance you’re familiar with web forms.
Not only do you use web forms to receive information, goods, and services from online stores, but they’re also crucial for the businesses that create them and embed them on their sites.

Marketers use web forms for a number of reasons — to complete an order, keep track of a customer’s personal information, or collect lead information.
And web forms can have a powerful impact on a business. 28% of marketers say the right form fields help improve lead scoring, which means more qualified leads. According to Venture Harbor, a well-designed multi-step form converted 53% of site visitors to leads.
Web forms also help businesses increase conversions by taking potential customers through the lead flow process. This happens when a person visits your site and submits their information in return for something (such as a product, service, or free trial). Once a lead submits their web form it’s sent to a server for processing.
Web forms vary in length, format, content type, and appearance — there’s no “one size fits all.” They should simply fit your business’s needs and help you gather the information you want from your leads.
This also means there’s no single way to create a web form. We will review several tools to create web forms later on, but first, let’s dive into why you should create web forms.
Why Should I Create Web Forms?
Web forms allow you to collect and manage information easily and efficiently. They’re embedded right into your website, which makes it easy for your leads to share their information. Once a lead completes a form on your website, their information is stored until it’s ready for analysis. Web forms are crucial tools for businesses to obtain the information they need from their potential customers.
Use Cases for Web Forms
There are several ways that you can use web forms, such as:
- Collect contact information
- Gather shipping information
- Survey your customers
They can help you get any information you need from your leads and keep it to analyze or manage in any way you see fit.
We will talk about the various types of web forms below, which will give you a better idea of specific use cases and which forms would fit best in certain instances.
Let’s discuss how to build a web form. As you follow the steps below, think about what information you really need from your leads.
If your web form doesn’t make sense to your leads — if it’s complicated or asks for too much information — potential leads may lose interest and leave your site. Consider how much the offer at the end of the form is worth and adjust your web form accordingly.
Creating a web form starts with determining its purpose.
1. Make the purpose of your form clear.
It’s crucial to make the purpose of your web form clear. Your leads should know exactly what your web form is for and why they are completing it. Here are a few ways to do this.
Include straightforward headers.
Straightforward headers let your leads know exactly how to complete your form. Headers help avoid confusion and ensure your leads spend the minimum required time on your form.
Examples of straightforward headers include:
- “Contact Us”
- “First Name”
- “Preferred Method of Contact”
Give clear instructions.
Clearly communicate what you need from your leads using the fewest words possible.
At the top of your form, include a sentence or two about what you’re going to ask from your leads. You can also include a short statement about why you need that information to remain transparent with your leads.
For example, always state the purpose of your form fields. They could say something like, “This web form will be used to get some more information about you so we can tailor our newsletter content towards your background, experiences, and interests.”
By ensuring your web form’s purpose is clear, you build credibility and trust between your business and lead.
Consider the appearance of your form.
By keeping your form organized, attractive, and clean, you’ll also give your leads an easy end-to-end experience.
Nobody wants to waste time reading long paragraphs of text to find what they’re looking for and cluttered text looks unprofessional.
With a well-designed form, your leads will know in seconds whether you took the time to thoughtfully create your form.
Why should you improve web form usability?
- You create a simple transaction.
- You will build trust.
- You will appear more professional.
- You will increase conversions.
Letting your visitors know exactly which form they need to complete and why you’re asking specific questions makes them more likely to engage. Whether it’s a shipping form, a sign-up form, a survey, or a quiz, you want your visitor’s experience to be easy.
When you visit another company’s website that’s designed in a way that screams “customer first,” you’re likely to feel that the business is professional and thoughtful. The same goes for web forms.
When you increase web form usability and create a positive user experience, your business will pull in more conversions. For example, according to HubSpot research, decreasing the number of form fields can increase conversion rates.
If you make your form easy to use, clear, and visually pleasing, your leads will want to complete it and become customers.
By improving your web form usability and prioritizing the design and context of your form, you’ll enhance user experience. This will get website visitors excited about completing your form and converting.
2. Choose your web form type.
The purpose of your web form informs what type you should use, as well as which questions to ask and how you should format your responses.
Here are some common types of web forms to consider. (We will review examples of each of these types of web forms shortly.)
Contact Form
Contact forms let your leads ask your business a question, voice a concern, or even explain their need for a refund. These web forms typically contain fields that require leads to list their name, contact information, and order number. They may also have a drop-down or text-entry field for leads to explain their reason for reaching out and their preferred method of contact.
Lead Generation Form
These web forms convert your website visitors into leads. They typically require personal information, such as a name, company, email address, phone number, and sometimes a username and password for return visits to the site.
Order Form
Order forms do exactly what you’d expect them to do — they allow your website visitors to place orders. They also give customers a way to pay for items and have the products they have ordered sent directly. Order forms may include multiple steps as they often require a credit card, shipping and billing information, and your contact information.
Registration Form
A lead will complete a registration web form if they want to sign up for your service. This is common on sites such as Craigslist, Ebates, and eBay. If a lead was looking to list an item on one of these sites, they would complete a registration form to create an account and then post the item.
Survey Form
Survey web forms may include multiple-choice, fill-in-the-blank, and long-form responses. They help you learn more about your customer’s experiences with your products and services. They also help you improve future interactions with your customers, as well as educate leads about the ways in which your business can help them.
3. Add your form fields.
Think about what responses you need from your leads when you begin creating your form fields.
Start with the answers you’ll need. Then you’ll be able to decide how to title your form fields, what questions to ask, and which types of fields you actually need your visitors to complete.
Regardless of what you’re asking your visitors, you should always require their basic contact information (like name and email address) so you can identify individual submissions.
Next, choose the right software to create your web form.
In HubSpot, drag-and-drop features make it easy to build your form however you want. Form fields are predefined. This means you have several options to pick from and add to your form.
Once you choose your web form template, review the predefined form fields and begin creating your form.
If you are asking your leads questions that need detailed answers, you can create short or long-text entry fields that accept one sentence up to a paragraph or two.
There are also several other field-entry types for you to include in your forms including:
- Multiple choice
- Drop-down menus
- Checkboxes
- Radio buttons
4. Embed your web form on your website.
Once you create your web form, it’s time to publish your form and embed it on your website. This is how your website visitors will access your form. Start by determining where you want your form located on your website.
Decide where to embed your form.
Determine which page of your website should include the web form. Some common questions to ask include:
- Do you want your email sign-up located at the bottom of your main landing page?
- If you have a contact form, is there a page on your website solely meant for visitors who want to contact you?
- And if someone purchases an item, do you have your web forms in an order that makes sense (first shipping, then billing and payment)?
How to Embed Your Form
To embed your form, copy and paste the form’s code into the desired location on your site.
Once you embed and publish your web forms, website visitors can start completing and submitting forms. Next, you’ll begin receiving data about your leads that will be crucial for maintaining a healthy business.
If you are using a website creator or external website, you can still embed your code from HubSpot’s form builder into your site’s source code (the collection of code used to build your website).
5. Make your web form secure.
Data protection has become a top priority for businesses and consumers alike. A secure web form makes sure that you’re protecting your leads’ data. This will result in more submissions. With HubSpot’s form builder, creating a secure form for both your business and your leads is easy.
The form builder stops spam submissions from coming through with an email address validation process. This ensures only real email addresses can be submitted in your web forms.
HubSpot also allows people to add CAPTCHAs, which are the questions at the end of a form that require people to confirm they’re not a robot. These act as a second layer of protection against spam.
Lastly, HubSpot allows you to block specific email providers and domains that you determine are unnecessary to receive submissions from.
6. Test your web form and analyze your results.
Once you create your web form and embed it on your website, run some analytics and make sure it works. Think about things from your visitor’s point of view. Do they have enough space to respond to a question in the short-text entry field? If not, try switching over to the long-text entry field and see how their responses change.
If you receive the same feedback repeatedly from your website visitors, try altering the form or adding different form fields to improve the experience for your leads.
Your customers and leads should be your top priority when it comes to all of your marketing tactics, including your web forms.
If you set up email notifications on your web form creator software, you should double-check that these are working as well.
You can do this by going to the web form on your website, completing it as a lead would, and making sure you receive an email notification about the completed form. If it doesn’t work, try working through the email notification set-up again.
Congrats! You have just completed the creation of your web form. Now, let’s review some design tips that will enhance the user experience of your web form.
Web Form Design Tips
When creating and reviewing your web form, consider some of the following design tips. These will make your form easy to use, effective, and helpful for both your business and your leads.
Be direct.
By keeping your web form as direct as possible, you make the experience better for your leads. You will also avoid any possible confusion. To be more direct, you can create a web form header, use clear form field titles, place your web form in a location on your website that makes sense, and remove non-essential wording.
Use correct form fields.
Use form fields that make sense to your leads and give you the answers you’re looking for. If your leads need to give you that information in paragraph format, then include long-text entry fields. If they only need to write a few words or a sentence, include short-entry fields. For something like a survey, add multiple choice responses, and for any questions that could have several answers, use checkboxes or radio buttons.
Use input constraints.
Consider using input constraints for specific form fields. For example, if you know you only need one sentence in your short-entry form field, add a constraint that ensures your lead can only type in one sentence. This will save time for your lead and the form reviewer.
Add a form submit button.

By adding a form “Submit” button, your website visitors will be able to complete the web form and send it to the server without any hesitation or confusion. It will also make them feel confident that you and your fellow employees will receive their submissions and listen to whatever it is they have to say.
Organize your form.
If you have a long and detailed web form, make it easy to read and complete for your leads by keeping everything in one column. The only time you’ll want to keep form fields on the same line is when it makes sense to the reader.
For example, keep information like the date (day, month, and year) on one line. By keeping all other form fields in a single column, you’ll avoid your lead feeling overwhelmed or bombarded by questions.
Make your form visually appealing.
Did you know that it takes an average of 50 milliseconds for a website visitor to look at your website’s landing page and decide if they want to stay?
Web form first impressions matter, too. Keep these design tips in mind as you create your web forms:
- Brand your forms to make them look professional
- Match your company’s aesthetic to ensure consistency and promote a polished look
- Consider colors, text font and size, and layout
- Keep things clean and organized
Use smart fields.
Imagine you already have an account on a website and you are completing a different web form on that same site. If that form field asks you some of the same questions that a previous web form asked, wouldn’t you feel as though you are wasting your time?
Smart fields are a great feature to keep your leads from having to do any unnecessary work. HubSpot uses smart fields to remove form fields that a customer or lead has previously submitted. Smart fields make your business and website appear more professional by providing a smooth process for your leads or customers. They also remove the frustration of filling out the same information multiple times.
Use smart defaults.
Have you ever started completing a web form that automatically filled in your zip code based on your current location? That’s a smart default. This feature also speeds up the web form completion process and creates a seamless user experience.
Include error messages.
When a lead is completing your web form, you should tell them whether or not they are doing it correctly. Include error messages if they accidentally enter an area code that doesn’t exist, add their state to the “Town” field, or are exceeding the character limit.
Again, this not only saves time for your leads but also keeps things simple when you need to review the submitted content.
Use these tips to create error messages that make sense to your customers.
Explain why you are asking for specific content.
Imagine you were completing a web form on another business’s website and you notice a question that asks for your credit card information when you aren’t buying anything. You might find yourself thinking, “Well, this is sketchy.” or “Am I going to be charged for something without even knowing it?”
This is an easy way to lose a lead or compromise your credibility.
To avoid this, include information on your web form that explains why you’re asking for specific information. By anticipating questions your leads may have, you will come off as professional, thoughtful, and customer-oriented.
Web Form Examples
Examples are a great way to get inspired and improve your own marketing practices. Here are some examples that show each of the five web form categories mentioned above.
Contact Web Forms
Sun Bum
Sun Bum has a contact form on its website that enhances user experience. The form is on a contact landing page. They even have a unique name for their contact form, “Ask The Bum,” that meshes with their brand and resonates with users.
Why we like web forms like this one: It looks clean and organized, and the form fields make sense for the form’s purpose. Users are able to select the reason why they are contacting Sun Bum and how they want to be contacted. Then they can enter their contact information, select a topic, and write the company a message. The tone of the copy on the form also reminds users that they are talking to a company that has a personality.
Preserve
The contact experience at Preserve starts with an easy-to-scan page that helps users figure out what topic their question falls under so that their question goes to the right person. The simple icons and clear direct copy help users understand the size and focus of the company.
After you click on a topic, their web form pops up. It’s also quick to scan and complete, whether you have a quick request or need to ask a more complicated question.
Why we like this web form: The use of multiple web forms allows customers to take things one step at a time. The two-step process also shows users that giving customers the right answer quickly is important. This web form also sets clear expectations by highlighting the main topics for questions and copy that talks about the availability of their small team.
Lead Generation Web Forms
Help Scout
Help Scout has a lead generation form on their site that allows leads to quickly create an account. The web form header states what the form is for and only requires a few pieces of personal information (company, name, password, and work email) to create an account.
Why we like this web form: This Help Scout web form has a nice layout for users and keeps all fields contained in a box. The layout of the form fields makes sense as well — the fields for a lead’s first and last name are side-by-side and the rest is in a column format, which helps visitors work through the form step-by-step.
Cambio & Co.
This lead generation form stands out with an engaging headline, a striking image, and a quick outline of two offers. The first offer reinforces their brand story and gives users a chance to connect and the second is an enticing discount.
Why we like web forms like this one: This popup web form packs a lot of value into a single form. The copy is succinct but useful, and it only requires a single form field, email address, to get started.
Order Forms
Seventh Generation
There are a lot of different places where customers can buy Seventh Generation products. So, for example, when you search for a product like glass cleaner online, you might be looking for a local store where you can buy that cleaner or you might want to buy it and have it shipped. This web form anticipates multiple user needs and puts them all in one simple form.
Why we like this web form: This form is clear and easy to understand. It gives you a chance to choose different sizes and versions of their product and offers a range of locations both in-person and online to make a purchase.
Starbucks
Starbucks has an online order web form that customers complete when they want to send a gift card. The first step is a selection of bright images that represent the wide range of gift cards that Starbucks offers. After clicking on a gift card, customers fill in the blank short-text entry form fields for gift card amount, recipient, sender, and an optional message.
Once that information is submitted, users can sign in to their online account or complete the form as a guest. Then they’ll add or update their billing information.
Why we like web forms like this one: This process is clear and makes what could be a complicated process feel quick and easy. The web form design and form fields are straightforward. They have clear headings and state why Starbucks needs certain information like the customer’s email and the recipient’s email.
Registration Forms
Airbnb
When someone wants to list their home on Airbnb, they first need to register for an account. Airbnb has simple registration web forms that get hosts excited about listing their space on the site — allowing potential hosts to discover how much money they could make through their listing. Who wouldn’t want to make an extra $4,000+ per month?
Why we like this web form: Airbnb takes its potential hosts through several web forms and allows them to work through the process at their own pace. The web forms are also visually pleasing and match the company’s look and style. The continue and submit buttons are also in a bold color that stands out on the page whether the form is on a desktop or mobile device.
Fill More Waste Less
It’s easy to register for updates from a company you love. But it’s even better when you know the value you’ll get when you sign up. Fill More Waste Less reduces waste by offering refillable items like detergent, hairspray, and shampoo for eco-conscious customers. This web form gives those customers a chance to suggest new products for refills.
Why we like web forms like this one: It’s tough to write a call-to-action that clearly communicates an offer, while also motivating signups. This form has just two fields and is quick to scan. This makes new site visitors who don’t find what they’re looking for more likely to submit their requests.
Survey Web Forms
WebMD
WebMD has a symptom survey that allows website visitors to self-diagnose through a series of questions. The survey includes several web forms with various form fields. The final web form submission takes patients to a landing page that includes a possible diagnosis.
Why we like web forms like this one: These web forms are an efficient and effective way for patients to get the answers they are looking for. The form uses both visual aids and checklists to streamline the process of connecting symptoms to possible conditions and treatments.
Avocado Green Mattress
The process of choosing a mattress has a lot of variables. This can make it difficult to narrow down choices. This form uses lighthearted and thoughtful copy to steer shoppers toward the right mattress.
Why we like this web form: The design and text are well-designed and quick to scan. At the same time, the questions and responses go into enough detail to make this quiz worth filling out. This web form survey also gives this company a chance to highlight its unique selling points.
If you’re looking for more inspiration, check out these web form and feedback form examples.
We’ve reviewed how you can create your own web forms and examples you can learn from. Now let’s review some tools and programs that can help you build the web forms you need.
Web Form Tools and Software Programs
There are many online form creators and software programs that businesses can use to get information from their leads. Some form builders are free, some need a subscription fee, and some have features that work for different types of forms and businesses.
HubSpot
HubSpot’s form builder has easy to use drag-and-drop features that allow you to efficiently create, embed, and publish your ideal form. One feature that is unique to HubSpot’s form builder is that it uses progressive profiling.
Progressive fields prevent anyone from having to complete the same form fields multiple times. This helps you make sure your business isn’t getting duplicate responses. It keeps things as simple and professional as possible for both the lead and the business using the form builder.
JotForm
JotForm is an easy-to-use web form software. It’s a free online form builder that allows businesses to not only create and embed their web forms but also receive notifications through email whenever they complete a form. With JotForm, anyone can create their desired, customized web forms in a matter of minutes.
Formstack
Formstack allows businesses to build their web forms, track them, and use conversion tools to analyze data received through the forms. Companies are able to brand their forms and integrate them with other apps they may be using to control their workflows (such as MailChimp, Google Sheets, PayPal, or Hubspot).
WPForms
WPForms is the WordPress contact form plugin. This plugin has a drag-and-drop feature that easily moves your contact form from the plugin to your website, making it one of the most straightforward contact form builders available.
With multiple contact form templates to choose from, businesses can create a form that works for their needs. The plugin also notifies you when a lead completes your form, has a mobile-friendly design, and integrates with many other apps.
Drupal
Drupal is an open-source CMS (content management system) that has a web form creator module called Webform. The module allows Drupal users to create surveys and forms and manage the results on a spreadsheet application. The module also has basic statistical review features so businesses can keep track of what is working and what they need to modify.
Typeform
Typeform allows businesses to create forms, surveys, quizzes, and more for their websites. The software also has a sophisticated way of keeping track of data and results from all forms across a given site. These web forms are not only easy to create but they can be quickly embedded and are compatible with all devices.
Create Your Own Web Form
You can also create your own web forms using HTML, CSS, Php, or Javascript.
Create Great Web Forms
Web forms will help you track online leads, follow up with clients and potential customers, and learn more about your buyer personas. They enhance user experience and offer your leads the information, services, and products they’re searching for.
So, why not get started creating web forms that’ll help you grow your business and expand your network today?
Editor’s note: This post was originally published in October 2018 and has been updated for comprehensiveness.


33 Emerging Technology Stats to Know in 2022
Many major emerging technologies in artificial and virtual reality are becoming more accessible, but are they worth investing in?
In this post, I’ve gathered TK stats related to emerging technologies and the impacts and potential impacts they can have on marketing and marketers in the near future.

Augmented and Virtual Reality
For years, researchers have said that virtual reality, which gives viewers an immersive and interactive 360-degree virtual experience, will hold the best opportunities for gaming, entertainment, and academic industries.
Experts have also thought that augmented reality, a partially immersive but still interactive experience, will thrive in the world of branding and marketing.
We have already seen some of these predictions come true, but both still have significant potential. Here are 16 stats that demonstrate the growth and opportunities of AR and VR.
- Consumer and enterprise virtual reality market revenue is expected to reach $6.71 billion by the end of 2022 and $12.9 billion by 2024. (Statista)
- Augmented reality, virtual reality, and mixed reality market size worldwide is expected to jump by more than 220 billion USD between 2021 and 2028. (Statista)
- 101.6 million people in the US will use AR in 2022. (eMarketer)
- 39% of media planners who use NFTs say they have the best ROI of any channel in their media mix. (HubSpot Blog)
- In a recent study, 33% of survey respondents understand the concept of the metaverse, 37% have heard of it but aren’t sure what it means, and 30% aren’t sure at all. (GlobalWebIndex)
- Over half of consumers are interested in participating in the metaverse, and 1 in 3 who haven’t heard of it still say they want to be involved.(GlobalWebIndex)
- It’s estimated that, by the end of 2022, virtual reality hardware and software sales will generate more than 6.4 billion USD in revenue. (Statista)
- 54% of people visit the metaverse to play games, 46% visit to virtually hang out with online friends, and 43% visit to virtually hang out with in-person friends. (HubSpot Blog)
- 36% of consumers interested in participating in the metaverse worry about how companies will use their personal data online. (GlobalWebIndex)
- Over the next five years, Gartner predicts that one in four people will spend at least one hour per day in the metaverse. (Gartner)
- Over the next five years, 30% of businesses will have some sort of product or service available in the metaverse. (Gartner)
- Over 1 in 5 people aged 24-54 are invested in crypto. (HubSpot Blog)
- People ages 18-24 are likely to buy NFTs to join a community. (HubSpot Blog)
- Deloitte’s 2021 Global Blockchain Survey found that 80% of participants say their industries will see new revenue streams from blockchain, digital assets, and/or cryptocurrency solutions. (Deloitte)
- Over 250 million Snapchatters use an AR feature on the app every single day. (Modern Retail)
- Creators on Snapchat have built over 2.5 million AR Lenses. (Modern Retail)
Artificial Intelligence
Artificial intelligence is so prevalent in 2022 that many of us don’t even notice all the ways we interact with iton a given day. If you’re less familiar with AI, here are eight stats to keep in mind:
- Gartner forecasts that the worldwide artificial intelligence software market will reach $62 billion by the end of 2022. (Gartner)
- The business value of AI will reach $5.1 billion by 2025. (Gartner)
- 52% of marketers prioritize implementing marketing automation platforms to enhance their marketing efforts. (Demand Gen Report)
- 17% of marketers currently use automation or artificial intelligence as part of their marketing strategy. (HubSpot Blog)
- 1 in 5 consumers uses live chat or in-app chat daily. (Vonage)
- 71% of consumers say they would be happy to use a chatbot if it meant an improved customer experience. (Conversocial)
- A Drift survey reported that 54.8% of B2B professionals across various industries say they receive a greater volume of high-quality leads with chatbot tools. (Drift)
- 61% of people globally believe that automation could put people’s jobs at risk. (PWC)
Voice Assistants and Smart Speakers
While voice assistants are technically a segment of AI, they’ve become so prominent in the emerging media world that they deserve their own section of stats.
- Statista predicts that the number of digital voice assistants will reach 8.4 billion units by 2024, which is higher than the world’s total population. (Statista)
- The total number of Amazon Echo users is more than double that of Google Home. (eMarketer)
- 123.5 million adults in the US will use voice assistants at least once per month. (eMarketer)
- Almost all voice assistant users use the technology on a smartphone. (eMarketer)
- By 2023, digital voice ecommerce is expected to triple to an $80 billion industry. (Juniper Research)
Smart Devices and Appliances
Smart appliances and devices have significant potential to impact marketing. Although the space is still young, it’s providing interesting opportunities to bigger brands.
As you can imagine, devices like smart TVs could provide great potential for content marketing and branded media. However, a more unique example of an appliance that could provide brand potential is a smart refrigerator.
“I’m excited to see how a smart fridge that can tell me when my avocados are about to spoil can be leveraged by a brand to give me information that might serve me in that particular information, says Amanda Zantal-Wiener, a senior content strategist who creates content for HubSpot that covers news and trends.
But, Zantal-Weiner’s excitement doesn’t end at smart-home appliances — she’s also fascinated by the world of smart cars.
“Until we start to see self-driving cars on the road, the idea of connected cars can also be used to help me do more than mindlessly scroll through my phone when I’m using a ride-hailing service, by serving as a distribution channel for real-time, relevant information during that trip. Everything is connected, and I’m excited to see which brands are able to adapt to that earlier on in a way that actually helps customers,” Zantal-Wiener explains.
Here are four key stats that highlight why you should keep these technologies on your radar.
- Smart home appliance user growth will more than double between 2020 and 2025, from 30.6 million to 64 million. (eMarketer)
- Smart TVs are the most popular smart home devices. (Statista)
- The average cost of a smart-home device is expected to drop by 52% by 2023 (Juniper Research)
- The percentage of US internet users using a smart appliance will increase to 21% by 2025. (eMarketer)
Navigating the Future of Marketing
Yes, creating voice assistant skills, leveraging AI, and building branded AR/VR experiences might be pretty inaccessible and costly to your company right now.
But, if you want to continue to innovate your brand or be a competitive marketer in the far future, you’ll want to keep up with how technology and marketing possibilities are evolving — you’ll be more prepared to adopt new technologies when they are accessible in the future.


The Best Story Framework for More Engaging Storytelling [Example]
Even if you’re not a professional storyteller, you can use storytelling frameworks to share more engaging narratives in your content marketing copy. You’ll not only be able to tell your company’s story more effectively to stakeholders, but you’ll be able to write more effective, readable material that converts users into loyal customers.
Whether you’re writing for your website, blog, social media profiles, presentations, or online offers, the framework discussed below will help you gain confidence in storytelling and start telling better stories in business and in life. Let’s get started.

Why use a storytelling framework?
As content strategists, we should spend a lot of time thinking about the importance of storytelling in marketing, but we don’t — mainly because it’s so intimidating. The pressure-filled process of creating a framework and telling a story can keep a lot of people from even making an attempt. When the subject comes up, we understandably get nervous.
The thing is: storytelling is part of what makes us human. We don’t have to be Ernest Hemingway to be good at it. We can use a storytelling framework to guide us in the writing process.
Storytelling frameworks make our copy and content feel familiar to readers, while providing us with an easy “formula” to follow. The good news is that your content will never feel formulaic, because you can (and should) diversify how you write individual pages or posts. However, the bare bones stay the same.
Storytelling Template: The Hero’s Journey
The Hero’s Journey is a storytelling template from author Joseph Campbell, and it’s everywhere. It’s one of the most relatable storylines because it basically mirrors the journeys of our own lives. Understanding The Hero’s Journey can give you insight into how to frame your own stories, whether it’s the true story about your company or a fictional story that stirs your imagination.
The following diagram breaks down this Hero’s Journey template, step by step.
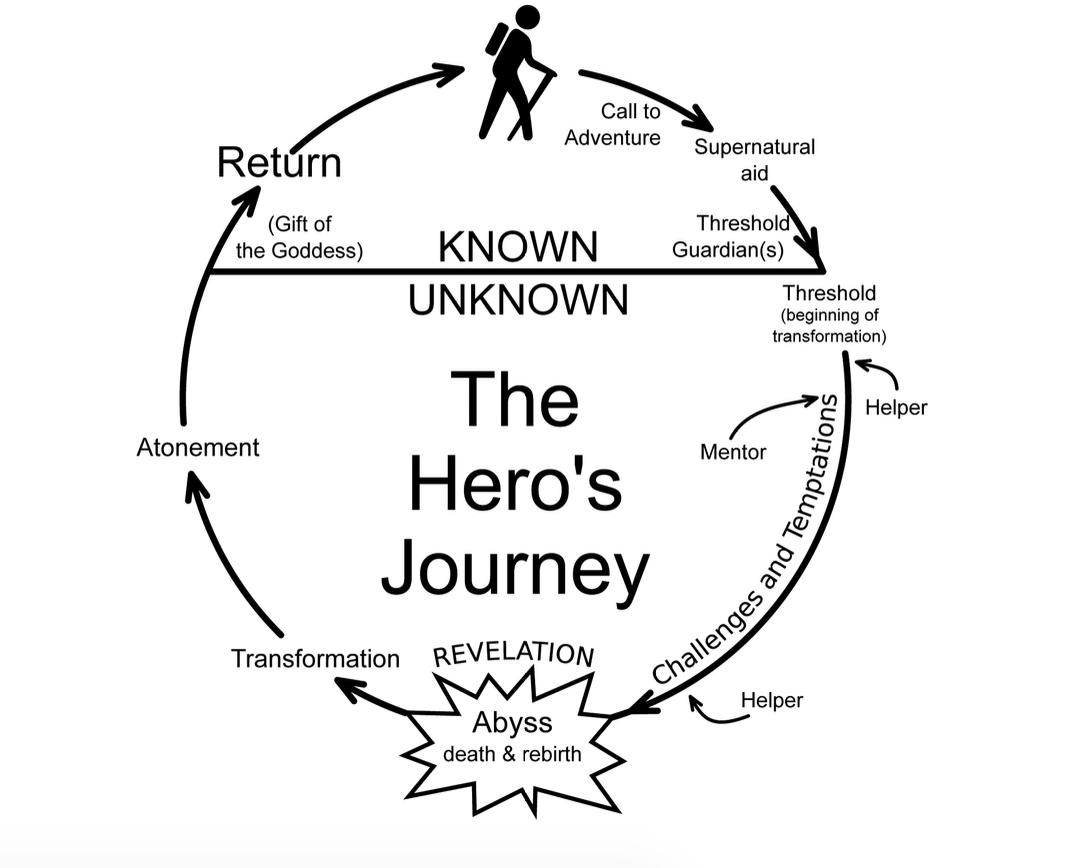
Typically broken down into three acts, the Hero’s Journey goes as follows:
Act 1:
- Ordinary World: A character (either you or your customer) is living a regular life.
- Call to Adventure: The character becomes aware of a problem or a task that must be completed.
- Refusal (of call): The character initially shows refusal — think of a customer who refuses to switch from their current provider despite their pain points.
- Meeting with the Mentor: The character meets a person who’ll guide them in the process of completing the task — think of a sales person guiding a lead toward conversion.
Act 2:
- Crossing the Threshold (into new life/experiences): The character officially starts their journey of solving the task, like a customer who’s just made a new purchase.
- Tests, Allies, Enemies: The character faces different trials in the process of completing the task.
- Approach to Innermost Cave: The character approaches the final battle — think of a professional who must now get their entire team to adopt a solution.
- Ordeal: The character goes through a battle or showdown — like in-team disagreements or discussions with stakeholders.
- Reward: The character emerges triumphant.
Act 3:
- The Road Back: Typically, the challenge isn’t over, and the character must deal with “blowback” from their previous battle.
- Resurrection: The character emerges with a new power, internal lesson, or external change.
- Return with Elixir: The character returns home or moves forward into a new adventure.
This is the Hero’s Journey, which—modified in various ways—we see repeated in stories throughout history. We have an ordinary person (what is), and we have adventure that lies ahead (what could be). The transference from one to the other is the journey.
Another great story template comes from comedy writing. It starts similarly: A character is in a zone of comfort. But they want something, so they enter into an unfamiliar situation. They adapt, and eventually get what they’re looking for, but end up paying a heavy price for it. In the end, they return to their old situation, having changed.
The Hero’s Journey: Fiction Example
The greatest story ever told…
Yes, we’re talking about Star Wars. Let’s step through a crude synopsis to see how well it matches Campbell’s pattern:
- Ordinary World: In the first Star Wars film, we begin with the rather ordinary Luke Skywalker. He lives on a farm on a desert planet.
- Call to Adventure: One day, he meets some robots who need help. They need to find a local hermit named Obi-Wan Kenobi. Luke takes the robots to Obi-Wan, who basically says, “Luke, you need to go out and help save the universe.”
- Refusal of Call, Meeting with Mentor, & Crossing the Threshold: Luke initially says, “No, I have all this stuff going on,” but Kenobi, who becomes Luke’s mentor, convinces Luke that he should go. Kenobi trains him how to use a lightsaber, and Luke goes on an epic space adventure.
- Test, Allies, Enemies: On the journey, Luke meets the villain, Darth Vader. He battles evil stormtroopers. He makes friends: Han Solo, Chewbacca, Princess Leia.
- Approach to the Innermost Cave: Luke then has to help defeat the super-weapon, the Death Star.
- Ordeal: Nearly everything goes wrong, but in the end, Luke succeeds in blowing up the Death Star.
- Reward: The last scene of the movie is of Luke getting a metal put over his neck by the princess, who kisses him on the cheek.
- The Road Back, Resurrection, & Elixir: Now he is in his new home, a changed man, emboldened by the great power of the Force, which he can use on future adventures.
The Hero’s Journey: Business Example
In business, the Hero’s Journey can most apply to case studies. (Most of them are a little less entertaining stories than Star Wars, unfortunately.)
A case study is the story of where a customer was, where they wanted to be, and how they overcame that gap.
If you listen to podcasts, you’ll hear this story told in almost every ad. You’ll also see it in “About us” pages. For example, check out Harry’s:
“Our founders, Jeff and Andy, created Harry’s because they were tired of overpaying for overdesigned razors. Instead, they wanted simple, high-quality products that felt good to use, all at a fair price. When they asked around, they learned lots of guys were upset about the situation too, so they decided to do something about it.”
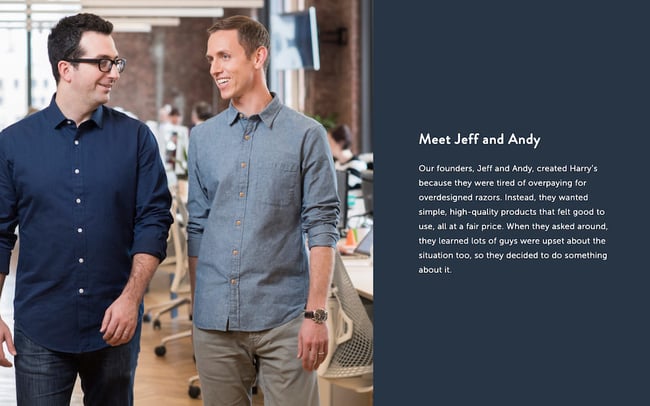
The problem with most brands’ stories is that they don’t walk us through enough of the steps of the Hero’s Journey to capture our attention.
That’s why these frameworks are so useful. They’re a really easy way to ensure that we’re more creative when we’re coming up with stories or trying to convey information. This framework helps you focus your creativity.
Need more? Check out The Storytelling Edge: How to Transform Your Business, Stop Screaming into the Void, and Make People Love You for more detail on using the Hero’s Journey in your business writing.
How to Bolster Your Storytelling Framework with the Benjamin Franklin Method
As you continue using storytelling templates, you can use Benjamin Franklin’s writing method to strengthen your skills and create better business stories.
What is Benjamin Franklin’s method, you ask?
Benjamin Franklin devised a system for mastering writing. He collected issues of a publication that contained some of the best writing of his day, and reverse engineered the prose. He took notes at a sentence level, sat on them for a while, and tried to recreate the sentences from his own head, without looking at the originals.
Upon comparison, Benjamin found that his vocabulary was lacking, and his prose was light on variety. Despite that, he did it over and over. Unlike the more passive method most writers use to improve their work (reading a lot), this exercise forced Franklin to pay attention to the tiny details that made the difference between decent writing and great writing.
Here’s how you can use this method to bolster your storytelling template.
Step 1: Reverse engineer your competitors’ copy.
Take a piece of copy that you particularly admire from your competitor’s website. It can be a webpage, a case study, a white paper, or an article. Read it while noting what’s particularly effective about it, then set it aside and rewrite it in the best way you know how. Be sure to use your notes to guide your rewrite, and try to identify the storytelling template your competitor is using.
Note: Don’t publish this material, as it can be flagged as plagiarism! But you’re welcome to keep it in a private doc.
Step 2: Compare your reworked version to the original.
Set the two versions side by side. How does yours compare? What is it missing? What did your competitor do well? How did you do well? Note your findings in a separate document. Do this again and again with your competitors and even your own copy. Once you have enough insight and experience, you can begin applying your findings to your new copy and even use it to rewrite your old copy.
A Storytelling Framework is Essential for Great Copy
By using storytelling frameworks, you’ll learn to write stronger business stories in no time. The Hero’s Journey is a best-in-class example for writing case studies, advertisements, articles, and even tutorials. Remember: People don’t remember brands. They remember stories. Use this to your advantage.
Note: This post contains excerpts from The Storytelling Edge: How to Transform Your Business, Stop Screaming Into the Void, and Make People Love You by Joe Lazauskas and Shane Snow.
Editor’s note: This post was originally published in January 2018 and has been updated for comprehensiveness.


9 Great Ways to Use Data in Content Creation
Creating content that works requires you to make informed decisions as opposed to relying on guesswork or throwing spaghetti at the wall to see what sticks.
To make these informed decisions, you need to focus on data-driven marketing and how it can help you collect, analyze, and apply data to your content.
If you’re running out of blog ideas and unsure how to use data in your content, keep reading to learn the best ways to use data before, during, and after the content creation process.
How to Use Data in Content Creation
Let’s consider how to use data properly at different stages of the content creation process: before, during, and after.
1. Using Data Before Content Creation
Just as no one sets out to build a house without first calculating the cost, so too should marketers not create content without looking at what the data says first.
Insights from data can help you know what type of content to create, who to create it for, and the best format to present such content.
Here are some specific ways to use data before you start creating.
Conduct Keyword Research
Before creating any piece of content, the first step is to know the topics you want to talk about or the keywords you want to target.
Since one of the primary goals of content creation is to engage with an audience, it’s crucial to uncover the queries they’re searching for online. Keyword research is how you get valuable insights (data) into these queries.
While conducting keyword research, it’s crucial to analyze the intent behind a search — whether it’s informational, navigational, transactional, or something else.
Some of the best tools you can use for keyword research include HubSpot’s SEO Marketing Software, Arel=”noopener” target=”_blank” hrefs, SemRush, etc.
Identify Your Audience
Imagine making the best steaks in town but then trying to sell them to a vegan audience – surely you won’t make any sales. Similarly, even your best pieces of content can have mediocre results if you don’t put them in front of the right people.
Data can help you identify the right people.
Using data, you can remove assumptions about your audience and who reads your content.
Data can tell you things about your target audience, like their age range, interests, emotional triggers, and social media platform where they hang out.
You can use Google Analytics, customer surveys, or some other social media analytics tool to uncover data insights about your audience.
Choose the Right Content Format
After uncovering who your audience is and what they search for online, you can also use data to discover their most preferred content format.
Do they want to read a blog post? Twitter thread? Or see video content like TikTok videos? Instagram Reels?
What the data shows will determine where to spend most of your content creation efforts to generate the highest return on investment.
BuzzSumo and Sparktoro are excellent examples of tools you can use to find the right content format your target audience loves.
2. Using Data During Content Creation
Let’s now consider how to use data while creating content.
Data can breathe life and new significance into your posts when leveraged well. This doesn’t mean threading spreadsheets directly into your posts. Instead, you should think about how to responsibly frame the data in a way that will advance your narrative.
By putting data into context and using it to strengthen your point, you can give readers a post that will stay with them long after they’ve left the page. Here are a few narrative techniques to consider when using data in your posts.
Demonstrate Change
There is no more powerful narrative technique than using data to demonstrate change over time.
In the example below, The Zebra uses data and maps to demonstrate the changing cost of car insurance in the United States over the last few years.
The darker areas on the map indicate areas with the highest car insurance rates.
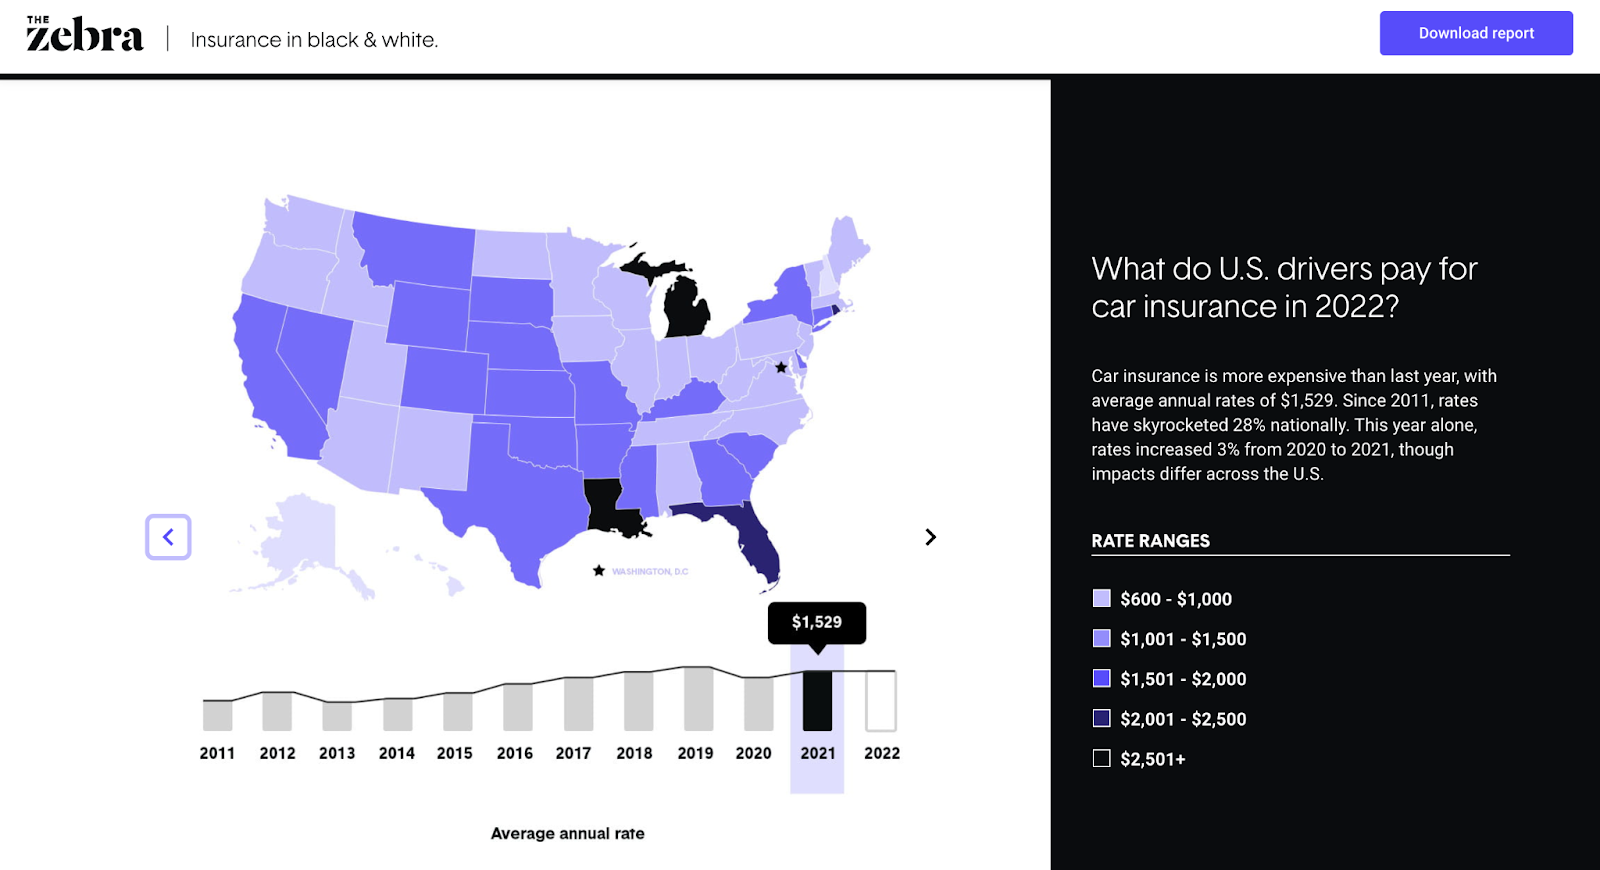
You can see the cost changes over time as you click the slider button.
Why It Works
Showing a striking change trend (whether it be deterioration or dramatic improvement) not only brings weight to the discussion but can also evoke an emotional response from your readers.
Show Discrepancy
Isolated on its own, data can fall flat. But put a set of data into context to highlight discrepancies, and you have a strong narrative.
In the example below, The Atlantic highlights the discrepancy between the many COVID predictions (and other economic issues) and the reality.
 Why It Works
By showing discrepancies between perception and reality or between two sets of data, you can highlight gaps that lead to clear calls to action.
Show Connection or Correlation
In this article, the British Heart Foundation (BHF) used data to show the correlation between watching TV and the risk of having coronary heart disease. Although the original data is from a third source, BHF does well to show the effect of a sedentary lifestyle.
Note: When showing the correlation between two things, be careful that you don’t imply causation. Be clear that you’re only showing that two things are connected somehow, not that one directly leads to the other.

Why It Works
Using data to show the connection between two or more different things helps readers make better decisions concerning future actions.
Give Scale
Another excellent way to use data in content creation is to demonstrate scale.
In this chart, New York Post uses a visual representation of data to demonstrate the scale of the tallest buildings in the world.

Why It Works
Scale can help you add context to your posts. What data do you have that can lend itself to this type of visualization? For example, did you serve more customers last year than the average number of attendees at a Red Sox game? How can you show the scope of your impact?
3. Using Data After Content Creation
You’ve seen how data can work before and during content creation. Let’s now consider how you can still use data even after you’ve hit publish on your post.
Optimize Published Content
One excellent way to use data “post-content creation” is to find opportunities for content refreshing.
Data from a tool like Google Analytics and Google Search Console can show you content that has been consistently losing traffic over time, allowing you to identify content needing an update or refresh.
You can also run a content audit to identify the best performers from the existing content that can be leveraged or repurposed for other marketing channels.
Analyze Audience Engagement
There are a ton of metrics you can track after publishing a piece of content to see how your audience interacts or engages with said content.
For instance, you can use Google Analytics to check how long readers stay on specific pieces. You can also use other tools to track your audience’s interaction in terms of clicks and cursor movements on a webpage.
Final Thoughts
There you have it — nine simple but effective ways to use data in different phases of your content creation process.
Even if you’ve never used data in your process before, the strategies mentioned in this article are easy to follow, and there are many tools you can use to make data work for you.
Editor’s note: This post was originally published in September 2011 and has been updated for comprehensiveness.

The Age of the Connected Customer
Growing a business has never been easy. But these days, it feels impossible.
Companies are trying to predict growth in an unpredictable macro environment. The economy is down, the market is volatile, socio-political issues are raging, and the dust is still settling on hybrid work. Every week, there’s a new twist or turn.
In case navigating all this uncertainty isn’t hard enough, companies are dealing with another major shift. Over the past year, the strategies that businesses rely on to attract, engage, and delight customers have started to break. It’s harder to generate demand, drive leads, reach prospects, and meet customers’ high expectations. At the height of the pandemic, many businesses thrived in a digital-first world, but now that momentum is slowing and it’s harder than ever to connect with customers.
The flywheel feels frozen. But why?
This question keeps me up at night. Helping organizations grow better is our mission at HubSpot. We’re passionate about helping scaling companies get ahead and navigate periods of uncertainty. That’s why we went on a listening tour to understand what’s standing in the way of our customers’ growth, and how we can help solve it.
Across hundreds of conversations with customers, there was one word that kept coming up: disconnected. We discovered that companies are in a crisis of disconnection today, caused by three major disconnects. They’re struggling with disconnected systems, disconnected people, and disconnected customers. I want to share what we’ve learned about each disconnect, and how we believe companies can solve this crisis.
Systems Are Disconnected
The first theme we heard loud and clear is that companies are struggling with disconnected systems. This has always been a problem, but it’s gotten worse over the past few years. We recently ran a pulse survey to understand the biggest challenges businesses are facing, and the number one pain point was disconnected systems (HubSpot Market Research, 2022).
It makes sense when you think about it. During the pandemic, companies shifted to fully-digital overnight and there was a frenzy of buying point solutions. They bought a tool for every task, every team, and every department. As a result, the average scaling company has 242 SaaS tools today. The problem isn’t that companies have a lot of tools, though — it’s that too few are connected. Each has its own data and processes but there’s no one place tying it all together.
As a result, companies are spending more time connecting data than connecting with their customers. They have to spend hours cleaning data and trying to cobble insights together from different systems. What’s worse is that their go-to-market teams don’t have a unified view of the customer’s journey, so they’re working in silos and their customer experience is suffering.
It’s a total mess.
That’s why, when it comes to growth, it’s time to accept that disconnected point solutions are not the solution.
People Are Disconnected
The second disconnect is that people have become more disconnected from each other. From quarantining, to social distancing, to working remotely, isolation has become part of our daily lives. The problem is, we’re human. We rely on each other for support and connection.
When I need advice at work, do you know what I do first? I lean on my peers. I reach out to a mentor, a co-worker, or my network for support. But it’s become harder to tap into one another; we aren’t bumping into each other at the office or meeting up at networking events like we used to.
In fact, 45% of workers say that the number of people they interact with at work decreased, and 57% of people say that they engage in fewer social activities these days. No wonder Peloton became so popular during the pandemic. For me, it wasn’t just about exercise, it was about being part of a community.
And I know I’m not alone. When I talk to our customers, I hear the same theme loud and clear: They crave community. They want to build deeper relationships with their co-workers, their customers, and their network, but it’s not as easy as it once was.
Companies Are Disconnected from Customers
The third and final disconnect is that companies are more disconnected from their customers than ever. They’re writing blogs at a frenzied pace but still can’t drive traffic. They’re emailing prospects but can’t get a response. The channels and strategies that used to work for companies now seem to be working against them. So, what changed?
We dug into this and found that there are two major shifts happening. The first is that people are digitally drained. From our social feeds, to our inboxes, to our text messages, we are bombarded at every turn. As a result, buyers aren’t engaging with companies like they used to, and you can see it in the data.
In 2020, 65% of Google searches ended without a click, and the average blog shrunk by -1.64% in 2021. According to HubSpot data, sales email response rates have plummeted by 40% compared to pre-pandemic rates. The channels companies have relied on to attract and engage customers are now overly saturated, pushing people out and ad costs up.
The second change is that we are now living in a privacy-first world. People are more protective of their data than ever. Apple’s recent ad campaign is a great example of this shift; they’re positioning privacy as the iPhone’s core value proposition. When one of the most valuable companies on the planet comes out that strongly on a value, we should all take notice. What this means for businesses is that the cookies, tracking, and consent they’ve depended on are now being cut off in a privacy-first world.
Buyers today are digitally drained and distrusting of companies with their data. Both of these shifts lead to companies being more disconnected from their customers than ever. And that’s exactly what I hear from our customers. They’re struggling to cut through the noise, to reach prospects, and to build relationships with customers the same way they used to. They’re coming to terms with a hard truth which is that old go-to-market strategies won’t work in this new world.
Based on our research and conversations with customers, these three disconnects are clear. Systems are disconnected. People are disconnected. Companies and customers are disconnected.
This all leads to a crisis of disconnection.
Companies are struggling with unprecedented disconnection from their customers and each other, compounded by disconnected systems. They’re grasping for growth. Their revenue is unpredictable. Their flywheel is stalled. Their teams are burnt out.
That’s why it’s time to evolve. Companies can’t continue relying on broken data, broken processes, and broken strategies. The only way to solve this crisis is to adapt and find new ways to grow in the Age of the Connected Customer.
Introducing the Age of the Connected Customer
For years, companies have relied on legacy CRMs to ‘manage’ their customer relationships. But that won’t cut it in this new world. We believe the companies that will win in the future are the ones that focus on customer connection, not customer management. That means you need more than data, you need context. You need more than leads, you need connection. You need more than contacts, you need community.
You need a connected customer growth strategy. Connected customer growth is about optimizing every stage of your customer’s journey to boost connection. It’s about evolving your Attract, Engage, and Delight strategies to provide more value and relevance. You can start by asking yourself questions like: What 20% of content creates 80% of value for our customers? How can I use data to bring more context to my customer conversations? How can I make it easier for customers to buy? These types of questions will help you identify easy ways to optimize your flywheel for customer connection.
But evolving your strategy alone isn’t enough. You need the right technology to make connection possible — connection with your data, your teams, and your community. That’s why we’re bringing three powerful parts of HubSpot’s solution together:
- Connected Applications: Our Hubs — Marketing, Sales, Service, CMS, and Operations — are designed to connect your entire front-office. They give go-to-market teams a single, unified view of the customer journey.
- Connected Platform: Our CRM platform powers the Hubs with connected data — including commerce data — and extensibility. The platform is customizable and has over 1,100 app integration partners to give companies flexibility at scale.
- Connected Community: Companies need more than software to grow, so we’re bringing together educational content through our Academy, as well as assets and expertise through our partner networks.
The combination of all three is our connected customer platform. To learn more about what we’re building at HubSpot and some exciting new features to help boost connection, visit hubspot.com/new.
You can expect to learn much more from us over the next year on how to put customer connection into action, optimize your strategies, and how HubSpot’s platform is evolving to connect data, strategies, and people. As we step into the Age of the Connected Customer, I am confident that scaling companies can emerge stronger from this crisis.
And we’re here to help you grow better, connected.
