
7 of the Most Inventive Interactive Marketing Examples We’ve Ever Seen
If you really think about it, the content formats we rely on today have an uncanny resemblance to the content formats we relied on yesterday — our blog posts look like print articles, our offers look like books, and our slide decks like look presentations.
Relying on the content formats we used yesterday to educate and entertain our audience today is fine, though. They’re ultimately used to these mediums. But, at the same time, we’ve overlooked a huge opportunity to engage our audiences at record levels. We’ve glossed over the fact that a screen and computers are so much more than just digital pieces of paper and printing presses.
Fortunately, the interactive marketing movement is charging along and their early adopters have proven that if marketers want to cut through the noise, they can’t just do what they’ve always been doing. They need to refresh their work.
What is interactive marketing?
Interactive marketing is an innovative type of marketing where your audience can interact with engaging visuals or videos within your content. It unleashes your creativity and, in turn, allows you to tell more gripping stories, crowning it as one of the best ways to capture your audience’s attention.
Interactive Marketing Campaign Examples
1. Clash Up | Eko
Mash-up remixes like Two Friends’ Big Bootie Mixes are some of the most popular tunes around today, racking up over 35 million SoundCloud streams over the past three years. However, Eko, an interactive storytelling platform that produces interactive shows, music videos, and branded content, has created a remixed music experience that’s arguably more entertaining than any of Two Friends’ mixes.
In Clash Up, Eko’s interactive music experience, they let you mix a variety of songs from different genres and decades with one main track. For instance, in their first episode, Six Degrees of B.I.G., you get to choose from a diverse range of songs like A-Ha’s “Take on Me”, Jason Derulo’s “Wiggle”, Brandy’s “I Wanna Be Down”, Devo’s “Whip It”, and The Flaming Lips’ “When You Smile” and blend it with one of The Notorious B.I.G.’s most legendary songs “Big Poppa”.
2. The Structure of Stand-Up Comedy | The Pudding
Stand-up comedians might seem like the lucky wisecrackers who are blessed with the talent to improvise some of the funniest jokes and bits you’ve ever heard, but, in reality, they polish their performance with painstaking precision. To crack their audiences up as much as possible, they make sure their routine’s stories seamlessly flow from one to the other. However, some comedians, like Ali Wong, take their stand-up preparation to an entirely different level.
In their interactive slideshow about how Ali Wong structured her Netflix special Baby Cobra, The Pudding, a digital publication that crafts visual essays about culture and entertainment, describe how she sculpts her routine into a narrative instead of just telling a bunch of separate jokes. By visually outlining her entire routine, The Pudding reveals how Ali Wong weaved all her bits into a story, building her world and perception of life in a way that her audience can truly understand, which left them with a deeper feeling of empathy, meaning, and, ultimately, humor.
3. Incorporated Interactive Trailer | Syfy
To promote Matt Damon’s and Ben Affleck’s science fiction television series, Incorporated, Syfy teamed up with Wirewax, a company that offers interactive video technology and creative services, to produce an interactive trailer that pulls you into a dystopian future where global corporations also serve as totalitarian governments.
As the trailer plays, you can click on hotspots that’ll play clips of the show, previewing its premise and giving you a glimpse of the main character’s motivation and scheme to undermine the corporate government that controls his city.
4. The New Media Message | Velocity Partners
In their interactive slideshow, which honestly looks like it belongs in Tron, Velocity Partners, a B2B marketing agency, explains why innovative marketers need to leverage new content formats in order to tell more refreshing stories.
By showing, not telling, how their interactive slideshow, which is called a Velocity String, can captivate an audience, as well as how marketers have created so many blog posts, eBooks, and SlideShares that they’ve become dull and predictable, Velocity Partners hammers home the point that the most engaging and surprising mediums are best at delivering the most engaging and suprising stories.
5. The Big Gronkowski | Ceros
In honor of Rob Gronkowski’s recent retirement, Ceros, an experiential content creation platform, decided to create an interactive article that spotlights the two things Gronk will always be remembered for — his athletic prowess and goofy attitude.
When you visit their interactive article, you can toggle between Gronk’s “Warrior” and “Goofball” side, clicking on hotspots that reveal his impressive achievements, his laundry list of injuries, and some of the funniest things he’s ever done. Once you finish interacting with the article, you’ll truly understand why Rob Gronkowski is considered just as athletic as he is goofy.
6. Scotland From the Sky | BBC Scotland
In 2019, Rough Guides, a renowned travel guidebook, named Scotland the most beautiful country in the world. And a big reason why it’s such a spectacle is because Glen Coe, a Scottish valley that cuts through the ruins of an ancient supervolcano, is one of the most striking landscapes in the world.
With their immersive, 360 degree video of Glen Coe, BBC Scotland can grip viewers because they’re able to experience the landscape from an intimate point of view at every possible angle, making them feel like they’re actually there.
7. Conversational Marketing | HubSpot
Interaction is the crux of conversational marketing, so it makes perfect sense that HubSpot leveraged this Velocity String to convey the importance of conversational marketing and promote their 15-part video crash course on implementing live chat, Facebook Messenger, and bots to your inbound marketing strategy.
By contrasting our reliance on messaging apps to interact with friends and family with marketing’s sluggish adoption of chat bots, covering conversational marketing’s benefits, and spotlighting how HubSpot’s new messaging tools can integrate with your entire marketing suite and database, HubSpot’s interactive slideshow not only engages you for its entire duration, but it also persuades you to take the next step and learn even more about conversational marketing after you finish interacting with their content.

17 of the Best Calligraphy Fonts You Can Download for Free
The right font can instantly improve the look of your marketing presentation, impress your client, or escalate your design from average to exceptional.
But it’s often tough to find a font that falls somewhere in-between classy and dramatic — particularly when you’re not willing to pay for an experienced calligrapher.

Calligraphy fonts are more artistic than the average font, often using a script style to emulate the look of handwriting. But as generic as this may sound, there are dozens of calligraphy styles you can choose from.
Types of Calligraphy
There are three main types of calligraphy: western, eastern, and Arabic. Each type reflects the language and handwriting of a different region of the world. Whereas western calligraphy demonstrates English handwriting, eastern calligraphy encompasses most Asian alphabets. Arabic calligraphy is a tall typeface based entirely on the Arabic alphabet.
We’ve compiled 17 of the best calligraphy fonts we found online, all of which are considered western calligraphy. These fonts are subtle, professional, and eye-catching. Best of all, they’re free, so you can download and try them all before picking your favorite.
Check out our list, if for no other reason than to see me try to describe what fonts look like …
Most of these fonts are for personal use only, but some of them are available for commercial projects. Below each font, we’ll specify whether it’s free for personal or commercial use — however, if you’re considering using the font for commercial purposes, please read the font’s individual licensing agreement.
Free Calligraphy Fonts
1. Alex Brush

This font is classic and understated. It’s also legible and clear, with decent space in between each letter, so you can use the font even for dense paragraphs of text.
Download at: 1001 Free Fonts
Free for personal and commercial use.
2. Adreno Script Demo Regular

Adreno Script is more playful and fun than most of the other calligraphy fonts in the bunch, making it a good option when your design intent is more lighthearted.
Download at Urban Fonts
Free for personal use.
3. Quigley Wiggly
 Quigley Wiggly doesn’t look as goofy as it sounds, but you’ll still get a healthy dose of casual when downloading this typeface. Its bold style makes it a perfect title font for any campaign you might be hosting.
Download at: 1001 Fonts
Free for personal and commercial use.
4. Balqis

If you’re designing an artsier project, like a book cover or presentation swag, this font is folksy and down-to-earth, and doesn’t appear too formal.
Download at: Free Design Resources
Free for personal and commercial use.
5. Bukhari Script

Bukhari Script is bold and fluctuates in shading, making it appear vintage and old-school. It’s a good font to use if you’re trying to invoke some nostalgia in your marketing.
Download at: Font Fabric
Free for personal and commercial use.
6. Champignon

This font is decorative and classically formal — you’d probably use this font for invitations, placeholders, or titles, rather than long paragraphs of text or a presentation.
Download at: Dafont
Free for personal and commercial use.
7. Easy November

The swoopy, exaggerated nature of Easy November makes it a great font for titles or branded items like calendars or stickers. Its eye-catching nature makes it appropriate for many different platforms.
Download at Font Space
Free for personal use.
8. Great Day

This font falls somewhere between retro and conservative, making it fitting for both professional presentations, or playful signs or titles. The spacing between each letter also makes it easier to read than some of the other calligraphy fonts.
Download at Font Space
Free for personal use.
9. Kristi

This is one of the more casual and spirited fonts in the mix, evoking memories of girls names in high school yearbooks, which could be ideal if you’re looking to add a personal or hand-written feel to your design.
Download at: Font Squirrel
Free for personal and commercial use.
10. Arizonia Regular

This wide script font is super artistic but easy to read, making it well-suited for fun campaigns that need to be legible at first glance.
Download at Fontsc
Free for personal use.
11. Learning Curve Pro

If there was ever a font that mimicked a “Learn Cursive” activity book, this would be it. The simple, precise lines make it a good bet for any longform content you’re trying to spruce up, while remaining traditional.
Download at: Font Squirrel
Free for personal and commercial use.
12. Pinyon Script

This formal design echoes nineteenth century letter-writing styles, making it a tasteful option for formal posters, invitations, or namecards. This is a good font to use if your theme is more conservative.
Download at: 1001 Fonts
Free for personal and commercial use.
13. Ralph Lanok Future

Ralph Lanok Future is dramatic, and sleek. While it seems too theatrical for dense text, it’s a great option when you’re aiming to draw a viewer’s attention to a few words or phrases.
Download at Urban Fonts
Free for personal use.
14. Sacramento

This casual, funky font is a throwback to styles of the 1960s — perfect for large signs or advertisements aiming to create a vintage feel.
Download at: 1001 Fonts
Free for personal and commercial use.
15. Sophia

Undoubtedly one of the more feminine, charming fonts in the list, Sophia uses wide and thin strokes to appear beautifully hand-drawn. This font would work perfectly for any design calling for a soft, graceful feel.
Download at: Creative Booster
Free for personal and commercial use.
16. Special Valentine

Special Valentine is one of the few classic fonts where the uppercase and lowercase letters are similar sizing and aligned. This makes it useful for full paragraphs by ensuring easy readability, but it’s still elegant enough to also use for invitations or titles.
Download at Urban Fonts
Free for personal use.
17. Qaskin Black Personal Use

There’s something about this font that screams “outdoors-y” to me. I don’t know if it does the same for you, but regardless, Qaskin Black is an unusual calligraphy font, seeming more tough and rustic than the others.
Download at Font Space
Free for personal use.



The Ultimate Round-Up of Content Marketing Tips
In 2019, there are now over four billion active internet users, and over three billion social media users, worldwide — simply put, that’s a ton of opportunity for your brand to engage with an audience and achieve massive growth for your business.
One of the most effective methods for spreading brand awareness and attracting new customers to your business is through content marketing.
Content marketing is a marketing strategy that focuses on creating, publishing, and distributing valuable and relevant content online, with the purpose of reaching a targeted audience and incentivizing profitable customer action. Ultimately, customer marketing is a critical component for long-term, sustainable growth.
And yet, despite its immense impact, many marketers don’t know how to implement a successful content marketing strategy. In fact, 63% of businesses don’t even have a documented content strategy.
To ensure you’re able to cultivate a truly valuable content marketing strategy in 2019, we’ve created this round-up of content marketing tips — keep reading to become a true content marketing expert.
Content marketing tips
- Make sure your content has a clear, measurable business goal.
- Understand your buyer’s journey.
- Rely on analytics to track your performance.
- Keep content consistent and up-to-date.
- Adopt a historical optimization strategy.
- Repurpose your content.
- Ensure your brand voice remains steady across channels.
1. Make sure your content has a clear, measurable business goal.
You might be overwhelmed by the sheer amount of content you can create for your business — anything from Instagram Stories, to blog posts and e-books, to podcasts.
However, as Karla Cook, Editor and Manager of HubSpot’s Marketing Blog, notes, “[It’s critical] every single piece of content you’re creating has a clear, measurable business goal in mind — and simply ‘getting views’ isn’t a complete business goal.”
“Take the time to think about how content can serve your overall marketing strategy, and create pieces that tie back to that.”
For instance, let’s say you decide you want to lean heavily into a blogging strategy. Simply crafting and publishing content isn’t enough — instead, it’s important you identify your target audience, and decide how your content can best serve that audience. Additionally, you’ll want to use analytics to ensure your content is able to reach the right people with the right search intent.
Once you identify how to serve your audience, you’ll want to ask yourself, “How does this tie back to the business?” While it’s critical you write quality content to grow your audience, it won’t help attract prospects if it doesn’t tie back to your business.
Take a look at This Strategy Helped the HubSpot Blog Break a Year-Long Traffic Plateau to learn more about cultivating a business-focused strategy for content creation.
2. Understand your buyer’s journey.
A good content marketer understands that her strategy needs to engage and delight a reader at any stage of the buyer’s journey. While your content should be used to initially attract new visitors to your site, it should also be used to convince hesitant prospects to purchase, and encourage customer retention and long-term brand loyalty.
For instance, perhaps you understand many customers become hesitant to purchase your product because they believe you need extensive video knowledge to succeed with it. To help mitigate concerns and aid your sales team, you might create a video campaign to show customers how to use video marketing in 2019.
3. Rely on analytics to track your performance.
Quality content is important, but it doesn’t mean much for your business if your visitors and viewers don’t convert into customers. This is why analytics is so important — by carefully monitoring, tracking, watching, and reporting on the numbers, you’ll be able to gauge what’s working, what isn’t, and what could be working better.
Traffic is important, but it’s important you also focus on conversion rates. Perhaps your Instagram account has only 1,000 followers — alternatively, your blog has 7,000 readers. However, your Instagram page has a conversion rate of seven percent, and your blog only converts at about .01. This should tell you that, while your blog is important for an initial introduction to your business, your Instagram is critical for sales, and shouldn’t be ignored.
Additionally, focusing on analytics will help you refine and improve your strategy for the future. For instance, let’s say you notice your blog readers are particularly interested in your blog topics related to e-commerce. This can help direct your future strategy — you can choose to focus more heavily on e-commerce topics, which will increase traffic (signaling your readers are happy with your content), and ensure you’re spending time and effort where it matters.
4. Keep content consistent and up-to-date.
Victor Pan, Head of Technical SEO at HubSpot, urges content strategists to implement simple SEO tactics to ensure their content remains up-to-date and relevant to search engines. He says, “You can tell if being up-to-date is important to your topic if ‘keyword+year’ shows up in the ‘related searches’ of a Google search result.”
To ensure your content remains relevant and updated, Pan recommends the following three tips:
- Exclude the year in the URL when you’re optimizing your content. Cool URLs don’t change.
- Include the year in the title of your content.
- Schedule your editorial calendar to revisit this content every year so you can keep it up-to-date, which could include updating the title tag, meta description, and content itself.
It’s important to note, if you do implement an optimization strategy, it’s critical you don’t update the URL. The URL should remain the same to ensure you don’t need to re-earn backlinks. Additionally, you don’t want to create unnecessary redirects.
Additionally, consistency is key. Publishing consistent content will help you rank in the SERPs, but it will also establish trust in your readers and viewers.
5. Adopt a historical optimization strategy.
A few years ago, the blogging team at HubSpot figured out the importance of adopting a historical optimization strategy. Through repurposing old (yet still high-quality) content, the team was able to double monthly leads, and increase monthly organic search views by an average of 106%.
Ultimately, you don’t want old content to go to waste. If a topic is particularly evergreen (like “how to create a blog”), it makes sense you’d put time and effort behind repurposing the topic.
6. Repurpose your content.
It takes time and talent to craft highly useful, engaging content — so, by finding ways to recycle existing content, you’re ensuring peak efficiency. Additionally, repurposing content allows you to reach a new audience. For instance, let’s say your podcast team published a high-performing podcast episode. Why not turn that episode’s topic into a blog post?
Alternatively, maybe you created a blog post that performed significantly well — now, you might consider creating a YouTube video that covers a similar topic, to reach an audience that prefers video over text.
Repurposing your content will also ensure your audience has more than one chance to see it. Your readers, viewers, and followers are busy. Consider simply implementing a new content promotional strategy on a piece of content that deserves to be resurfaced.
7. Ensure your brand voice remains steady across channels.
Whether you visit Spotify’s Twitter page, YouTube account, or stumble across one of their billboard advertisements, you can quickly get a sense for the brand’s funny, candid, youthful voice. This is what makes me feel connected to Spotify — its unwavering brand consistency, regardless of the channel on which I choose to engage.

Even if you have a marketing team of 30, it’s critical you continue to produce similar messaging that aligns with your brand’s voice and values across channels. A viewer should be able to watch one of your YouTube videos and then click a link to a blog post and think, “Ah, yes — this is definitely the same company.”
If you need help crafting or refining a brand voice, check out How to Find Your Brand’s Voice [SlideShare].

The Ultimate Guide to Google Analytics in 2019
Are you confused — even intimidated — by Google Analytics? Good news: you’re not alone. GA is notoriously complicated.
In fact, when I first started to delve into GA’s waters, I wondered if I’d ever truly get it. There were so many concepts to learn and reports to run. How did people ever conquer this thing?!?!
Lots and lots of reading and trial and error, it turns out. I’m not saying I’ve reached total mastery — there’s always something new to pick up — but I’m vastly more comfortable.
And I want you to be, too. So here’s the cheat sheet to everything I’ve learned over the years. This guide might be long, but it’ll take you from zero to hero in 6,000 words. And if you still have questions, let me know! I’m @ajavuu on Twitter.
Time for a lightning round of questions.
What is Google Analytics?
GA is an analytics tool that gives you an extremely in-depth look at your website and/or app performance. It integrates with all of Google’s marketing products (including Google Ads, Search Console, and Data Studio) making it a popular choice for anyone using multiple Google tools.
Is Google Analytics free?
There is a free and paid version of GA (the latter is called Analytics 360). Small and medium-sized businesses will likely get all the features you need from the free version. Enterprise businesses need to upgrade — at least if you want advanced funnel reporting and attribution modeling; roll-up reporting; more views, dimensions, and metrics per property; and unlimited and unsampled data.
Paying for 360 also gives you access to dedicated support, including your own account manager. This alone can make the subscription fee worth it.
And about that subscription fee? It’s not cheap. Analytics 360 begins at $150,000 per year (invoiced monthly) and increases after your site receives more than one billion monthly hits.
360’s cost will price out many businesses. However, if you have the budget for both the service and an agency or in-house analyst to manage your analytics operations, consider investing.
With that out of the way, let’s get to the good stuff.
How to Use Google Analytics
- Create an account, if you haven’t already.
- Add the name, URL, and industry of the website you want to track.
- Get your custom Javascript tracking code that’ll allow GA to monitor your site.
- Add this code directly after the <head> tag of your site. (More on this below.)
- Visit your GA portal and verify the code is working by looking at the “Real-Time reports” section while clicking around on your site in a different tab or on your phone. The report should show at least one visitor to the site (that’s you!)
Do you need to add the GA code to every page of your site?
That’s a lot of manual work — especially if your website has more than 50 pages. Plus, what happens when you create new pages? Do you need to add the tag every time?!?
Relax, because the short answer is: no. The longer answer: you only need to add the tag to every page template. So, if you have one page type on your site (meaning every individual page uses the same header module), you only need to add it to that module — and it’ll be applied to every page.
If you have two page types, you’d need to paste the code into the two separate header modules. Three page types? Three header modules.
And if you use a CMS like HubSpot or WordPress, this task is even easier. These tools come with a separate field where you paste your tracking code just once. HubSpot users can follow these simple instructions for adding GA.
For more, read our guide to installing the Google Analytics tracking code on your site.
Google Analytics Hierarchy
To set up GA properly, you must understand the various layers.
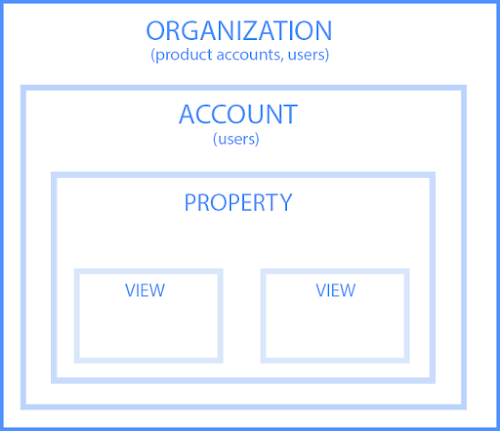
Organization
The organization is the highest level. It represents a company. For example, our organization is HubSpot, Inc. One organization can encompass multiple GA accounts.
Organizations are recommended for larger businesses, but not mandatory.
Account(s)
Accounts are not optional. Using Google Analytics requires at least one (sometimes several) accounts.
An account doesn’t mean a user account. I can log into the HubSpot Google Analytics accounts using my Google email ID. HubSpot’s head of technical SEO can also log into the same account using his Google email ID. Our historical optimization specialist can also log into the same account using his Google email ID.
Important details:
- You can assign one property to each account or multiple properties to one account. Every account can hold up to 50 properties.
- You can give user permissions for an entire Analytics account, a property in an account, or a view in a property.
You might be wondering, “What’s better: creating a new account for every property or adding every account to the same property?”
It depends on your use case and goals.
For example, suppose you have one website — the Stark Industries corporate site — and five subdirectories, including the Stark Industries blog, careers section, media resources, case studies, and investor relations information. You want to create separate properties for each subdirectory so the people on each team can look at how their portion of the site is performing, as well as the larger site.
But maybe you have another site that discusses Tony Stark’s work with S.H.I.E.L.D. You want the S.H.I.E.L.D. team to see data for this subdirectory, but you don’t want them to see data for the rest of the website. You create a new account and property for the S.H.I.E.L.D. site.
Property
A property is a website or app. Each property can support up to 25 views.
View
At the minimum, you need two views per property:
- One with zero configuration — essentially the “raw” version of the view
- One with filters set up to exclude any traffic from within your company (i.e. a filter for your IP address) as well as bots and spam traffic
A view only captures the information after your filters and configured settings have been applied. And once you delete a view, that data is gone forever. For those reasons, it’s critical to keep an unfiltered view of your data.
Google Analytics Dimensions and Metrics
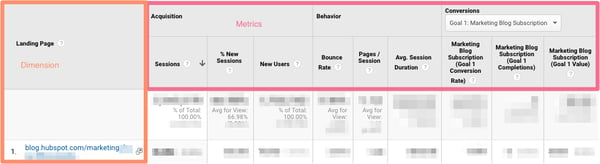
To use GA successfully, you need to understand dimensions versus metrics. I’ve found the easiest way to think about it is:
- Dimensions = categorical variables. Simple examples include names, colors, and places.
- Metrics = quantitative variables. Basic examples include age, temperature, and population.
Or as my Data Analytics professor put it, “Metrics are what you can do math on.” Not the most eloquent phrasing, but it works.
Dimension examples
- Browser
- Location
- Landing page
- Device
- Customer type
Metric examples
- Sessions
- Pageviews
- Conversions
- Bounce rate
- Session duration
In any GA report, your dimensions are your rows and your metrics are your columns.
Custom dimensions and metrics
GA lets you create custom dimensions and metrics from Analytics data plus non-Analytics data. To give you an idea, suppose you track the membership type of customers who have created an account in your CRM. You could combine this information with pageviews to see pageviews by member type.
Or maybe you run a blog. If you want to understand how audience engagement impacts other metrics (like conversions, pages per session, etc.), you could create three custom dimensions for each type of reader:
- Advocate: user who shared one-plus posts on social media
- Subscriber: user who signed up for your email list
- Customer: user who purchased premium access
Using these dimensions will give you invaluable information. Follow GA’s instructions to set up custom dimensions and metrics.
What’s a Google Analytics audience?
An audience is a group of users that have something in common. That commonality could be anything: maybe you’re targeting consumers in Australia, so you have an “Australian audience,” or you want to sell to millennials, so you have a “25-34 audience.”
GA comes with several built-in audiences (including the two I just mentioned, location and age). You don’t need to do a thing to set these up — once you have the tracking code installed, GA will automatically break down your visitor data into these audience reports.
However, you can also create custom audiences. Perhaps you’re only interested in Australian millennials; you’d need to make a custom audience that only includes visitors who are A) in Australia and B) between the ages of 25 and 34.
Creating an audience is fairly easy. Honestly, the hardest part is figuring out what you’re trying to accomplish and then identifying the user characteristics that’ll help you do that.
Once you’ve done that, follow these instructions to create a new audience segment. From there you can import a segment to use as the basis for your Audience Report.
That brings us to the next question:
What’s a Google Analytics segment?
A segment is a subset of your data. I like to picture an entire pizza made up of all different slices — one slice has pesto and mozzarella, another has sausages and spicy peppers, another has ham and pineapple, and so on. Metaphorically speaking, each slice is a segment.
You can create segments based on:
- Users (e.g. users who have bought something on your site before, users who have signed up for a consultation, etc.)
- Sessions (e.g. all sessions that were generated from a specific marketing campaign, all sessions where a pricing page was viewed)
- Hits (e.g. all hits where the purchase exceeded $85, all hits where a specific product was added to the cart)
Like audiences, GA provides you with several segments. I wouldn’t stop there: you can get incredibly granular with your segments.
To give you some inspiration, here are a few of HubSpot’s segments:
- Users who viewed a specific product page and watched the demo video
- Users who viewed the same product page and didn’t watch the demo video
- Users who view a specific Academy course page
- Users who view a specific Academy lesson page
- Users who view a blog post and a product page
The sky is your limit — well, that, and GA’s segment cap.
You can apply up to four segments at a time to any report.
Google Analytics Reports
GA’s left-hand sidebar can be a bit overwhelming. You’ve got six reporting options (all with confusing, vague names), and clicking on any of those only gives you more options.
Let’s walk through each report together.
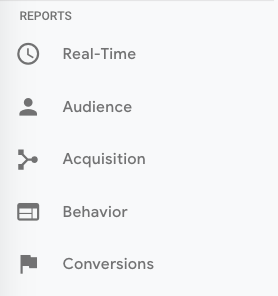
The Google Analytics Real-Time Report
As the name suggests, the Real-Time report gives you insight into what’s happening on your site at this very moment. You can see how many visitors are on your site, which pages they’re visiting, which social platforms they’re coming from, where they’re located, and more.
While this report is fun to look at occasionally, it’s probably the least valuable. Here are some ways to use Real-Time:
- See how much traffic you’re getting from a new social or blog post
- Know immediately if a one-day sale or event is driving views and/or conversions
- Make sure tracking URLs and custom events that you’ve just set up are working as they should
These are useful, but as you’ll see, the other reports pack a far greater punch.
The Google Analytics Audience Report
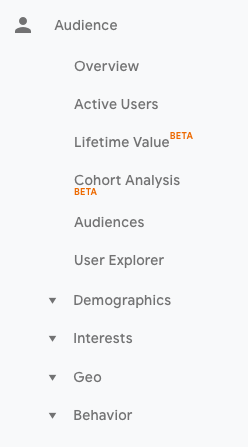
Audience overview
This report gives you a high-level overview for the property you’re currently looking at.
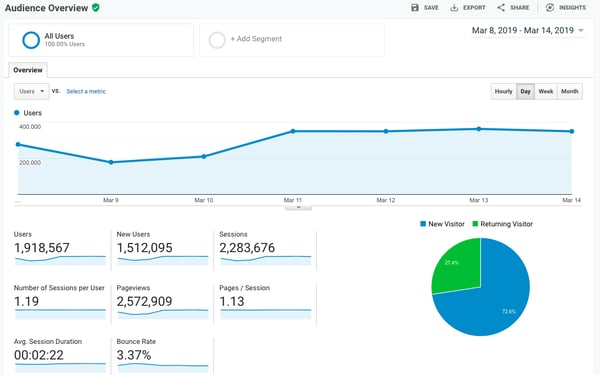
Check this report once a day to get a sense of how you’re trending overall.
Underneath “Overview,” you’ll see “Audiences,” as well as expandable menus for “Demographics,” “Interests,” “Geo,” “Behavior,” “Technology,” “Mobile,” “Cross-Device,” “Custom,” and “Benchmarking.” Explore each of these sections to get a sense of what they can tell you about your visitors.
Every section describes an audience.
Active Users
Whoever named this report belongs in the same group as the person who named guinea pigs: “active users” doesn’t refer to users currently on your site — that’s the Real-Time report — and guinea pigs are neither pigs nor from Guinea.
The Active Users report shows you the number of users who visited in the last day (1-day active users), week (7-day active users), two weeks (14-day active users), and four weeks (28-day active users.)
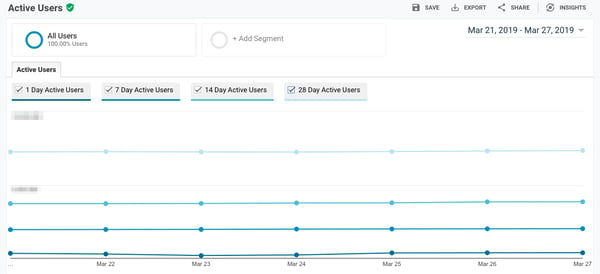
What’s the value of this report, you ask?
If you have more 1-day users than longer-term ones, you’re struggling with retention. People aren’t coming back to your site or app — you need to figure out why.
I’d also recommend looking at this report with various segments; for instance, perhaps you see that users in a certain age bracket have much better retention than the average.
Lifetime Value
First things first: do you need a refresher on Customer Lifetime Value (CLV) and how to calculate it? We’ve got you.
The Lifetime Value report gives you a sense of how valuable users are to your company. You can see lifetime value for, say, the users you generated from email marketing versus the ones you acquired from organic search. Armed with this information, you can decide which channel to invest more in.
A few notes: Lifetime Value is capped at 90 days. The Acquisition date range, however — which you can adjust — is available from March 2017 onward. This range reflects all the users you acquired in that time frame.
Imagine you’re interested in looking at transactions per user for users you acquired in the week before Black Friday. You’d adjust the date range to that week specifically. Then you’d see the average transactions per user for that cohort over the following 90 days.
Because HubSpot is a SaaS company, not an ecommerce business, I look at goal completions per user, pageviews per user, and sessions per user by Acquisition Channel.
If my team has recently wrapped up a marketing campaign, I’ll look at the same metrics by Acquisition Campaign.
But if you are in ecommerce and want to see transaction and revenue data, you’ll need to have ecommerce tracking set up. I recommend this excellent blog post on tracking CLV with custom dimensions and metrics as well.
You should also give this explanation of why you shouldn’t track CLV in GA a read.
(By the way, here’s how to track revenue in HubSpot.)
Cohort Analysis
Some people have gone so far as to call Cohort Analysis “the single most powerful report in GA.”
So, how does it work? This report groups users by one characteristic — so far, “Acquisition Date” is the only “Cohort Type” you can use. By the way, Acquisition Date is the day a user first visited your website.
You have several options from there.
- First, pick your cohort size: day, week, or month.
- Next, pick your metric, or what you want to explore for this cohort. It can be further broken down into Per user, Retention, and Total.
- Per user means the total count of that metric divided by the cohort size. So if you choose Transactions per user, for example, you’ll see the average number of transactions per user for that cohort.
- Retention is simple: user retention, or the number of users who returned that day, week or month (determined by the cohort size you selected) divided by the total number of users in that cohort.
- Total: the total number of sessions, transactions, etc. that occurred for that cohort size.
- Choose your date range. GA lets you see up to three months of data.
Now let’s dive into reading the report, because it’s not obvious.
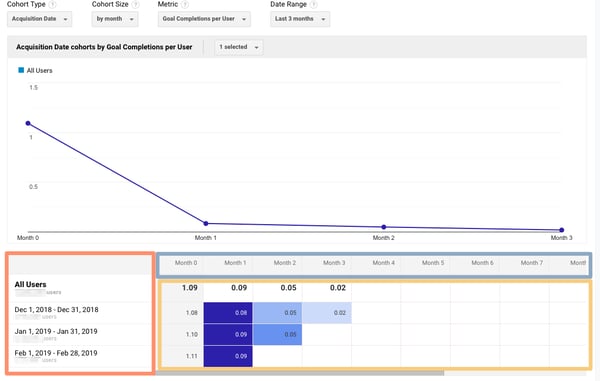
The left-hand column shows you the Cohort Type you picked — Acquisition date, by default — broken down by Cohort Size (day, week, or month).
The first row shows you the totals for all the users in that cohort. Each row underneath that represents the activity in that day, week, or month (in this example, we’re looking at month.)
The row outlined in light blue reflects the Cohort Size you’ve chosen. Remember that data only goes back three months at the max.
The row outlined in yellow shows you the values for the metric you chose (in this case, Goal Completions per User). In the eternal words of Calvin Harris: baby, this what you came for.
Look at the first row. This tells you the average goal completions for the entire cohort in the first month after they were acquired was 1.09. Average goal completions for the entire cohort in the second month after they acquired dropped to 0.09. By the last month, it’s 0.02.
Now look at the next three rows. It looks like average goal completions per user in the first month after they were acquired increased slightly from December to January and again from January to February.
This is pretty usual behavior. Let’s imagine that instead, this report tells us average goal completions per user for February 1-28, 2019 (the last row) was 4.07. Woah! That’s nearly four times as high as December and January.
We’d definitely want to investigate further. And to do so, all we have to do is right-click on the cohort we’re interested in.
Make sure you click on the column if you want the entire day, week, or month analyzed. Click on a cell if you want to analyze only the users who, for example, completed a goal three days after they were acquired on February 27, 2019.

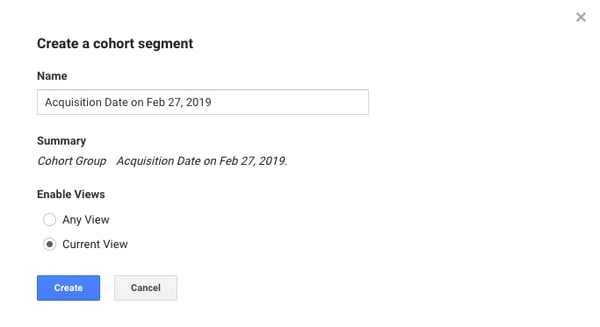
When you right-click, this box will pop up:
Give this cohort a descriptive name. Change the views to “Any View” if you want to use this segment across your entire property (which I usually recommend), then click “Create.”
Voila — now you can compare this cohort to any other segment in any report you choose.
Google Analytics Acquisition Reports
This report breaks down your traffic by source: organic, direct, referral, email, social, paid search, display, affiliate, and (Other). (GA uses the (Other) category when it doesn’t know how to categorize a subset of traffic.)
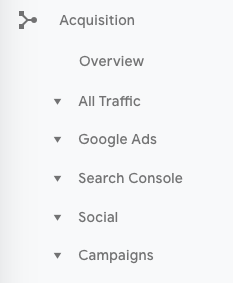
From All Traffic, you can click into Channels.
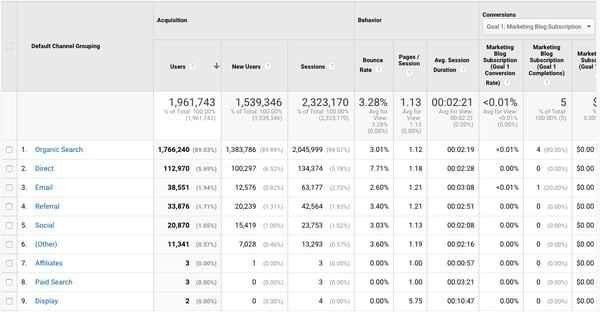
Click on any category to explore each source in detail.
Depending on the category, you’ll see landing pages (which URLs your visitors entered the site on), source (which website brought them to yours), or keyword (which query took them to your site.)
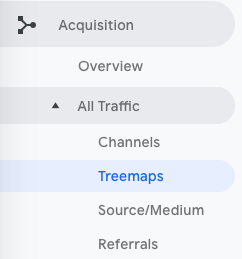
To see this information presented visually, click on All Traffic > Treemaps. This post walks you through how to read and adjust the Treemaps report.
The next report, Source/Medium, breaks down the general category of traffic (which you saw in “Channels”) into the search engine or domain.
It’s useful if you want to get more granular insight into the ways people are coming to your site. For example, you might notice that a whopping 70% of your referral traffic is coming from LinkedIn, while just 5% is coming from Pinterest. Depending on your marketing team’s priorities it may be time to shift focus.
The last report, Referrals, reveals the specific URLs that sent people to your site, e.g. your referral traffic.
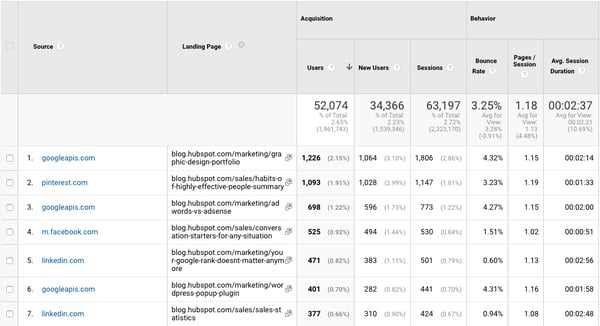
I like to add “Landing page” as a secondary dimension so you can see which pages on your site are receiving the referral traffic.
Google Analytics Behavior Reports
Out of all the reports in GA, I use the Behavior ones the most.
Site Content
This report gives you a review all of the blog posts, landing pages, web pages on your site.
All Pages
Let’s start with Site Content > All Pages. This shows the top-trafficked pages for your current view and/or segment. It’s useful in and of itself — you should always keep a careful eye on your most viewed URLs — but I especially like it when I’m analyzing traffic growth or declines.
To give you an idea, maybe total traffic to my website has dropped 10% month over month. I’d navigate to Site Content > All Pages and change the date range to this month compared to the last month (making sure the days of the week match up).
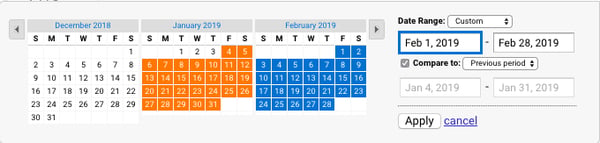
Then I can see the differences in pageviews by URL:
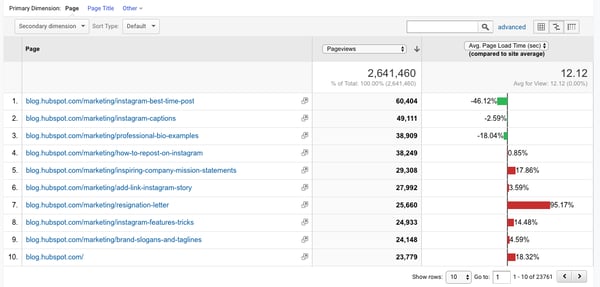

This helps me identify which pages received less traffic and contributed to that decline.
Helpful tip: I like to change the “Sort Type” from “Default” to “Absolute Change” so I see the results sorted by the greatest differences in percentage rather than total views.
I also add Page Title as a secondary dimension so I can see the name of each page alongside its URL.
Content Drilldown
This report breaks down the structure of your site by subdomain and then subfolder. To give you an idea, for HubSpot we can see data for each of our subdomains, including:
- blog.hubspot.com
- developers.hubspot.com
- community.hubspot.com
And so on. If I clicked into blog.hubspot.com, I could then see aggregated data for:
- blog.hubspot.com/sales
- blog.hubspot.com/marketing
- blog.hubspot.com/service
You get the drift. This report is probably most valuable for those managing highly complex properties.
Landing Pages
Landing pages is another one of my favorite reports. GA defines a landing page as the first page in a session — in other words, the visitor’s first interaction with your website.
There are a few ways to slice and dice this report.
First, if you’re interested in the sources (organic, paid social, direct, etc.) driving users to the landing page, you can add Source/Medium as a secondary dimension.
This is basically the opposite version of the report we added earlier.
Second, if you only want to see which landing pages users visited from a specific source, on a specific platform, or within a specific category, you can add the appropriate system segment:
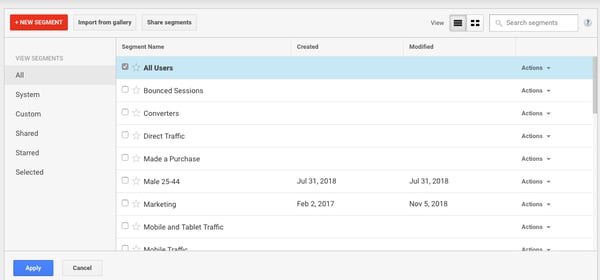
Maybe you’re most interested in the landing pages that mobile and tablet users see — so you choose the Mobile and Tablet Traffic.
Or perhaps you’re curious about users who ended up buying something, so you choose the “Made a Purchase” segment. There are lots of possibilities here.
Exit Pages
This report shows the last pages users visited in their sessions before they left your site.
That’s a little confusing, so let’s use an example.
I want to find a place to grab dinner with my friends, so I search “Mediterrean restaurants near me.” A place that looks good pops up, so I click on it. First, I check out the menu. They have a hummus sampler — yum. Then I click on their press page. It links to a recent article on Eater, so I leave the site to read it. The reviewer loved the food. I’m sold.
The Press page would be my exit page.
You may hear that you should analyze your exit pages to understand why users are leaving your site — I think this example reveals why that strategy doesn’t always make sense. Just because someone has left doesn’t mean anything is wrong with the content.
So, check this report out, but take the data with a grain of salt.
Site Speed
This report is pretty self-explanatory: it tells you how quickly your site is loading for users. Obviously, the faster the better — not only do faster pages correlate with higher revenue, but Google’s algorithm takes page load time into account.
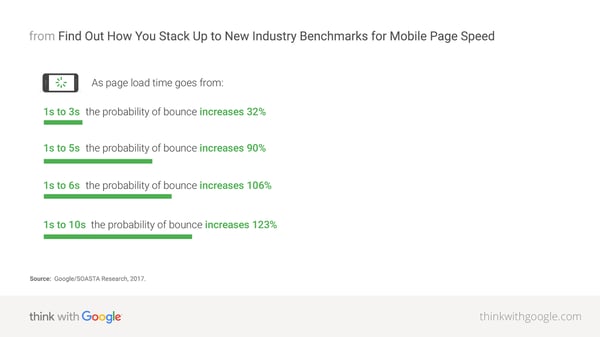
Site Speed Page Timings
This report delves into the average page load times for each URL. I use it to identify the slowest-loading pages on HubSpot’s site with the ultimate goal of figuring out why they’re taking their sweet, sweet time and how to speed them up.
The default metrics are pageviews and average page load time, but I also recommend looking at:
- Avg. page load time and bounce rate
- Change the Sort Type to “Weighted” so you see the blog posts with the highest pageviews first
- Avg. page load time and page value
- The latter gives you a sense of how much a specific page contributes to your total revenue
- Looking at these two together helps you find slow-loading pages that are valuable to your bottom line (even if they don’t get a ton of traffic), making them a high priority to fix
Site Search
First things first: if users can search your website, make sure you’ve set up Site Search in GA. You must enable it for every view separately (here are the step-by-step instructions).
Usage
I typically start with the “Usage” report, which tells me how many sessions occurred with and without one-plus searches. In other words, I learn how frequently people used site search for the view and time period I specified.
Search Terms
Here’s where you learn what people are searching for. Look for themes: if you see the same search terms coming up multiple times, there are a few conclusions you could draw.
Either you need to create new content that gives users the information they’re looking for, and/or you need to better surface existing content so it’s easier to find.
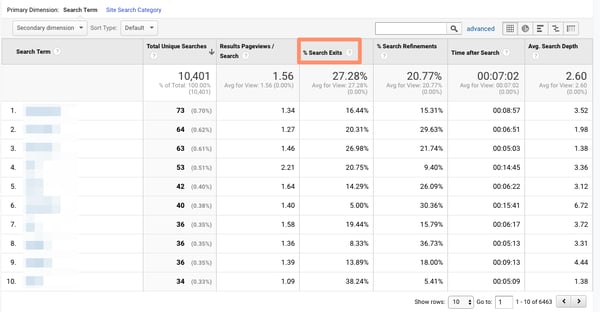
Pay attention to the “% Search Exits” column, as this tells you how many users clicked away from the search results page rather than choosing a result. You can usually infer there wasn’t a good answer for their question (or it wasn’t appropriately titled.)
Search Pages
This report displays which pages users are starting searches from. It’s important to think about this contextually. Maybe people are commonly beginning searches from your 404 page — that makes sense and isn’t anything to be alarmed about.
If, on the other hand, they’re starting searches from a product landing page, something’s wrong. The content clearly isn’t living up to the expectations they had when they clicked the ad link.
Loves Data provides a solid overview of GA’s Site Search reports if you want to explore them even further.
Events
A user clicks a button. Then they download a file. Next they watch a video.
No, this isn’t the world’s most boring bedtime story — it’s an example of a GA event. Three events, to be specific.
GA defines events as “user interactions with content that can be measured independently from a web page or a screen load.”
Those user interactions are up to you; you’ll need to add special code to your site or app that tracks the specific actions you’re interested in. Here are the instructions.
If you’re not excited about events tracking already, I want you to get excited. There are infinite possibilities here: if you have an event set up for watching a product demo, and another for clicking a link to an external review of your tool, you can measure how many times each event happened.
Maybe you discover your video isn’t getting many plays. It’s probably time to optimize the current video, make it easier to find on your site, or create a new one. Or perhaps you see that way more users than you expected are checking out the third-party review of your product. That tells you users want more social proof and testimonials. Since the review is favorable, you might want to put it front and center on your site.
Top Events
This report tracks the events taking place most frequently — pretty straightforward. You’ll see total events (e.g. how many times that event happened) and unique events (how many sessions included one or more occurrences of that event).
If you’ve set values for your events, this report also shows you how the total value of each event and its average value (or the total value divided by the frequency.)
Pages
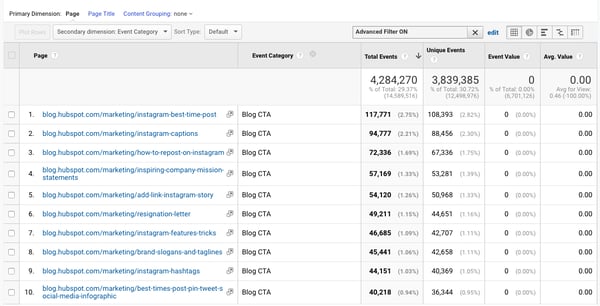
In this report, you can see which pages generate the most actions. I typically add “Event Category” as the secondary dimension, then filter for the event I’m most interested in.
To give you an idea, my team tracks “Blog CTA.” This event fires whenever a user clicks a CTA embedded in a blog post. To get to the report below, I added “Event Category” as the second dimension, then filtered for “Page begins with blog.hubspot.com” (so I’d only see URLs on the blog) and “Event Category equals Blog CTA.”
Now I can see which posts generate the most CTA clicks. Hopefully you’re starting to see the power of event tracking!
Events Flow
The Events Flow report tracks the order in which events take place on your site. It can tell you:
1) whether particular events tend to happen first — and if they trigger other events
To give you an idea, maybe users frequently watch your demo video, then click the CTA to schedule a call with a salesperson.
2) whether certain event categories are more common than others
Imagine you see that videos are played far more often than PDFs are downloaded.
3) whether users act differently based on segment
For example, perhaps people coming in via organic scroll to the bottom of your pricing page far more than people coming in via social media.
Note: this report is very subject to sampling. (Read more about GA’s data sampling practices here.) Sampled data is usually pretty accurate, but it means the more important the conclusion you’re drawing, the less uncertainty you’ll be able to tolerate.
To reduce the level of sampling, make the date range smaller.
Publisher
If you monetize your website with Google AdSense or Ad Exchange, you can use the Ad Manager and Google Analytics integration to bring information on how your ad units are performing into GA.
I won’t go into any more detail here, but I recommend reading the following resources if you want to know more:
Google Analytics Conversion Reports
If you have a website, you have an objective — probably several — for the people who visit your site.
Ecommerce store owners want their visitors to subscribe to their mailing list, make a user account, add something to their cart, and/or complete the order confirmation process.
Media companies want their visitors to stay on their site for as long as possible and/or view a certain number of pages (all the better to maximize their ad revenue.)
B2B businesses want their visitors to download an ebook, sign up for a webinar, or book a call with a sales rep.
Google Analytics makes it possible to measure all of these things — plus many more.
A goal is essentially a conversion that you’ve defined (which is why this info shows up under the Conversion section.)
There are four main types of goals:
- Destination: this goal is completed when a user reaches a specific page, like a product page, order confirmation page, or thank you page
- Event: this goal is completed when a predefined event fires (like the Events you can set up as, well, Events — think watching a video or sharing something to social media)
- Duration: this goal is completed when a user’s session lasts longer than a pre-set time
- Pages/screens per session: this goal is completed when a user views a specific number of pages (or screens for an app) per session
The first two are insanely useful. The last two are pretty useless. (If you have an interesting use case for Duration or Pages/screens per session, let me know on Twitter @ajavuu. I’d love to be proven wrong.)
Once you’ve identified your goals, take a look at these instructions for creating, editing, and sharing them. This guide on choosing goal values is also quite helpful.
Overview
Head here to learn how you’re doing goal-wise across the board. I get the most from this report when I compare date ranges and/or look at goal completions by segment.
For example, quickly looking at goal completions by device reveals mobile visitors sign up for the blog newsletter much less frequently than desktop and tablet visitors. That could be because it’s hard to sign up for the newsletter on a phone — or it could be mobile users are looking for one thing and ending their session as soon as they’ve found it. I should dig in more to decide which case it is.
Goal URLs
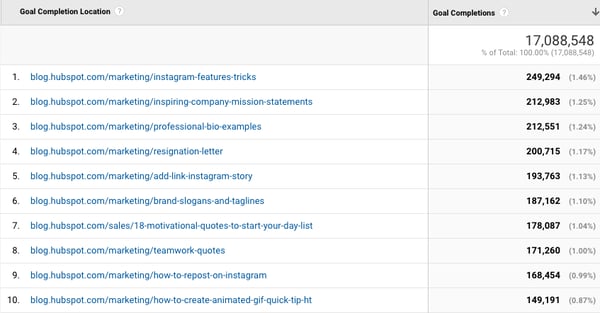
Knowing a goal was completed isn’t helpful in and of itself; you also need to know where it happened. Suppose you’ve embedded the same form in three separate pages on your site. It’s great that Daenerys Stark from Dragonstone, Blackwater Bay just filled out your form to get in touch with a consultant, but which page did she fill it out on?
The Goal URLs report shows you. It breaks down conversions by “Goal Completion URL” (read: where it went down.)
Reverse Goal Path
Reverse Goal Path is the unsung hero of the Conversion section. Well, I’m singing its praises now. This report allows you to see the last three pages a user visited before completing the goal.
It’s useful for goals that aren’t sequential. Maybe you have a contact form that appears in multiple places on your site, or there are two different paths that lead users into buying your ebook. Thanks to this report, you can understand the various ways people arrive at the end destination — and there’s no need to set up a funnel.
I usually filter down to a specific goal completion location or goal previous step 1, 2, or 3.
For example, since I’m interested in seeing which blog posts generated leads from content downloads, I added “Goal Previous Step – 1 containing blog.hubspot.com” to the filter.

Here’s what I got:
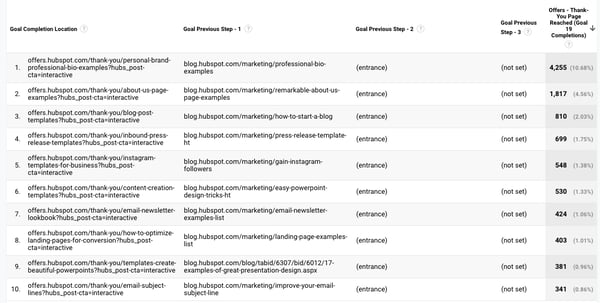
“(Entrance)” means the user came to the site on that step; “(not set)” means the user didn’t complete any steps prior to that one — because they weren’t on the website yet.
For a comprehensive exploration of Reverse Goal Path, take a look at OnlineMetrics’s guide.
Funnel Visualization
For sequential goals, Funnel Visualization is your go-to report.
Going back to the ecommerce example, the last goal would be “Arrived at the order confirmation page.” The goal before that, or goal #3, would be “Clicked checkout.” The goal before that, goal #2, would be “Added something to cart.” And the goal before that, goal #1, would be “Looked at product listing page.”
At each stage, you can see user drop-off. That lets you identify areas where you can improve conversion rates; for example, maybe you lose a lot of users during the checkout process. You change the flow so they can check out as a guest (versus needing to create an account), which dramatically reduces checkout abandonment.
To see this level of detail, you’ll need to map out your goals as a series. If all of your goals are simply the end objective, like “Arrived at the order confirmation page,” you won’t be able to reverse-engineer how users progress.
The Funnel Visualization report also requires you to mark the first step in the goal path as required or not. If you tell GA that yes, the first goal needs to be completed, Funnel Visualization will only show you the sessions where the user first finished goal #1. If a user skips goal #1 and goes straight to goal #2, their session won’t be represented here.
Read WPromote’s primer on Funnel Visualization next to get more details on setting up and reading this report.
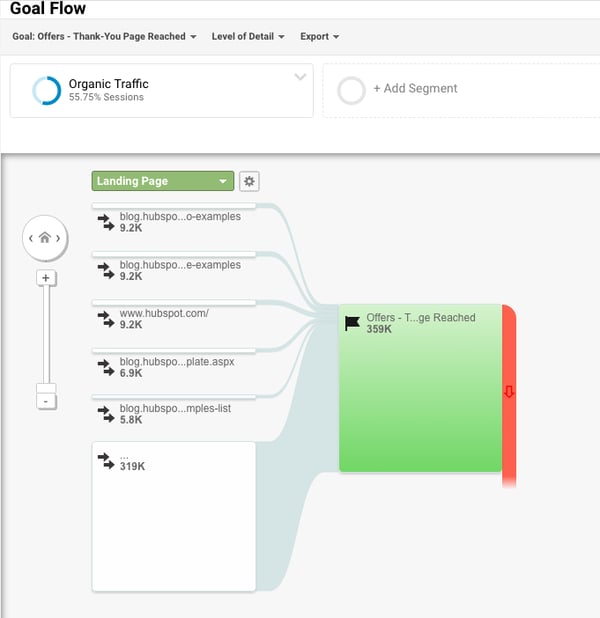
Goal Flow
If Funnel Visualization is the uptight relative who always made you take your elbows off the table and wash your hands before you ate, Goal Flow is the laid-back, fun relative who’d randomly take you out of school to go to the zoo.
All that to say: Goal Flow gives you a lot more freedom than Funnel Visualization. Unlike the latter, Goal Flow shows you all sessions that led to the completed end goal — regardless of whether the user completed the required goal #1 or not.
Another difference from Funnel Visualization: Goal Flow also shows you loopbacks — i.e. when a user goes back to a previous page or refreshes their current one.
If the user skips a step, Funnel Visualization “backfills” it. Goal Flow doesn’t.
If you edit an existing funnel or create a new one, Funnel Visualization will show you all your data from that moment onward. Goal Flow, on the other hand, can show you data from the past.
You can also toggle the Dimension and Level of detail of the report, as well as the segment, to get even more granular.
I recommend looking at various segments to see which convert at the highest and lowest rates — plus where they commonly drop out.
Note: this report is very subject to sampling. (Read more about GA’s data sampling practices here.) Sampled data is usually pretty accurate, but it means the more important the conclusion you’re drawing, the less uncertainty you’ll be able to tolerate.
To reduce the level of sampling, make the date range smaller.
Smart Goals
This report is helpful if you’re A) using Google Ads and B) not measuring conversions. Basically, Google uses machine learning to identify your “best” sessions — or those likeliest to generate conversions — and then translates those themes into Smart Goals.
Once you have Smart Goals, you can use them in Google Ads to optimize your ads performance.
Smart Goals are controversial within the marketing community because the data is minimal and businesses will be far better served by setting up their own conversion tracking. Keep that in mind if you decide to use them.
Now You’re Ready to Track
Google Analytics is a highly valuable tool for any business as it gives you tangible data that you can apply to grow your business. Bookmark this guide and come back to it as your data tracking becomes more sophisticated.
Good luck on your Google Analytics journey.

How to Create UTM Codes to Track Your URLs [UTM Builder]
A crucial aspect of being a great marketer is being able to measure your success. No matter which metrics you use, you want to prove to your boss (and the company) that you’re worth your salt.
You deserve your budget — and maybe need more of it — and you deserve to dedicate time to the marketing activities that work. Building UTM codes that track your campaigns’ success is the best way to prove it.
Measuring the impact of your work can be tricky without the right tools. Sure, you know Twitter drives a certain percentage of traffic to your website … but do you know if your company’s tweets were the ones driving those visits? Or that your specific guest post drove actual leads and customers to your website?
Luckily, you can prove all of that with a few special codes added to the end of your URLs: They are called UTM codes. In this blog post, you’ll learn what UTM codes are, how to use them, and how to build them in both HubSpot and Google Analytics.
Download our free marketing reporting template here to help you keep track of all your marketing metrics.
What are UTM codes?
UTM codes are snippets of text added to the end of a URL to help you track where website traffic comes from if users click a link to this URL. Marketers can customize this text to match the webpage this URL is linked on, allowing them to attribute the success of that campaign to specific pieces of content.
UTM codes are also known as UTM parameters, or tracking tags, because they help you “track” website traffic from its origin.
Now, you might be thinking, “Ginny, I have HubSpot, so I already know if my website traffic is coming from Google, email, social media, and similar marketing channels. What does a UTM code tell me that I don’t already know?
HubSpot Marketing Hub provides you with these high-level sources of traffic, but this tool also helps you drill down into specific pages and posts within these traffic sources.
UTM Code Example
If you’re promoting a campaign on social media, for example, you’ll know how much traffic came from social media. Building a UTM code, however, can tell you how much of that traffic came from Facebook, or even a particular post on Facebook.
Here’s an example of a URL with its own UTM code highlighted in orange at the end of the URL below:
http://bit.ly/19pUmxr?utm_campaign=blogpost &utm_medium=social&utm_source=facebook
In the example above, you’re saying that once traffic comes in from people who click this link, the traffic should be attributed to Facebook. The “medium” is social media, while the “source” is Facebook.
Adding these snippets of code after the question mark above doesn’t affect anything on the page — it just lets your analytics program know that someone arrived through a certain source inside an overall marketing channel, as part of a specific campaign.
What can UTM codes track?
UTM codes can track a medium and a source within that medium. Where it gets more flexible is in the language you use to describe that source. Maybe you want to attribute website traffic to a social network, a type of content, or even the exact name of an advertisement on the web.
Here are the five things you can track with UTM codes and why you might track them:
1. A Campaign
Campaign-based tracking tags group all of the content from one campaign in your analytics. The example UTM code below would help you attribute website traffic to links that were placed as a part of a 20% discount promotion you’re hosting.
Example: utm_campaign=20percentpromocode
2. A Source
A source-based URL parameter can tell you which website is sending you traffic. You could add the example code below to every link you post to your Facebook page, helping you to track all traffic that comes from Facebook.
Example: utm_source=Facebook
3. A Medium
This type of tracking tag informs you of the medium that your tracked link is featured in. You can use the example UTM code below to track all traffic that comes from social media (as opposed to other mediums, like email).
Example: utm_medium=socialmedia
4. A Piece of Content
This type of UTM code is used to track the specific types of content that point to the same destination from a common source and medium. It’s often used in pay-per-click (PPC) campaigns or with two identical links on the same page, as shown in the sample UTM code below.
Example: utm_content=sidebarlink or utm_content=headerlink
5. A Term
A term- or keyword-based tracking code identifies the keywords you’ve paid for in a PPC ad. If you pay for a Google Ads campaign to rank under the keyword, “marketing software,” you might add the following UTM code to the end of the link you submit to Google to run this ad.
Example: utm_term=marketing+software
The best part about UTM parameters is that you can make any combination you like of these code — use the bare minimum (campaign, source, and medium) to track all of your links, or use all of them to get super specific about your tracking. Clearly, you can use a combination of UTM parameters in lots of ways:
- Track the success of certain marketing initiatives.
- See how well your social channels promote your content versus when your followers promote your content.
- Measure the effectiveness of guest posting referral traffic.
- Track the same piece of content across multiple marketing channels.
- See where most people click on your internal links in a blog post.
Okay, so you’re on board with UTM codes … but how the heck do you set them up? It’s easy. Below are instructions for setting up and measuring UTM parameters in HubSpot and Google Analytics.
How to Build UTM Codes in HubSpot
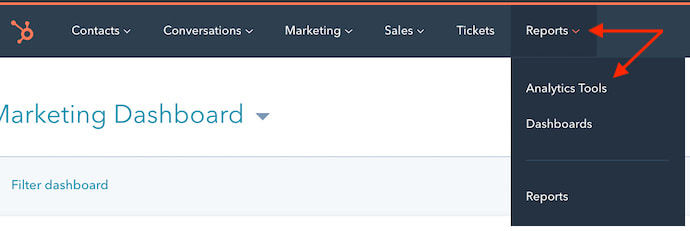
1. Navigate to your Analytics Tools.
In your Marketing Hub dashboard, select “Reports” on the top navigation bar. Then select “Analytics Tools” in the dropdown, as shown below.
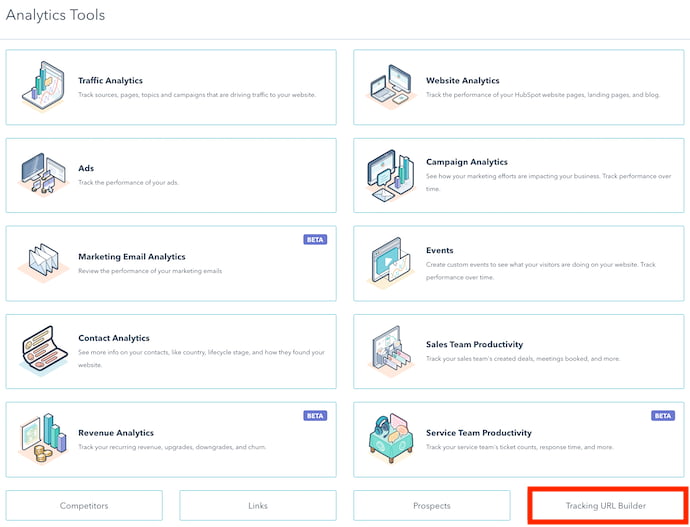
2. Open the Tracking URL Builder.
In the menu of analytics tools that appears, look to the very bottom-righthand corner. You’ll see the option, “Tracking URL Builder.” Click this option at the bottom of the page, as shown in the red box below.
3. Open the Tracking URL form to create a new UTM code.
Whenever you create a web campaign that includes at least one UTM code, you’ll see this campaign listed on the page shown below. This page outlines a tracking tag’s source, medium, term, content, and creation date, which you can see along the bottom of the screenshot below. Click “Create Tracking URL” in the top-righthand corner.

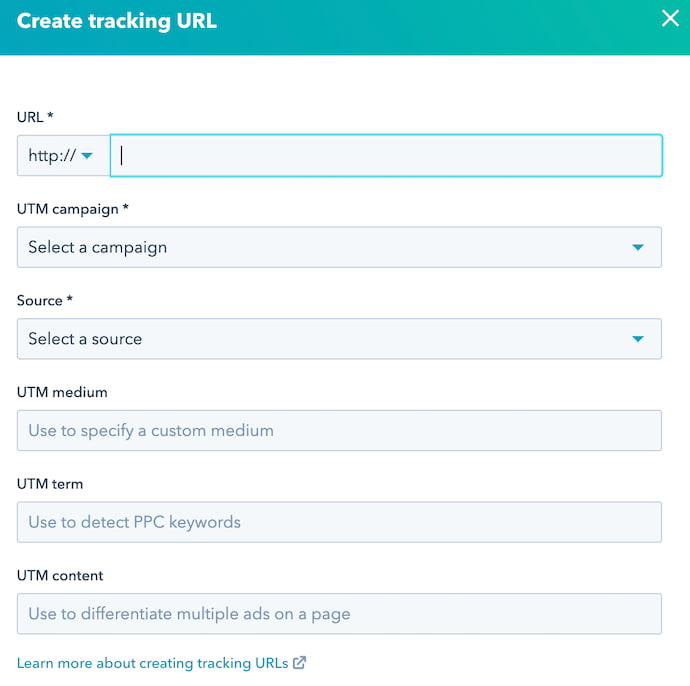
4. Fill in each attribute of your UTM code and click “Create.”
In the form that appears, fill in the URL, Campaign, Source, and Medium fields. If you’d like to add Content and Term, you can do so in the bottom two fields of this form. When you’re done, you’ll see an orange “Create” button become available at the bottom. Click it, and HubSpot will log your UTM code as a new campaign, and this link will ready to include on any webpage from which you want to track the traffic.
5. Use the shortened link in your marketing campaign.
6. Measure your success.
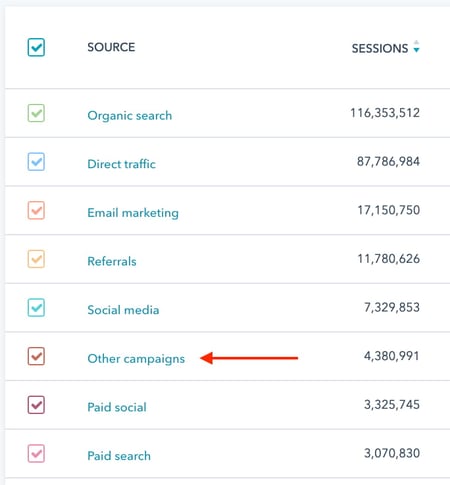
You can track your UTM parameters in your Traffic Analytics dashboard under “Other Campaigns,” as shown below. Click on the individual campaign to break down the source and medium.
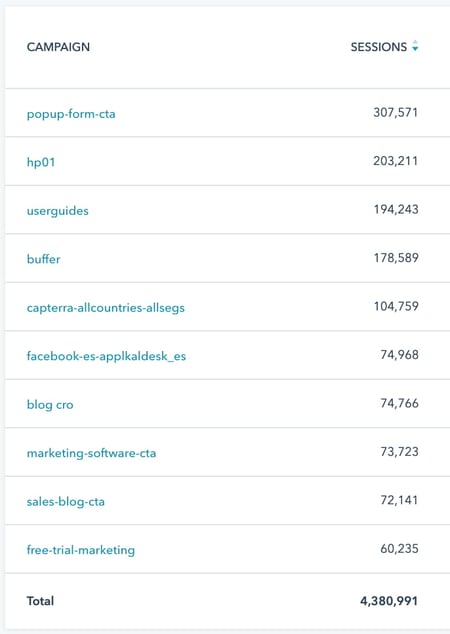
As you can see in the second image, below, the name of the campaign appears to the left — based on the text in the UTM code you created — with the traffic from people who used each URL to arrive at your campaign’s main webpage.
How to Build UTM Codes in Google Analytics
1. Open Google’s Campaign URL Builder.
There are three different types of tracking tags you can create in Google, two of which help you track traffic to new apps on app marketplaces. You’ll be using the Google Analytics Campaign URL Builder — the third option on this list.
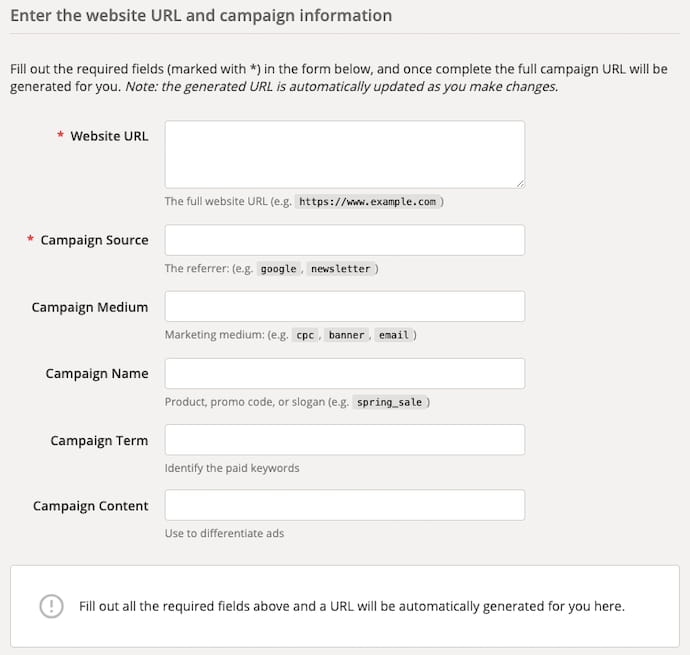
2. Fill in each link attribute in the following form.
Visit the page linked above and click the the link to see to this URL builder. Then, you’ll see the UTM builder shown below. Add the URL, Campaign, Source, and Medium information into their respective boxes.
3. Use the link in your marketing campaign.
If you’d like to shorten it, you’ll need a tool like bit.ly … or just use HubSpot’s URL Builder if you’re a HubSpot customer.
4. Measure your success.
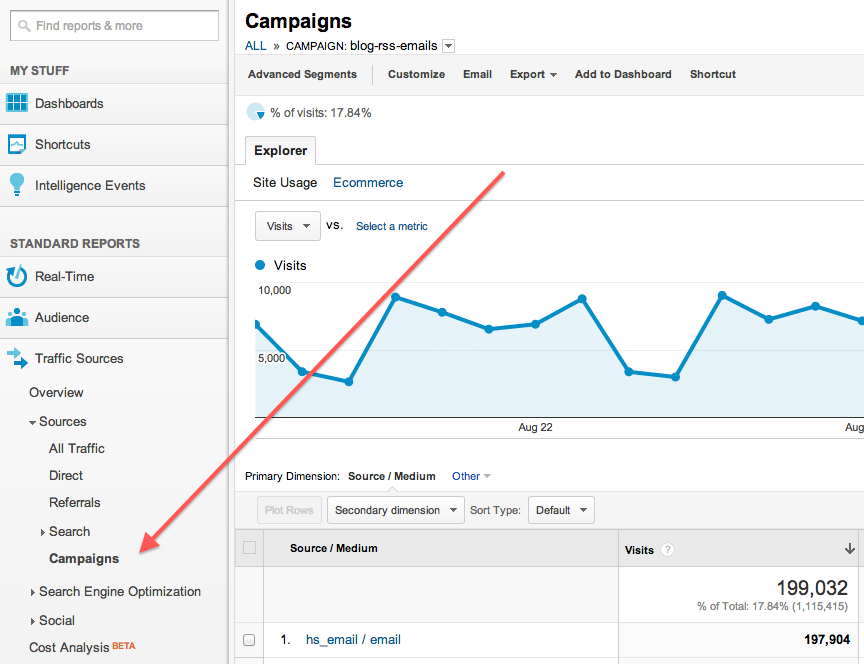
If you already have Google Analytics set up for your site, Google will automatically track incoming campaigns. Like in HubSpot, you can access them under “Audience,” then “Sources,” then “Campaigns.” Click on each campaign to view the source and medium.
And that’s it — you’ll have custom tracking codes set up and running in no time! In a few weeks, you’ll be able to make a case for what you need because you’ll have the right metrics available.


The 13 Best WordPress Live Chat Plugins in 2019
Let’s be honest. No one wants to send a support email only to receive a (possibly automated) response 48 hours later. Similarly, no one wants to be put on hold for 30+ minutes while being told they’re the next caller in line. We live in a world of instant gratification. Your customers are busy and they want to speak to you on their own terms.
Live chat can provide a more immediate, personalized support system for your customers and prospects, even when you aren’t personally there to answer immediately.
Whether you use it for customer service or to close sales, live chat gives your customers the real-time interaction they crave, boosts your conversion rates, and improves customer satisfaction.
But with a fairly crowded live chat tool landscape, it can be difficult to know which tool should you select. In this article, we’ll take a look at 13 of the best WordPress live chat plugins to consider.
Best WordPress Live Chat Plugins
- HubSpot All-In-One Marketing
- SnapEngage
- Tawk.To Live Chat
- Zendesk Chat
- Pure Chat
- Drift
- Tidio Live Chat
- LiveChat
- Olark
- Live Chat by Formilla
- WP Live Chat Support
- Facebook Chat for WordPress
- Casengo Live Chat Support
1. HubSpot All-In-One Marketing
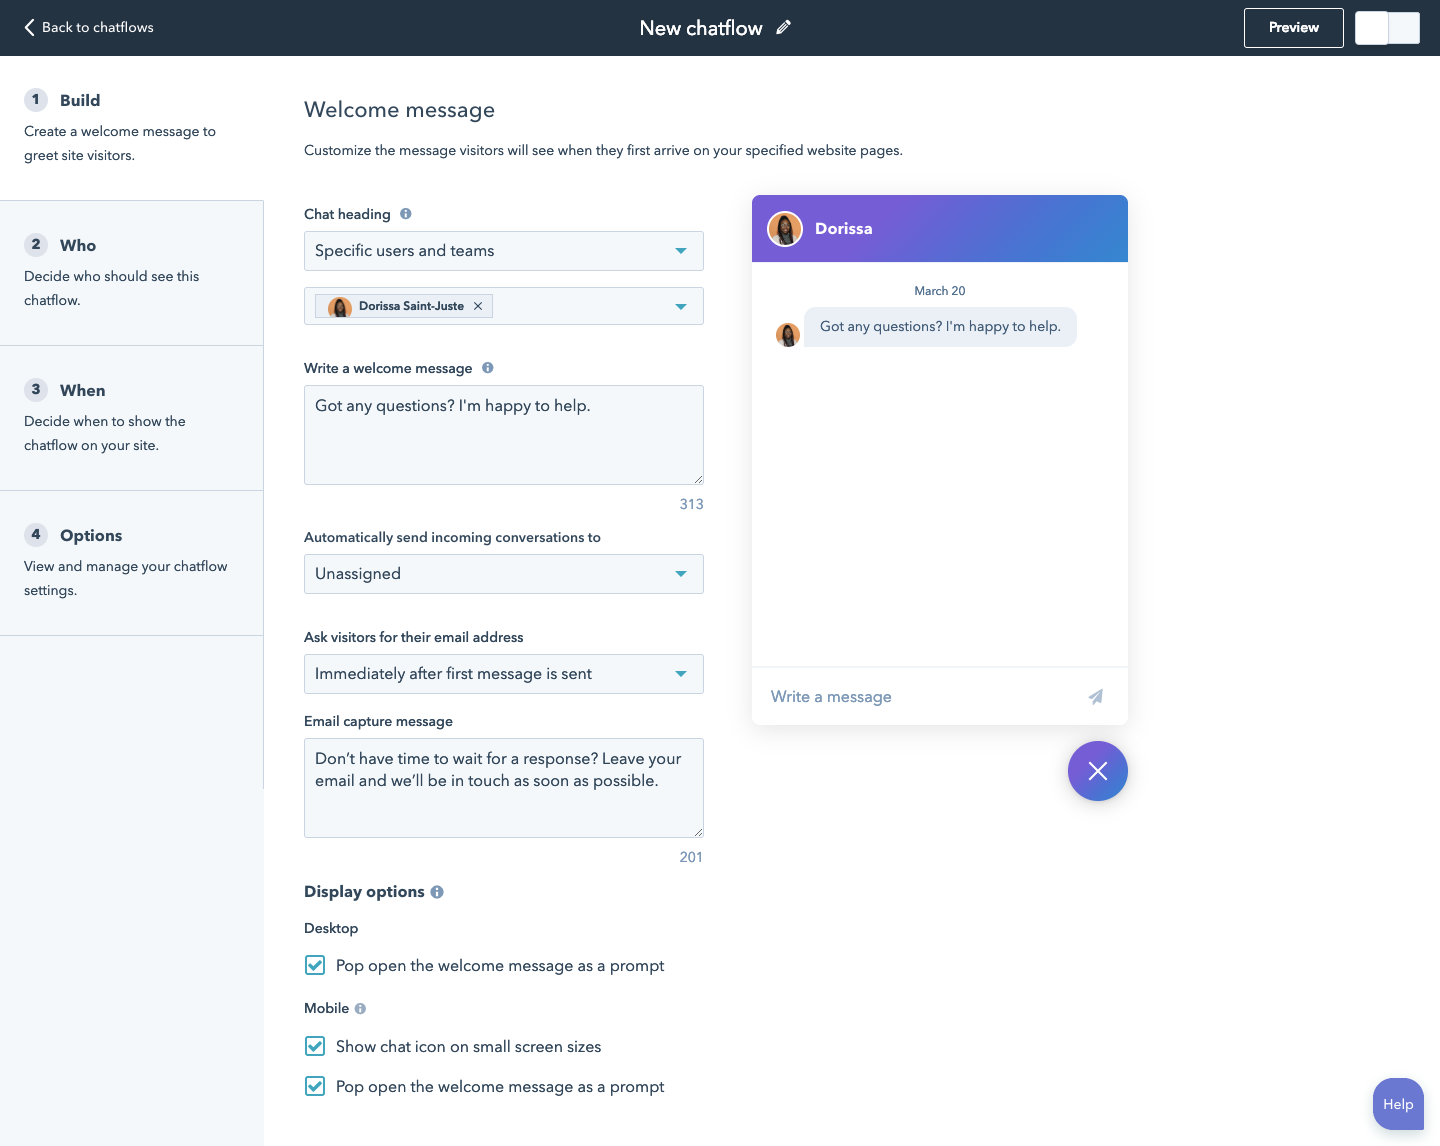
HubSpot’s All-In-One Marketing plugin offers various marketing tools for your website, including live chat.
HubSpot’s live chat tool lets you set up targeted messages for different pages or segments of your audience. If no one can respond immediately, you can enable an email capture form so your visitors can still get in touch. You can also set up a chatbot to personalize your conversations at scale.
Because it’s built on top of the free HubSpot CRM, you’ll know exactly who you’re chatting with and what pages they viewed on your website, be it a prospect, long time customer, or new contact. This makes for an excellent customer experience. You can take notes, send emails, make calls, schedule follow-up tasks, and create support tickets in one place, making following up an absolute breeze for your team
If you’re on the move a lot, HubSpot’s mobile CRM app lets you respond to chats on the go.
Pricing:
Live Chat is included with the Free HubSpot CRM. However, you can upgrade to a paid account to get access to more advanced functionalities such as if/then workflows and transferring chats to different team members.
2. SnapEngage
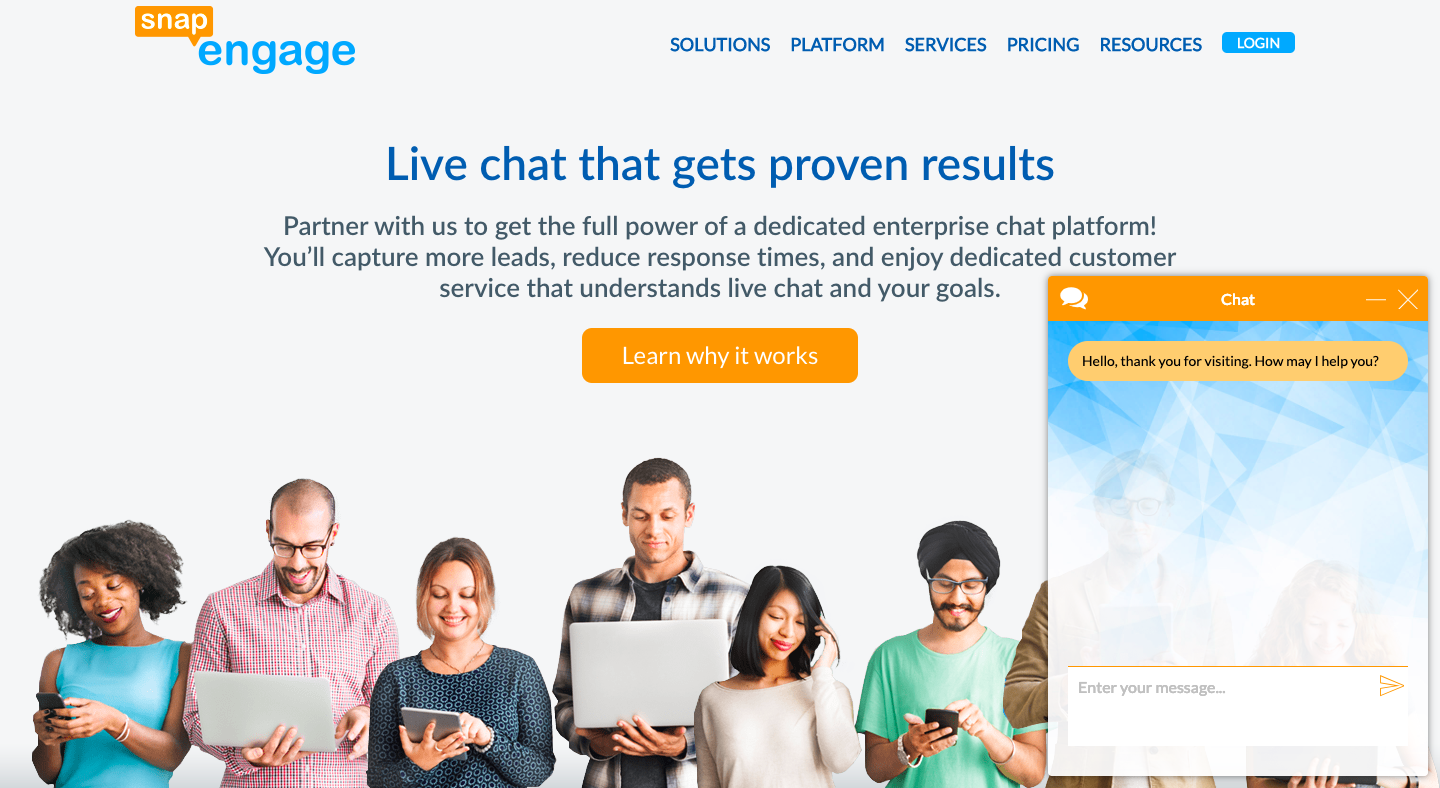
SnapEngage is an omni-channel chat, meaning you can interact with your prospects and customers wherever they are, whether that is Facebook, Twitter, WeChat, or Zalo. Visitors can reach you via text message thanks to the SMS-to-Chat feature.
This tool also lets you see what your visitors are typing before they hit send, which allows for quicker responses. Users can also have one of your agents call them via the “Call Me” feature.
Pricing:
Plans start at $16 per user/month, with a minimum of 3 users. They also offer a free 7-day trial.
3. Tawk.To Live Chat
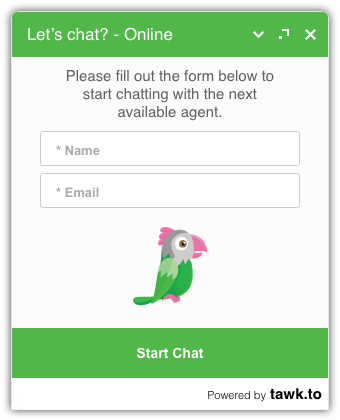
Tawk.To is completely free, so you get all the features without having to pay. Rather than charging for the live chat tool itself, Tawk.To provides a service so you can hire their agents to respond to chats on your behalf.
This plugin offers a lot of features that normally come with a paid account with other products, such as automated triggers, canned responses for common questions, and file uploads.
You also get unlimited agents and active chats, ticketing, as well as integrations with translation plugins so you can chat with your visitors in their language of choice.
Pricing:
The plugin is free. You can purchase an add-on for $15 per month to remove the Tawk.To branding and you can hire their agents for $1 per hour.
4. Zendesk Chat
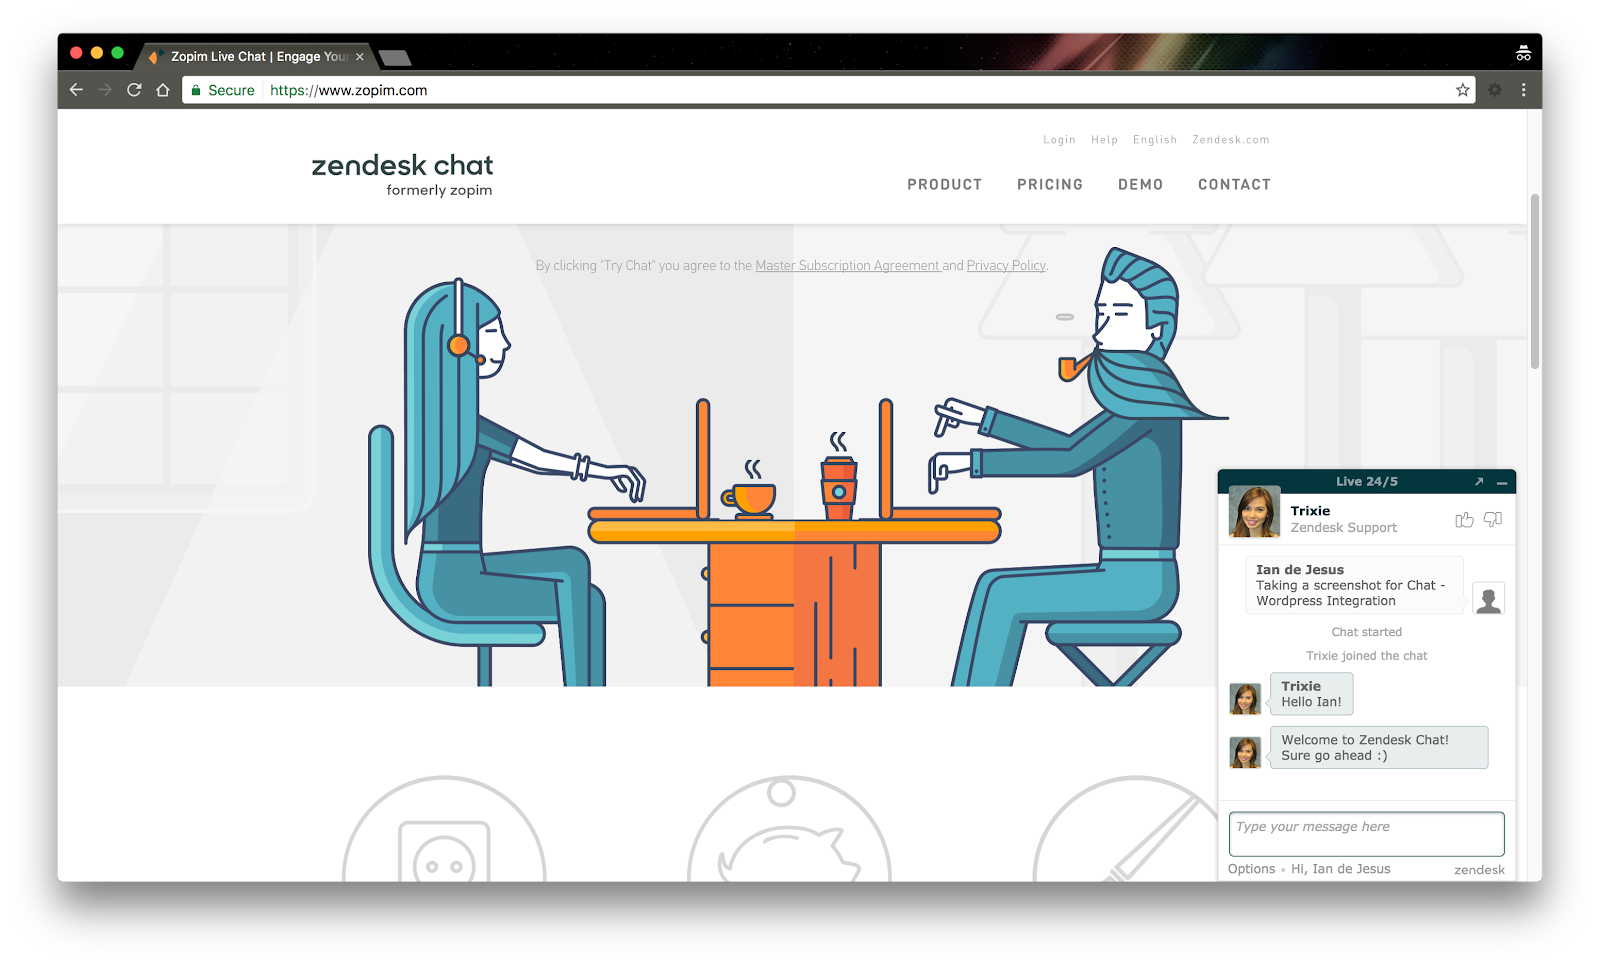
Zendesk Chat offers beautiful, stylish customizable layouts and themes for your chat boxes.
Zendesk Chat lets you track your chat performance via powerful analytics and customer satisfaction data. You also get access to many chat triggers. For example, if a visitor is stuck on a page for longer than a minute, your chat window will pop up with an automated greeting, making it easier to engage with your prospects. You also get an AI bot to automate the process when your chat is offline.
Pricing:
For the most basic functionality, you can get started with the Lite plan for free. For larger teams, premium plans start at $14 per user/month.
5. Pure Chat
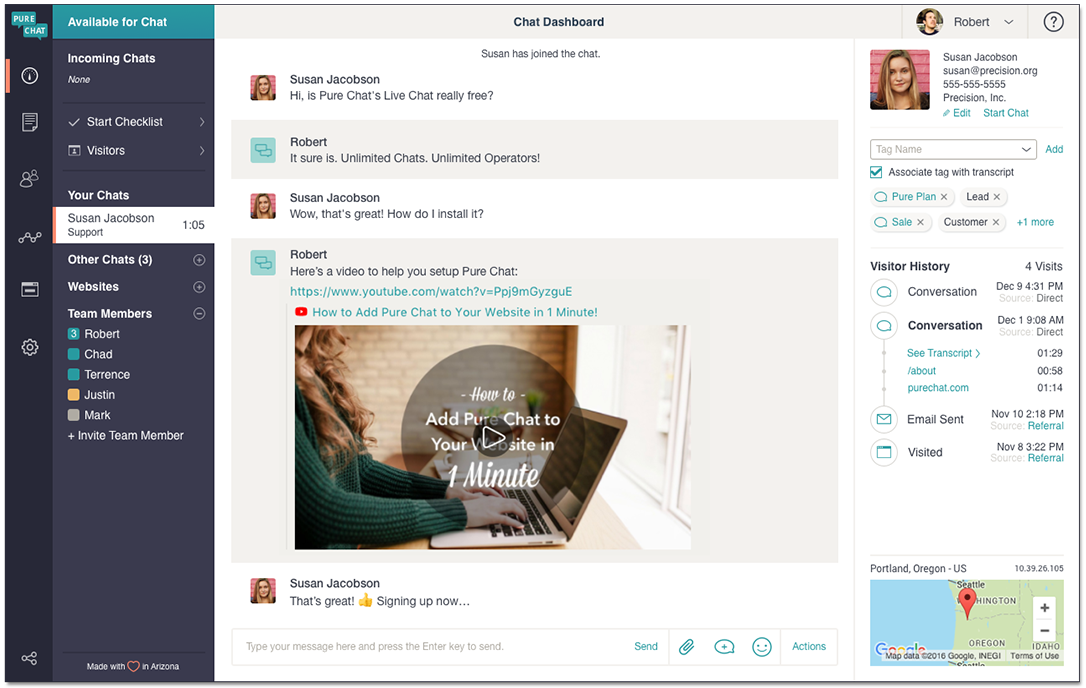
Pure Chat has a super friendly user interface. You can customize your chat box with an endless range of colors, animations, and custom images. Its proactive chat triggers allow you to automatically start the conversation with your visitors and target them based on the pages they’ve viewed or the amount of time spent on them.
The Engagement Hub lets visitors choose from several contact options — live chat, email, phone, Twitter, etc. You can also set canned responses for frequent questions.
Pricing:
The free version includes three users and grants you access to full customization, the Engagement Hub, and unlimited chat history. Upgrades start at $39/month.
6. Drift
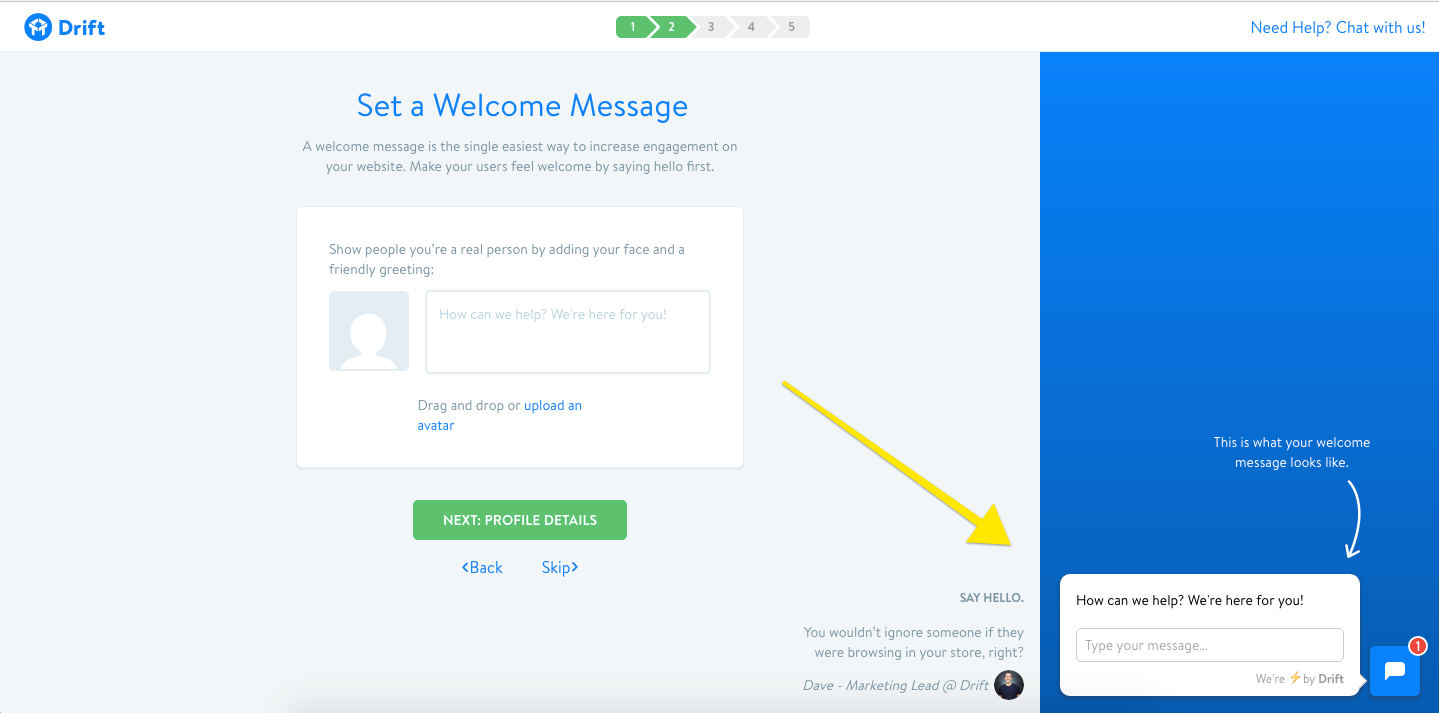
Drift is a popular option if your goal is to engage with prospects to close a sale, rather than offer customer support.
Target users and initiate the conversation based on specific actions they’ve taken. For example, you can set an automatic greeting when a user has visited your pricing page multiple times. And when your chat is offline, prospects can send you an email so you don’t miss out on those leads.
Other features include automated sales sequences, account-based marketing, and an AI-powered bot for when you’re too busy to reply.
Drift comes with a dedicated iOS and Android app so that you can manage your chats from your phone.
Pricing:
The free plan is ideal for the most basic chat capabilities. For the more advanced features, paid plans start at $50/month.
7. Tidio Live Chat
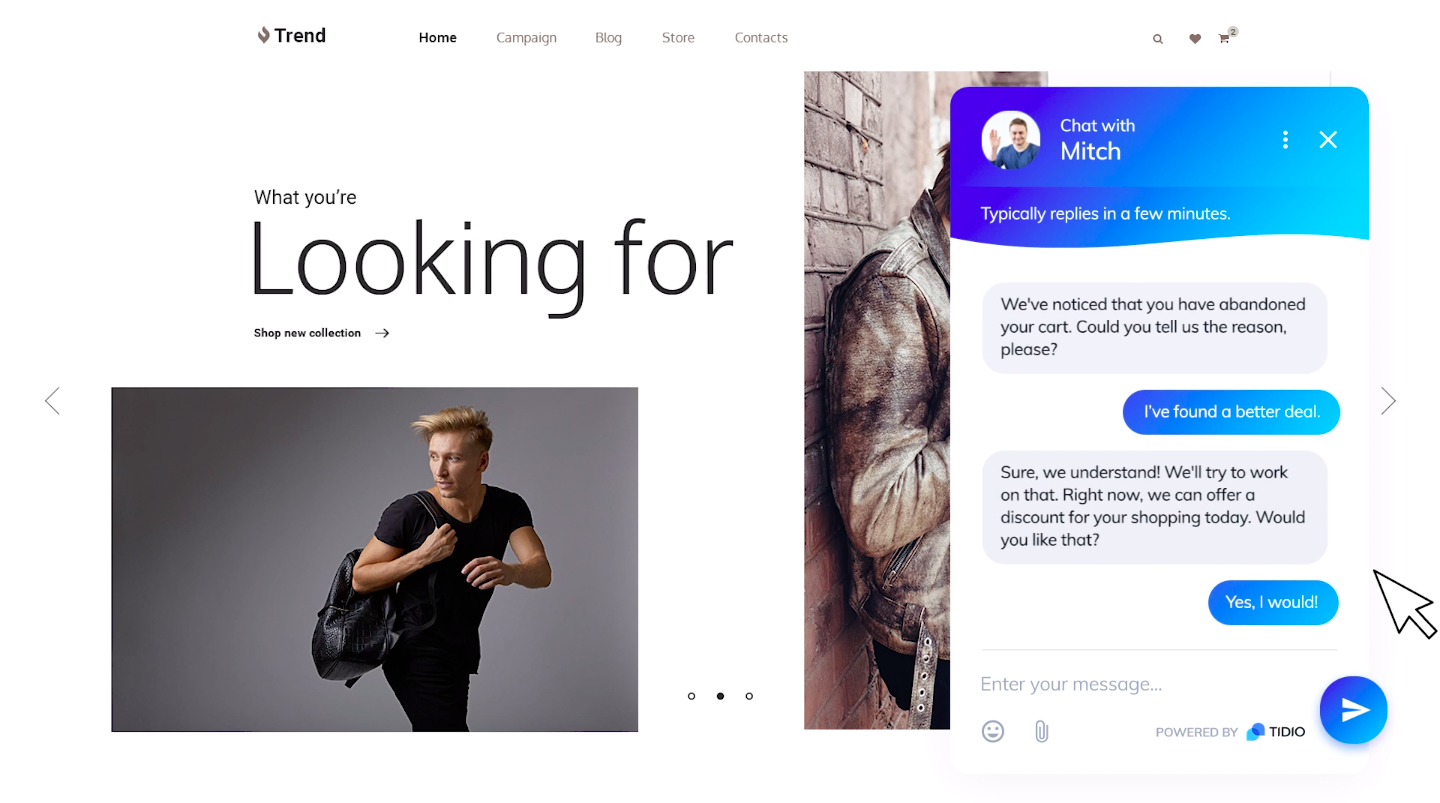
Tidio’s live chat plugin is easy to set up. Simply activate the plugin and your chat box is live. Choose from a range of three different designs and customize the colors to fit your branding. On top of managing your live chats, you can also manage your emails and Facebook Messenger responses in the same interface.
Tidio gives you the ability to improve your team’s efficiency with the use of automatic messages and chatbots. And when a visitor leaves the chat, you can continue the conversation via email.
If a lot of your visitors are non-English speakers, you won’t need to look for a translation plugin as Tidio supports many languages so you can talk to your visitors in the language of their choice.
Pricing:
Start free with up to three users and gain access to key features like email and Messenger integration and unlimited tracking. For more functionality, upgrades start at $15/month.
8. LiveChat
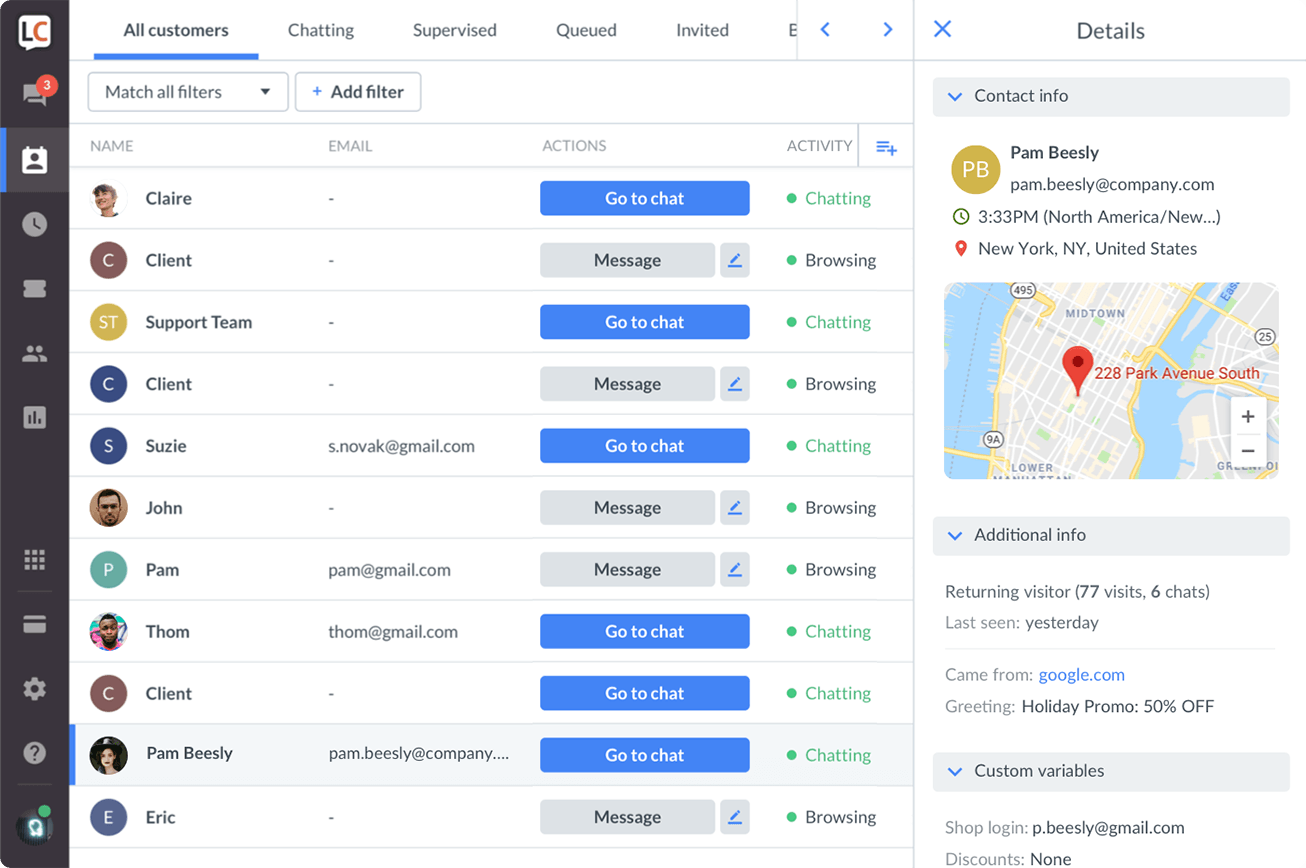
LiveChat is one of the most veteran players in the WordPress live chat space. It has a very high focus on customer service and support.
Add surveys before or after your chat to collect user feedback and have visitors rate their agent so to improve your customer service. This plugin also lets your visitors submit support tickets during your offline hours. On top of initiating conversations and automatic greetings,you can transfer chats to other agents, set up canned responses, share files, and see what your users are typing in real time.
Pricing:
You can try out this product with a 30-day free trial. After that, you will need to select a plan, starting at $16 per user/month.
9. Olark
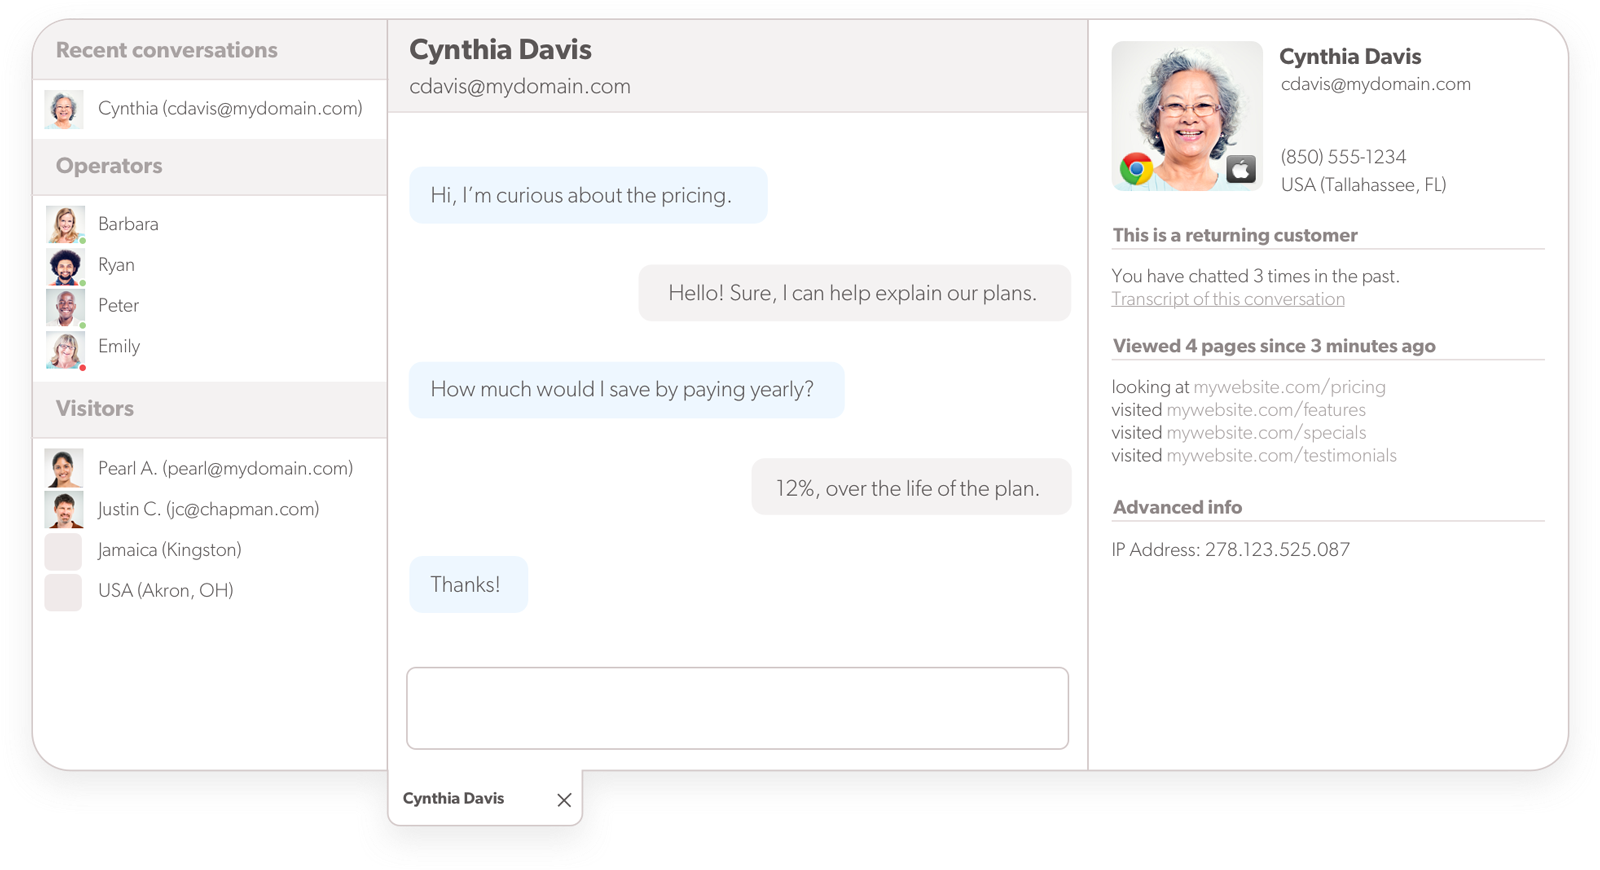
Olark easily integrates with your WordPress website through a simple copy/paste code snippet.
This product offers data reports, measuring chat frequency, operator responsiveness, and customer satisfaction. It lets you assign chats to specific departments and even group operators by team (for example, sales team or support team) for easier management.
Olark offers many common features like automatic messages, but a differentiating attribute is that it lets you view visitor data, including what items the visitor has in their shopping cart, to allow you to give faster and more informed responses.
Pricing:
There is no free version for this product (though you do get a two-week free trial). Plans start at $17 per agent/month.
10. Live Chat by Formilla
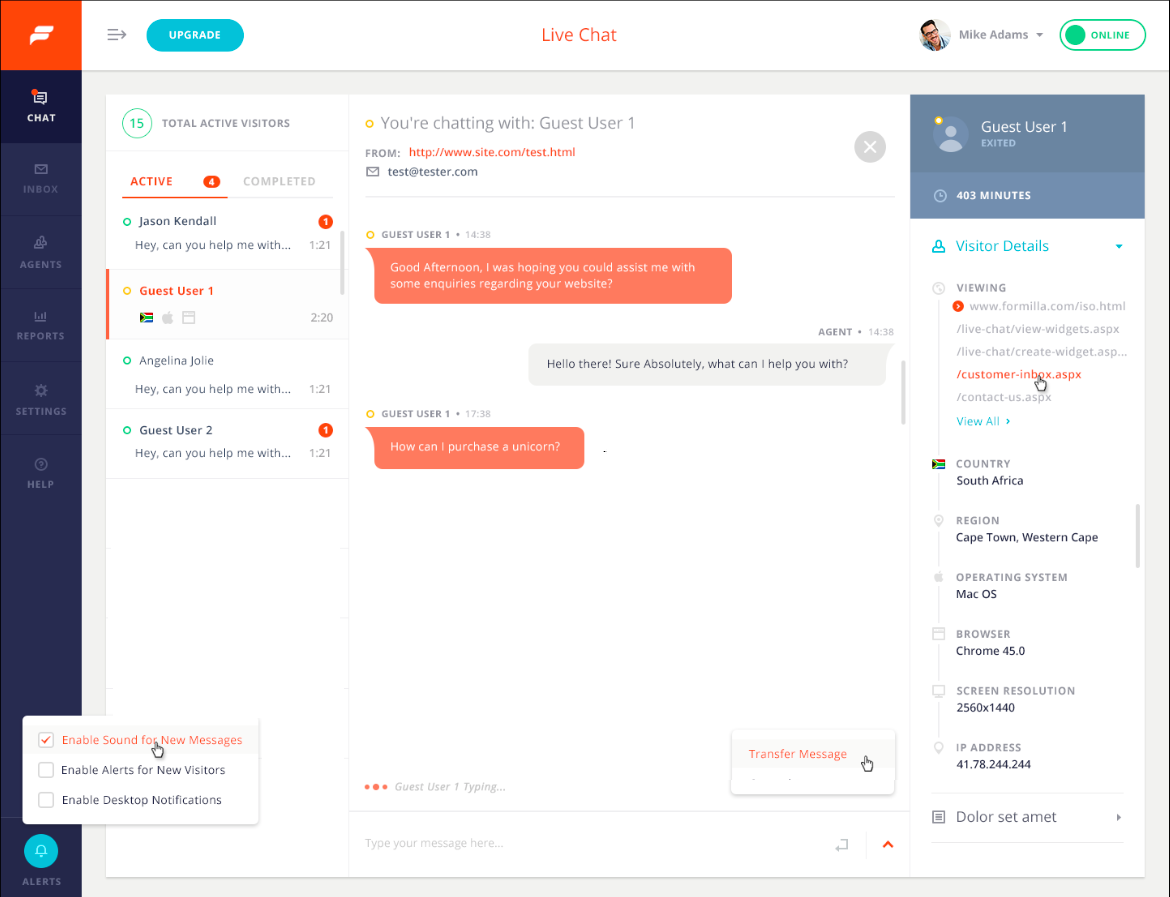
This live chat tool starts you off with a free version which lets you install your chat box on one website but with only one agent. If you’re looking for a chat that can handle high user volumes, you will most likely need to upgrade, as the free version only lets you have 30 chats per month.
The paid plans give you access to dedicated mobile apps for both iOS and Android so you can reply to users straight from your phone. You get real-time visitor monitoring, chat queues for when operators are busy handling other queries, and an autoresponder to collect contact details.
Stay organized by prioritizing your chats, assigning tickets, and transferring them over to other agents when needed. You can also set up an email form for when your chat is offline. As most other plugins in this list, you get canned responses and have the option to initiate the conversation with your prospect. You also get multilingual support, so no need to install an additional plugin for that.
Pricing:
You can get started with the free plan, but for more functionality, premium plans start at $11.99 per user/month.
11. WP Live Chat Support

WP Live Chat Support comes with six pre-defined chat box skins, which can be further customized and lets you manage everything directly from your WordPress dashboard.
With WP Live Chat Support, you get unlimited free chats, user targeting, as well as surveys and polls to collect user feedback before and after a chat. For a one-time fee, you can upgrade and get access to more features like real-time typing, proactive chats, analytics, and canned responses.
Pricing:
WP Live Chat Support is free, but you can pay a one-off fee of $49.95 for additional features.
12. Facebook Chat for WordPress
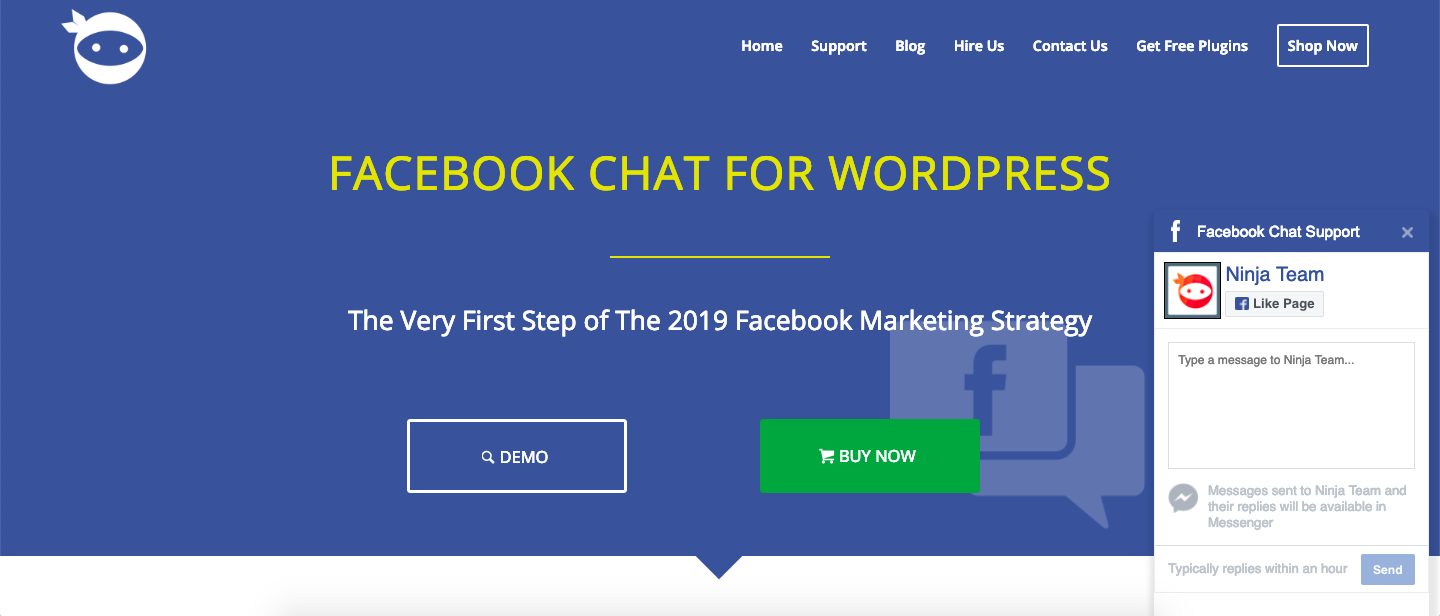
If your website or business is hugely reliant on social media, this plugin might just be the solution you’re looking for. Facebook Live Chat Plugin for WordPress lets you bring the Facebook live chat features over to your WordPress website so that your users can conveniently reach out to you using their Facebook contact information. You can customize the colors, so you won’t be limited to using the classic Facebook blue color.
This plugin gives you user profiles and has a Facebook “like” button to boost your social media following.
Pricing:
You can purchase a regular license for $25, which gives you six months of support from NinjaTeam.
13. Casengo Live Chat Support
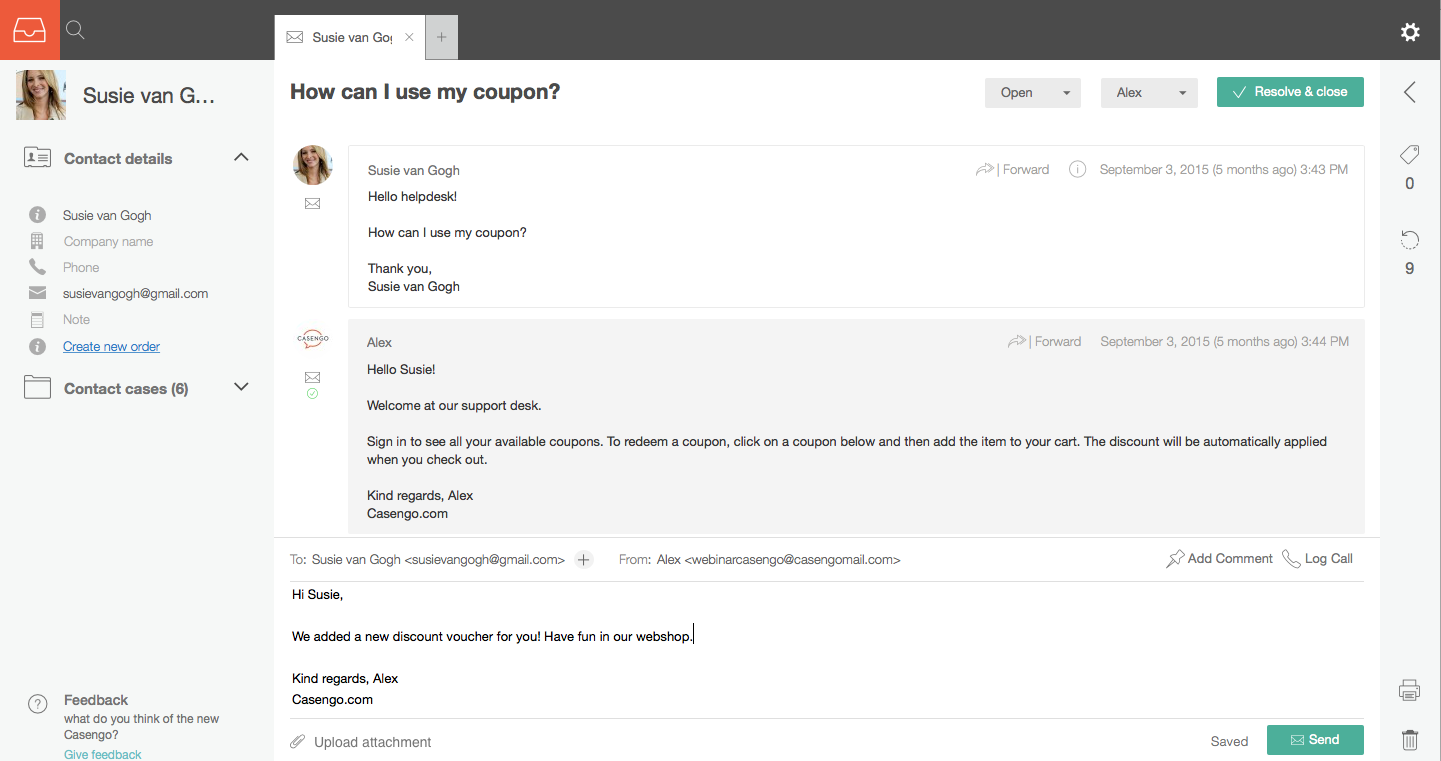
Last but not least, Casengo easily integrates with Facebook, Twitter, and WhatsApp so you can meet your users where they are. You can create your own knowledge base, a feature similar to canned responses, for your team to look up answers when replying to customers.
Stay aware of which customers are still waiting for an answer with intuitive case management tags and stay on top of your performance with analytic reports measuring your total resolved cases and average handle time.
Pricing:
You can get started with a 14-day trial before moving on to paid plans, which start at €29 per user/month (that’s approximately $33 USD).
The live chat plugin you choose will largely depend on your company needs.
If you’re looking for a quick and easy way to connect with your leads and build better relationships with your customers, check out HubSpot’s free WordPress plugin.
With HubSpot, all your chats are automatically stored in a universal inbox enriched with data from HubSpot’s free CRM, providing everyone on your team with the context they need to craft the perfect responses.

The 14 Best Autoresponder Software in 2019 (Plus Free Autoresponders)
Nowadays, email marketing is an integral component of any marketing strategy. In fact, 59% of marketers say email is their biggest source of ROI.
When it comes to email marketing, the autoresponder sequence is a commonly used but often under-appreciated part of the process.
Autoresponders are a way to dip your toes into email automation. They’re typically the simplest form of marketing automation to execute when setting up your campaigns — but, when done well, they can be incredibly powerful for bringing in additional customers and revenue.
Here, we’ll cover what autoresponders are, and which autoresponder software solutions you might consider implementing for your own business.

What is an autoresponder?
An autoresponder is a time-based email or message that you send out automatically after a visitor signs up for your email list. Depending on your autoresponder tool’s capabilities, you can further segment your autoresponder emails based on other contact properties, but at its core, an autoresponder allows you to passively and automatically send pre-written messages.
You can choose the number of messages that appear in an autoresponder sequence, and you can choose when they’re delivered. For instance, some autoresponder sequences only have one follow-up message, which is sometimes just a “Thank you” message for subscribing to the email list:
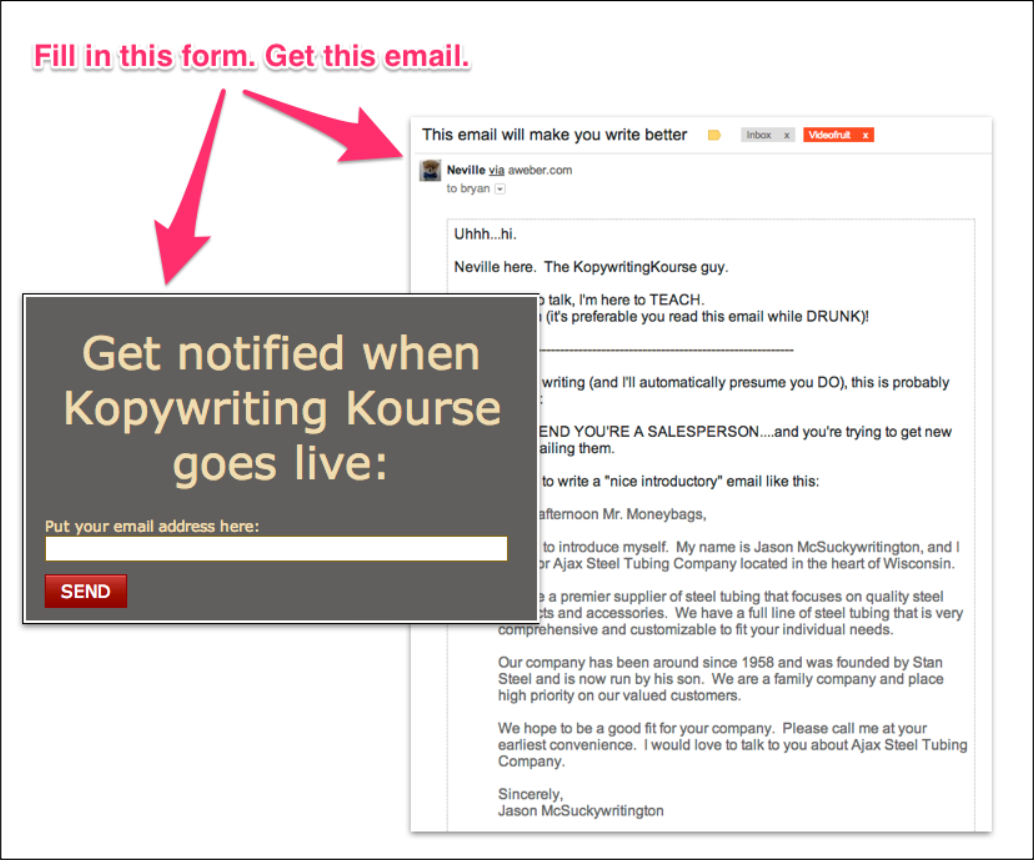
In other cases, the autoresponder can be quite robust, and deliver a series of on-boarding emails that escalate in persuasion, sometimes culminating in a sales pitch. This is typical in digital industries, where your email list is the primary sales channel to launch your products.
For example, Ramit Sethi starts his autoresponder sequence with a friendly and informational email message:
Over the course of several emails, the reader will eventually receive a sales pitch (or a few email sales pitches). This allows the reader to warm up to your brand, and your content. By the time you’re offering your product or service, you should’ve already provided a ton of informational value, like this:

Sometimes, an autoresponder can act as the actual lead magnet used to get someone to sign up for your list. A good example of this is gated email courses.
CXL, for instance, uses a gated “enterprise conversion optimization” email course to get people to sign up for their list. The deliverable is just a time-based sequence of email lessons — in other words, an autoresponder.

While the execution can be quite different depending on your business, your industry, and your goals, all autoresponders allow you to automate email sequences based on timing and email sign-up form.
Next, let’s dive into some of the best solutions on the market.
The Best 8 Autoresponder Software
- HubSpot
- GetResponse
- Aweber
- Klaviyo
- Mailchimp
- ConvertKit
- Autopilot
- Constant Contact
1. HubSpot
HubSpot offers one of the most powerful autoresponder capabilities on the market. Particularly if you’re using other tools in HubSpot’s Marketing Hub, such as our form builder and popup forms, you can easily set up auto-response emails upon form submission.
At a high level, there are two ways to send an email response to contacts who submit a form on your page:
- Set up a follow-up email in the form options on your HubSpot page
- Send an automated email through a workflow (Marketing Hub Professional and Enterprise only)
For the former option, it’s quite a simple setup. You simply set up a follow-up email to be delivered upon form submission (full instructions here).
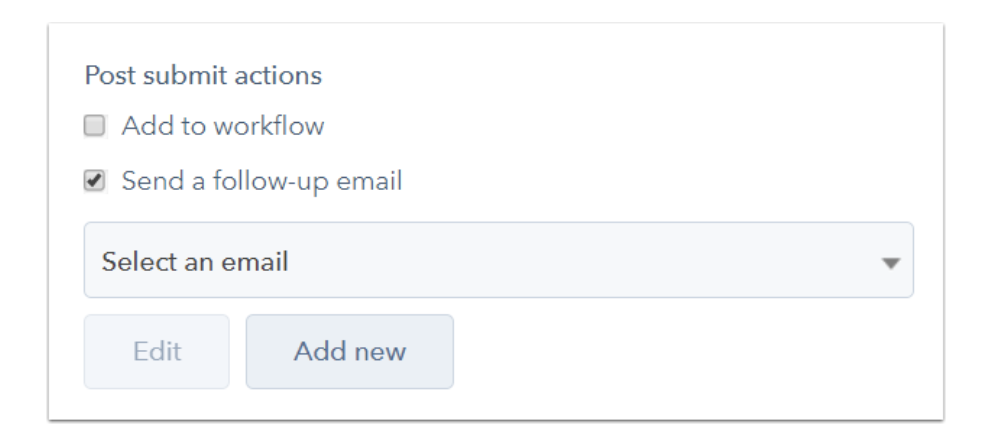
However, through HubSpot’s workflows you can get quite robust with your targeting and follow-up email assignment. For instance, you can break things down by contact property data you’ve collected, like company size or which service the subscriber is interested in. This allows you to tailor your follow-up emails to ensure they’re more helpful and personalized for the user.
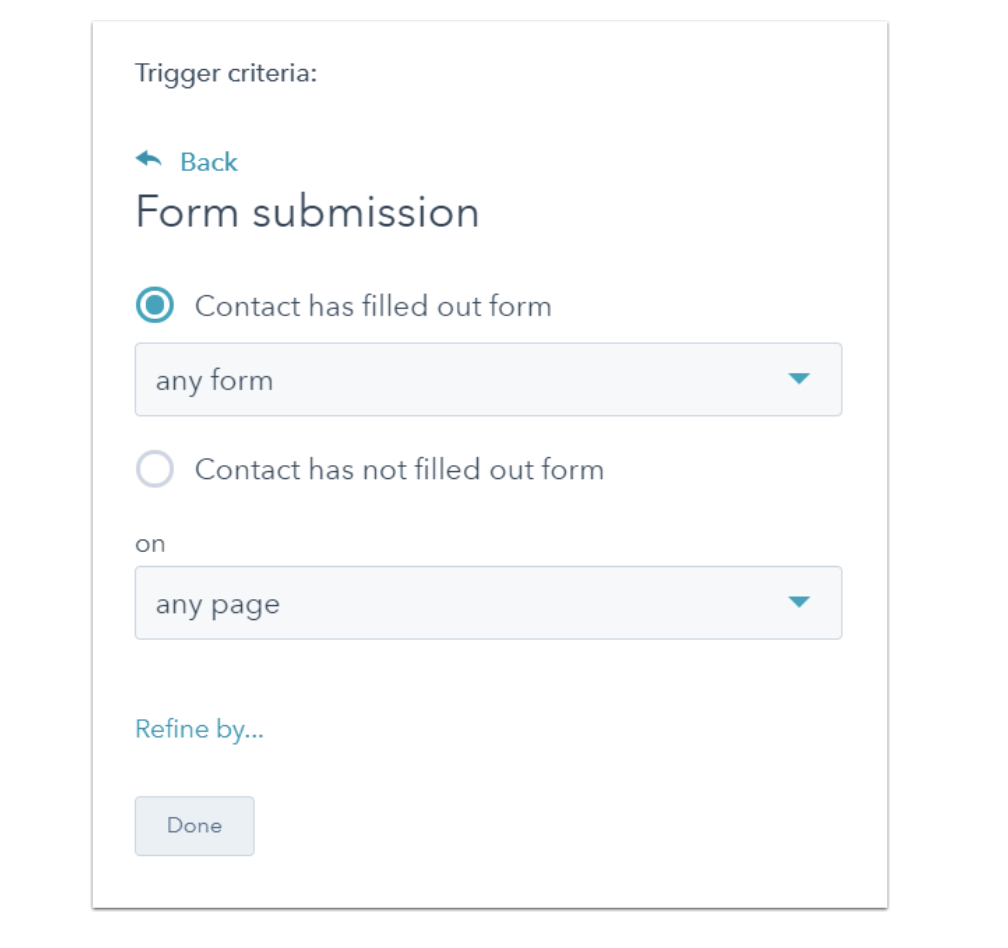
In addition, you can set a sequence of several autoresponder emails, and can also include behaviorally triggered messages — the options are pretty much endless.
If you’re just using HubSpot’s form builder, you can still easily integrate with another autoresponder solution in this list to get a simple setup working.
2. GetResponse
GetResponse is a full-suite marketing platform that offers tools including landing pages, webinars, and forms, but their most powerful tool is likely their email automation functionality.
Like others in this list, GetResponse can trigger emails based on multiple criteria, such as behavioral triggers, contact property triggers, and time-based triggers (i.e. autoresponders).
Their autoresponder feature is actually quite flexible. You can build email follow-up sequences with the following features:
- Unlimited messages per day
- Advanced timing control
- Simple cycle management
- Day-of-the-week selection
- Drag-and-drop message management
- Quick message edits
Sometimes I’ve found the usability of GetResponse to feel complicated when trying to do advanced automation, but building time-based autoresponders is incredibly simple to accomplish.
It depends on your list size and requisite features, but GetResponse pricing starts around $10 per month (which includes basic autoresponders, and a list size of 1,000).

3. Aweber
Aweber built one of the first well-known autoresponder softwares, and it’s still widely used and loved.
Aweber is a bit more expensive to start out ($19 per month for up to 500 subscribers), but the tool gives you all the critical features you need to implement an impressive autoresponder email system. This includes segmenting, analytics, sign-up forms, templates, and even stock photos.
If you want a straightforward solution for a relatively small email list (anything over 25,000 emails gets quite a bit pricier), Aweber is a good solution.

4. Klaviyo
Klaviyo is well-known and loved in the e-commerce world, and they have some of the coolest email automation features, particularly for behaviorally triggered emails.
With Klaviyo, you can trigger an autoresponder email sequence for basically any event you can measure (as long as you have the contact’s email address). This opens up all kinds of possibilities, such as abandoned cart emails, thank you emails after a purchase, customer satisfaction surveys after a time window after a purchase, and cross-sell emails given a certain item purchased.
It’s important to note, Klaviyo is built for e-commerce, so it’s relatively stock built for things such as abandoned cart emails. If you’re in e-commerce this is a plus, but in other industries, the feature set can be a bit complicated for what you want to accomplish.
Of course, if you just want to build a simple four-email sequence after an email list sign up, it’s easy enough to do.
Klaviyo offers a free tier (up to 250 email addresses). Once you hit that threshold, it starts at $25 per month and goes up quickly from there (for instance, it’s around $1000/month for 78,000 contacts).

5. Mailchimp
Mailchimp is one of the world’s most popular email marketing tools, and they have a great (albeit simple) autoresponder functionality.
I like two things about Mailchimp:
- It’s simple to use.
- It’s free to start.
For those two reasons, the barrier to entry is incredibly low. So, for businesses with fewer than one thousand email addresses, it’s a good solution.
However, I’ve found that, as you scale and your automation becomes more complicated, Mailchimp becomes a bit too difficult to manage. It’s hard to know which email is going to whom, and when.
Again, you can begin for free, but after that the cost starts at $20 per month.
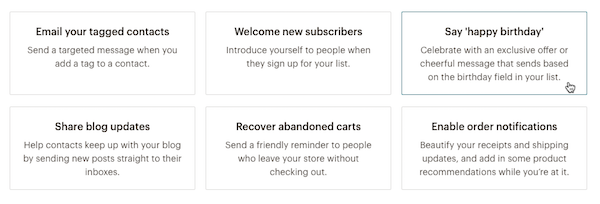
6. ConvertKit
ConvertKit is an email marketing platform built for creators (i.e. bloggers, podcasters, designers, etc.). It’s incredibly useful for marketers who focus on inbound marketing.
ConvertKit platform’s is simple and easy to use, although it does include other features to help build your inbound marketing program — including forms, analytics, and their newer automation feature set.
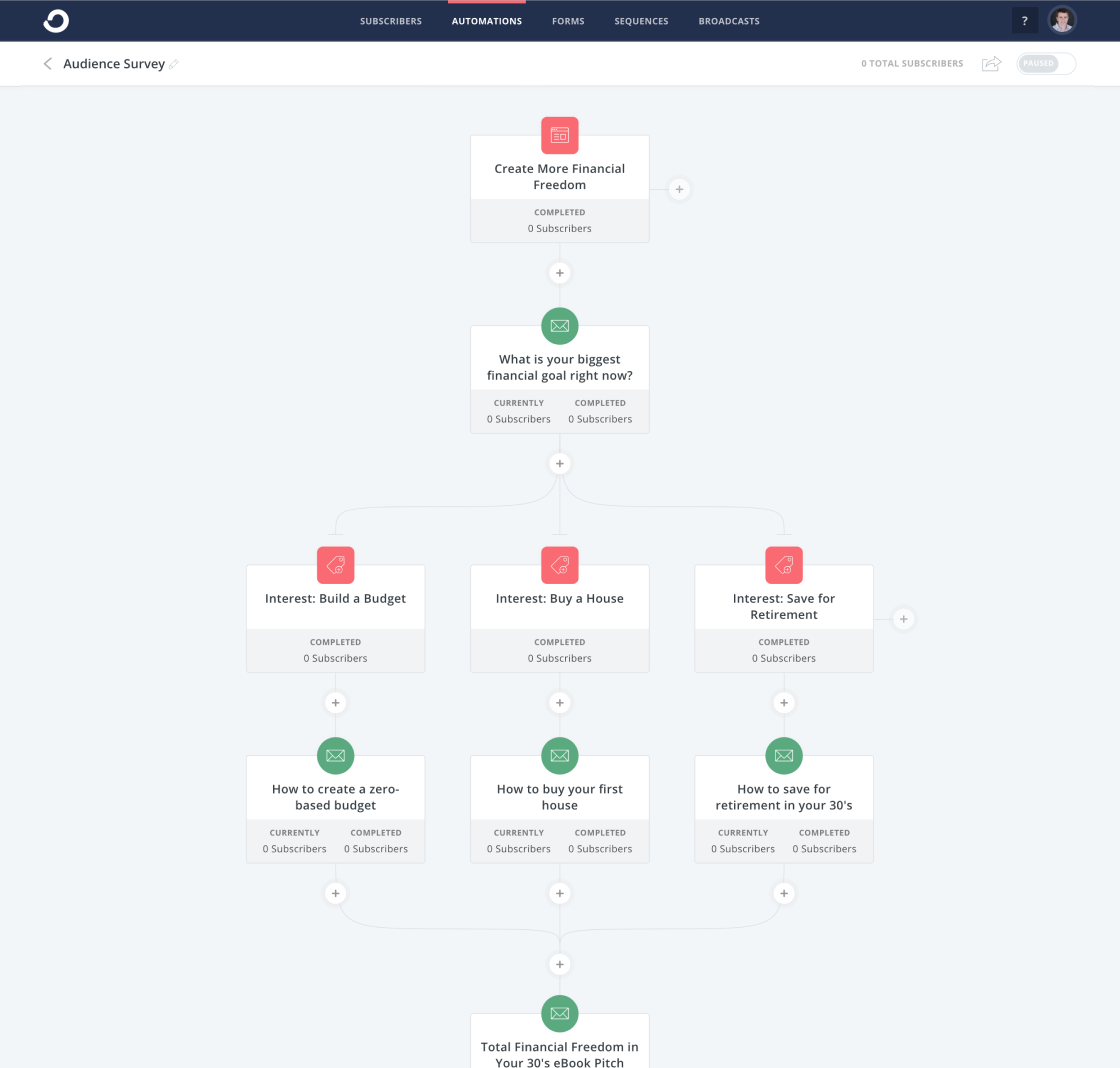
Pricing starts at $29 per month and that tier goes up to 1,000 email subscribers.
7. Autopilot
Autopilot is an email marketing, messaging, and automation platform that has billed itself as the easiest marketing automation platform to use. They have a visual editor that is quite clear and easy to understand (even without being a master automation nerd).
Of course, their platform allows for quite sophisticated messaging and targeting, although you can surely create a simple autoresponder based on a time-sequence as well.
Pricing starts at one dollar per month for up to 500 contacts, and then begins at $25 per month for more than 500 contacts. They include a 30-day free trial, as well.

8. Constant Contact
Constant Contact is a simple, easy to use, and popular email marketing tool. It includes basic features, such as templates, list building tools, a drag-and-drop editor, and autoresponder sequences.

It’s been a few years since I’ve used Constant Contact, but it’s the platform on which I initially learned email marketing. I enjoyed it somewhat, but found it to be frustrating when trying to edit templates, and also for any advanced email targeting. Although it may have changed, I think Constant Contact is best for relatively simple cases.
Their most basic package starts at $20 per month, which goes up to 500 contacts.
The 6 Best Free Autoresponder Software Tools
Some of the tools listed above have free or incredibly cheap plans, such as Klaviyo and Autopilot ($1 per month). However, if you’re looking for a full list of the best free autoresponders that offer incredible value, we’d recommend the following six.
Best Free Email Autoresponders
Ultimately, choosing the best autoresponder is difficult. It’s not as straightforward as asking, “How much does this cost?” or “What features does this tool have?”
Instead, it’s also about asking, “Which autoresponder software is best for my particular business?”
This question leads you to reflect on what your current tech setup is (which CRM you use, for instance), and how you plan on growing and using marketing automation in the months and years to come.
For what it’s worth, HubSpot has an affordable introductory plan and we’ve structured our email automation plans to help you grow. So you can expect powerful and simple-to-use features at the startup level, and then as you grow, our autoresponders will still support you, even at the enterprise level.

The Simplified Guide to Google’s RankBrain Algorithm
Not long ago, if you wanted to find a place to eat, you needed to search for a term like “Boston restaurants”. But, today, you can instantly find a good restaurant that’s nearby if you just search for the term, “Where should I go for dinner?”
That’s because Google is sophisticated enough to recognize your intent or the implications of your query. However, prior to 2015, you needed to type rather straightforward queries into the search engine to find the answers you were looking for.
So how did Google evolve to understand their searchers’ intent and implications so quickly? Well on October 26, 2015, they confirmed that they updated their algorithm with a machine-learning artificial intelligence system called RankBrain.
What Is Google’s RankBrain Algorithm and How Does It Work?
RankBrain is a core part of Google’s search algorithm. By leveraging machine learning, it helps Google understand how specific web pages relate to certain concepts and, in turn, serve web pages that are relevant to a searcher’s query but don’t include the query’s exact words or phrases.
In other words, RankBrain helps Google understand a searcher’s intent and serve the most relevant content to them. To accurately determine a searcher’s intent, Google feeds RankBrain a massive amount of data. Then, RankBrain analyzes it and teaches itself how to serve the most relevant results based off certain search signals, like search history, device, and location.
For example, if you type the query “Where should I go for dinner?” into Google, the search engine will first pinpoint your location and detect the device you’re using. Then, it’ll use these factors to interpret your query’s intent, which Google will translate to “Which restaurants are currently open for dinner within walking distance of my current location?”, helping it serve the most relevant results to you.
Another example of RankBrain’s capabilities is how it analyzes your past search history to serve you relevant content. For instance, since I work at HubSpot and I’m always on our website, every time I search for marketing related topics, Google usually ranks content from HubSpot’s marketing blog near the top of my search results.
How SEOs Can Adapt to RankBrain
Even though RankBrain helps Google adapt to changing search behavior, most marketers still haven’t adapted their SEO strategy to this transformation.
“One of the main reasons we keep drilling our audience with the idea of topics over keywords is that search has evolved but our customer’s content marketing strategies are lagging behind,” says Victor Pan, HubSpot’s Head of Technical SEO. “Practices like purposely creating pages with misspellings and poor grammar just because there is search volume need to go.”
Today, people rely heavily on Google to provide accurate and relevant answers for most of their questions, so the search engine needs to understand the intent and context behind every single search.
To do this, Google has evolved to recognize topical connections across users’ queries, look back at similar queries that users have searched for in the past, and surface the content that best answers them. As a result, Google will deliver content that they deem the most authoritative on the topic.
To help Google recognize your brand as a trusted authority, consider implementing the pillar-cluster model on your blog. Using this strategy, you’ll create a single pillar page that provides a high-level overview of a topic and hyperlinks to cluster pages that delve into the topic’s subtopics. This signals to Google that your pillar page is an authority on the topic.
Hyperlinking all of the cluster pages to the pillar page also spreads domain authority across the cluster, so your cluster pages get an organic boost if your pillar page ranks higher, and your cluster pages can even help your pillar page rank higher if they start ranking for the specific keyword they’re targeting.
On the editorial side of things, RankBrain has pressured content marketers to scrap a tactic that they should’ve abandoned years ago — prioritizing volume over quality. Nowadays, spending more time and effort crafting insightful and compelling content at a lower volume is one of the best ways to bolster your standing with Google.
“If you have a huge inventory of 2000-era SEO tactics, I’d highly recommend consolidating the pages that are driving zero value to your business with 301 redirects,” says Pan. “It’s not that less is more, but better is more. It’s very common for a strong piece of content to rank for over hundreds of long-tail keywords of the same intent.”
RankBrain has advanced Google’s search engine to the point where people can interact with it like they’re chatting with their friends — and it’s time for content marketers to catch up.
If you apply the lessons learned above to your SEO strategy, though, you could adapt faster to RankBrain than Google’s search algorithm evolved after they implemented RankBrain.

The 30-60-90 Day Plan: Your Guide for Mastering a New Job [Template + Example]
With all the joy and excitement of landing a new job, you can feel just as much fear and anxiety. The same can go for the hiring manager.
Overcoming a new role’s learning curve and the desire to make a lasting impression on your employer can put a lot of pressure on you. What if you can’t adapt in time?
Fortunately, there’s a way to organize and prioritize your time and tasks, helping you seamlessly adapt to your new environment. It’s called a 30-60-90 day plan. And following it enables you to soak in as much information as possible, master your core job responsibilities, and sets you up to make a lasting impact on your new team.

Think of a 30-60-90 day plan as a new employee’s North Star, keeping your sights set in the right direction and guiding you toward success. But before we show you how to write this plan, let’s go over what exactly it is and how it’ll enhance your performance during your (or your employee’s) first three months on the job.
30-60-90 Day Plan
A 30-60-90 day plan lays out a clear course of action for a new employee during the first 30, 60, and 90 days of their new job. By setting concrete goals and a vision for one’s abilities at each stage of the plan, you can make the transition into a new organization smooth and empowering.
There are two situations where you’d write a 30-60-90 day plan: during the final stages of an interview process and during the first week of the job itself. Here’s how each type can be executed:
30-60-90 Day Plan for Interview
Some hiring managers ask candidates to think about and explain their potential 30-60-90 day plan as a new hire. They want to see if they can organize their time, prioritize the tasks they’d likely take on, and strategize an approach to the job description.
For a new hire, a well thought-out 30-60-90 day plan is a great way to help the hiring manager visualize you in the role and differentiate yourself from all other candidates.
Of course, it can be difficult to outline your goals for yourself before you accept a new job. So, how are you supposed to know what those goals are? Start with the job description. Normally, open job listings have separate sections for a job’s responsibilities and a job’s qualifications. Work to find commonalities in these two sections, and how you might turn them into goals for yourself staggered over the course of three months.
For example, if a job requires three years of experience in Google Analytics, and the responsibilities include tracking the company’s website performance every month, use these points to develop an action plan explaining how you’ll learn the company’s key performance metrics (first 30 days), strengthen the company’s performance in these metrics (next 30 days), and then lead the team toward a better Google Analytics strategy (last 30 days).
30-60-90 Day Plan for New Job
The second situation where you’d write a 30-60-90 day plan is during the first week of a new job. If you’re the hiring manager, this plan will allow you to learn how the new employee operates, address any of their concerns or preconceived notions about the role, and ultimately help them succeed.
If you’re starting a new job, and are not asked to craft a 30-60-90 day plan during the first week of that job, it’s still a good idea to write one for yourself. A new job can feel like a completely foreign environment during the first few months, and having a plan in place can make it feel more like home.
Even though 90 days is the standard grace period for new employees to learn the ropes, it’s also the best time to make a great first impression.
The purpose of your plan is to help you transition into your new role, but it should also be a catalyst for your career development. Instead of just guiding you over your job’s learning curve, the goals outlined in your plan should push you to perform up to your potential and raise your bar for success at its every stage.
30-60-90 Day Plan for Managers [Template]
Almost all 30-60-90 day plans consist of a learning phase, a contributing phase, and a leading phase — which we’ll go over in the example plan below. This includes plans that are designed to guide people in new management roles. What sets apart a manager’s plan from any other is their obligation to their direct reports and the decisions they’re trusted to make for the business.
If you’re accepting (or hiring for) a new manager role, consider any of the following goals and how to roll them out at a pace that sets you up for success.
Get to you know your team’s strengths and weaknesses.
Recommended phase: First 30 days
Everyone is learning the ropes in their first month at a company. For managers, much of that learning happens by talking to the team. If you’re a new manager, grab some time with your direct reports and get to know their roles. What do they like about them? What are their biggest pain points? Making your team happy is a hard goal to measure, but it’s an important responsibility to take on as a manager. Your first step is to figure out how you’ll manage and coach your employees through their day-to-day work.
Improve the cost-effectiveness of your team’s budget.
Recommended phase: Final 30 days
Managers often have access to (and control over) the budget for their department’s investments — things like software, office supplies, and new hires. After you spend the first couple of months learning what the team spends its money on, consider using the final 30 days of your plan to make suggestions for new investments or how to reallocate money where you think it needs to be. Is there a tool that can automate a task that’s taking your team forever to do manually? Draft a financial strategy that includes this tool in the following quarter’s budget.
Help a direct report acquire a new skill.
Recommended phase: Second 30 days
Even though you’re new to the company, you were hired for a reason: You’ve got skills. And you can bring these skills to the people you work with, particularly those people who report to you. After meeting with and learning about your new colleagues, you might use the second month of your on-boarding plan to find skill gaps on your team that you can help fill. Do you have expert-level experience with HubSpot, and your new company just started using HubSpot Marketing Hub? Teach them how to do something in the platform they didn’t know before.
Draft a training strategy that can help guide your direct reports into new roles.
Recommended phase: Final 30 days
You won’t be expected to promote people in the first three months of your new job, but that doesn’t mean you shouldn’t have learned enough about your team to decide who’s good at what and how to coach them to where they want to be. In the final 30 days of your 30-60-90 day plan, you might agree to a goal to develop a training strategy that outlines how to manage your direct reports, and ultimately how to guide them into new roles in the future.
How to Write a 30-60-90 Day Plan
No matter what the level of the job for which a company is hiring, improving an employee’s skills requires concrete performance goals, so watch out for vagueness in the objectives you set for yourself. “Write a better blog post,” or “get better at brainstorming” are terrific ambitions, but they don’t give you a way to measure your progress in them. Set goals that are realistic, quantifiable, and focused. You’ll know exactly how to achieve them and gauge your success.
To write challenging yet feasible performance goals, ask yourself the following questions:
What are my team’s goals?
Try to understand the purpose behind your team’s goals. It’ll give you more insight into why you and your team should achieve them, motivating you to work as hard as possible to meet those goals.
What will be my main priorities?
By connecting your personal responsibilities to your team’s goals, you’ll know exactly how to align your tasks with the needs of the team, which keeps you accountable and compels you to help your team achieve their goals.
How will I measure my progress?
Tracking your progress helps you gauge your performance and rate of improvement. To see how you’re doing, set up weekly meetings with your manager to ask her what she thinks of your work and track the improvement of your own performance metrics, like the growth of your blog posts’ average views or the amount of qualified leads your eBooks generate.
Reaching your performance goals isn’t the only path toward future success in your new role, though. You also need to study the ins and outs of your team and company, take initiative, and develop relationships with coworkers — all things that a lot of new hires underestimate the importance of.
Consider setting the following types of goals during each stage of your 30-60-90 day plan:
- Learning Goals – How will you absorb as much information as possible about your company, team, and role?
- Initiative Goals – What will you do to stand out?
- Personal Goals – How will you integrate with your company and team?
Aiming to achieve these types of goals will help you hit the ground running in all the right areas of your job. And if you stick to your plan, you’ll notice you’ll be able to spend less time learning and more time executing.
30-60-90 Day Plan Template With Examples
Behold, your 30-60-90 day plan template. Click the image below to download your own copy.
So, how might you fill in the lines shown in the template above? Here’s an example:
30 Days
Primer
Many new hires are eager to impress, so they dive head-first into their work or try to make suggestions about their team’s process with limited experience in how their new team operates. But have patience.
Understanding your company’s vision and your team’s existing strategy is crucial for producing high-quality work and actually making an impact. If you don’t know the purpose behind your role or the optimal way to perform, you’ll risk missing the mark and your early efforts won’t pay off the way you expect them to.
It’s always better to over-prepare than under-prepare. And it’s okay to take time to learn the ropes — it pays huge dividends in the long run. In the first 30 days of your employment, your priority is to be a sponge and soak in as much information as possible. Once you do that, you can then try to improve more specific parts of your team’s work style.
Theme: Be a Sponge
Learning Goals
- Study my company’s mission, vision, and overarching strategy.
- Read my company’s culture code to learn more about our company culture and why we implement it.
- Read the customer persona and target audience overview to truly understand who our customers are, their pain points, and how our product and content can help them.
- Meet with my team’s director to learn about how meeting our goals will help our business grow.
- Read up on our team’s new SEO strategy, editorial process, and traffic goals.
- Learn how to use the SEO Insights Report to plan and structure blog posts.
- Review my team’s pillar-cluster model overview and understand how to match posts to clusters.
- Meet with my manager to learn more about her expectations.
Performance Goals
- Complete new hire training and pass the test with a 90% or higher.
- Be able to write 3 blog posts per week.
Initiative Goals
- Run the Facebook Instant Article experiment that my manager recommended me to do.
Personal Goals
- Grab coffee with everyone on my team, so I can get to know them on a professional and personal level.
60 Days
Primer
By the end of your first 60 days, you should ramp up your workload, start overachieving, and make a name for yourself on your team. To do this, start speaking up more at meetings. Don’t be afraid to share your ideas about improving your team’s processes. This shows you’re quickly conquering the learning curve and recognizing some flaws that your colleagues might’ve overlooked. You still have a fresh perspective on the company, so your insight is invaluable.
Theme: Be a Contributor
Learning Goals:
- Learn how to optimize a new post from scratch based on both the SEO Insights Report and my own competitive research.
- Read every other marketing team’s wiki page to learn about other marketing initiatives and how our entire department works together to grow our business.
- Deep dive into my company’s product roadmap and strategy to fully grasp our mission and vision.
Performance Goals
- Be able to write 5 blog posts per week.
- Be down to one cycle of edits per post.
- Understand how to edit a guest post — clean up at least one rough draft.
Initiative Goals
- Share content strategy idea at my team’s monthly meeting and ask if I can spearhead the project to boost blog traffic.
- Ask my manager if I can oversee Facebook messenger and Slack distribution strategy.
Personal Goals
- Meet with my colleagues on other teams to learn about their marketing initiatives and develop relationships outside of my team.
90 Days
Primer
By the end of your first three months, you should have a firm grasp of your role, feel confident about your abilities, and be on the cusp of making a breakthrough contribution to your team. Instead of reacting to problems that pop up at random, be proactive and spearhead a new initiative for your team.
You should also be cognizant of how you can collaborate with other teams to improve your own team’s processes. By taking on some new projects outside of your main role, you’ll start turning some heads and catch the attention of the department at large.
Theme: Be a Leader
Learning Goals
- Do an analysis of my highest and lowest performing blog post up to date. How can I use this information to optimize new content so it performs better out of the gate?
Performance Goals
- Be comfortable with writing five blog posts per week
- Edit one guest post per week
- Try to have 75% of my blog posts not require revisions.
- Write at least one new post that generates over 10,000 views in one month.
Initiative Goals
- Ask SEO team if they want to partner with product marketing team to brainstorm content topics related to our product road map.
- Ask social media team if they’re willing to develop a relationship where we can share each other’s content.
- Ask sales team what our customers’ pain points are, so we can write content that our target audience craves and help them close more qualified leads.
Personal Goals
- Join the yoga club.
Learning the nuances of your new role in less than three months won’t be easy. But crafting a strong 30-60-90 day plan is your best bet for accelerating your development and adapting to your new work environment as quickly as possible.


5 Strategies for Growing Your YouTube Subscribers
In the SaaS industry, the most successful companies prioritize the retention of their existing customers over the acquisition of new customers. Why? Because SaaS companies charge a monthly subscription, so in order to turn a profit, they need their customers paying them for many months in a row. If they can’t retain their customers for X amount of months, they’ll ultimately lose money by acquiring them.
In content marketing, the same principle applies. Retaining your audience’s attention positively impacts your brand a lot more than merely acquiring attention.
When an audience engages with your content for long periods of time on a consistent basis, they can easily turn into a loyal tribe that’s passionate about your work and recommends your brand to all their friends. In other words, staying laser-focused on retaining attention is actually the best strategy for acquiring new attention because your current customers are providing so much word-of-mouth marketing — it’s like a flywheel.
On YouTube, you retain attention by attracting subscribers to your channel. Subscribers are your most loyal fans and made a public commitment to your brand, content, and values. They’re also most likely to be fervent brand evangelists.
In regard to benefiting your YouTube channel, subscribers are crucial because YouTube will send them notifications about your new videos and feature your videos on their homepage. This means they’ll see your videos more frequently, which will help you generate more engagement.
Subscribers also watch twice as much video as non-subscribers, so the more subscribers you have, the more watch time your videos will accumulate, and the more likely YouTube will rank them higher on search and feature them in the related section.
Additionally, YouTube keeps track of the number of viewers who subscribe to your channel right after watching one of your videos. So if one of your videos generates a lot of new subscribers, they’ll reward it with higher rankings and more features in the related section.
To help you grow your YouTube subscription, we’ve fleshed out five strategies that will help you retain attention on the video platform — and not just acquire it.
5 Strategies for Growing Your YouTube Subscribers
1. Craft content that’s worth subscribing to.
Today, we work in an industry where a lot of people prioritize gaming the system over crafting the best content possible. Fortunately, in regard to their algorithm, YouTube has caught on to this hollow tactic. Their algorithm only rewards engagement instead of vanity metrics like views and clicks, so creators are incentivized to produce videos that they’re audience actually enjoys watching.
To craft the most engaging videos for your YouTube channel, consider measuring your videos’ performance against engagement metrics, like watch time, average watch percentage, average view duration, audience retention, and average session duration. Then, analyze this data to figure out which topics and videos generate the most engagement. Once you pinpoint these videos, you can solely focus on creating the content that viewers are most likely to engage with, helping you rake in more subscribers.
2. Order your playlists by engagement.
Placing your videos in playlists is an extremely effective way to organize your videos in a digestible fashion. They help your viewers easily consume videos about their favorite topics and prompts them to keep watching your content.
One way to get your viewers to watch the majority of your playlists is by starting your playlists with the videos that have the highest audience retention rate and ending them with the videos that have the lowest audience retention rate.
Even better, you could create a bingeable series or show and place entire seasons of it in a playlist. And just like your favorite Netflix show, your playlists can entice your viewers to watch entire seasons of your series, subscribe to your channel, and get more excited for your show’s next season than they currently are for Stranger Things 3.
3. Add a subscription CTA at the end of your videos.
It seems obvious, but adding a subscription CTA to the end of your videos is one of the best ways to generate more YouTube subscribers. After your viewers watch your entire video, they’ll determine if they want to keep watching more of your videos, so to maximize your subscriber growth using CTAs, consider keeping them at the end.
If you need an example of an engaging subscription CTA, check out Business Insider’s below. They do a great job of driving YouTube subscriptions by featuring their CTA during their videos’ last 15 seconds, giving users ample time to subscribe.

4. Optimize your videos for relevant keywords.
To attract subscribers to your YouTube channel, you first need to be able to get found on YouTube. To start ranking on YouTube, consider optimizing your videos and channel for popular search queries by placing relevant keywords in your videos’ titles, tags, descriptions, SRT files (which are transcriptions), video files, and thumbnail files.
You should also check out the most popular queries guiding viewers to your videos, which you can find on YouTube’s Search Report. If these queries are slightly different than your video’s topic, consider updating your video to fill these content gaps and adding these keywords to your metadata. If there’s a stark difference between your topics and the queries guiding viewers to your videos, consider making brand new videos about these popular queries.
5. Create vibrant thumbnails.
Another factor that can affect your search ranking on YouTube, and in turn, your subscriber growth are your videos’ thumbnails. Since a video’s click-through rate is one of the most important ranking factors in YouTube’s search algorithm, especially during its first hour on the platform, an eye-catching thumbnail can make a huge difference in ranking number one for a query and not ranking at all.
If your video has an ordinary or sub-par thumbnail, though, it won’t persuade anyone to click through, prompting YouTube to deem the video irrelevant and decide not to rank it in their search results or distribute it through the “Recommended Videos” feed.
To create a striking thumbnail, consider including a talking head. People are naturally drawn to human faces because it’s an ingrained survival mechanism to help us quickly gauge someone’s emotions and determine if they’re a friend or foe. Also, consider contrasting the colors of your thumbnail’s foreground and background to really make it pop.

Retain your audience’s attention, don’t just acquire it.
Similar to the best SaaS companies, the top YouTube channels focus on building a subscriber base that can’t get enough of their videos and watches them on a consistent basis. Retaining attention has always been imperative to successful content marketing. Now, it’s time we actually prioritize it over acquiring as many darting eyeballs as possible.
