8 Essential Budget Templates for Marketers [Free Download]
Let’s face it: Executing a successful marketing plan requires time, energy, and money.
And with so many different facets of marketing to consider — branding and creative, product marketing, hosting events, etc. — your marketing budget can disappear real fast.
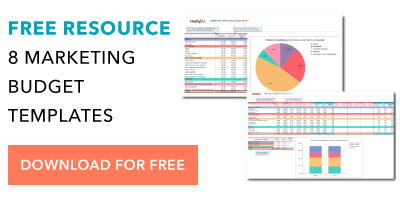
Ever found yourself scratching your head with a depleted budget at the end of the month, quarter, or year? Ready to leave behind the days of ambiguous spending and vanishing budgets? Well, we have the perfect resource for you: 8 Budget Templates to Manage Your Marketing Spend.
These helpful templates make it easy to manage all of the moving pieces of your budget at a monthly and quarterly level.
With a separate Excel file for each team to keep track of their spending, as well as a “master” template for collecting all the totals, creating a high-level view of your marketing expenses is a breeze.
The templates can be used to track your expenses in the following areas:
- Branding & Creative
- Content
- Events
- Paid Advertising
- Project Marketing
- Public Relations
- Website Redesign
Does your team favor the Cloud over Microsoft Office? We’ve still got you covered. You can try the Google Sheets version of the same eight templates to share access with other Gmail users and keep your budget in one place.
Check out our 8 Budget Templates to Manage Your Marketing Spend for access to both the Excel and Google Sheets templates.


Your Twitter Following Is About to Drop. Here’s Why.
Twitter announced today the latest of its effort to fight platform abuse and maintain authenticity on its network.
This week, wrote Legal, Policy and Trust & Safety Lead Vijaya Gadde in a statement, Twitter will begin removing locked accounts from users’ total follower counts, potentially causing these numbers to drop significantly for some.
You should be confident that the follower numbers presented across Twitter are meaningful and accurate. We’re introducing a change to follower counts as part of our work to make Twitter a more trusted service for public conversation. https://t.co/A2ZEGHjOZ8
— Vijaya Gadde (@vijaya)
July 11, 2018
An account becomes “locked” when Twitter detects some sort of sudden suspicious activity from it, like tweeting a high number of out-of-context mentions or several links to false content.
In these cases, Gadde explains, the network lets the account owner know about the activity, and requests that it be revalidated with a new password. Until that happens, the account remains locked and the owner is unable to log in.
Now, these accounts will be removed from total follower displays for all users globally.
The majority of users, says Gadde, will lose a maximum of four followers — but those with a significantly higher following, like celebrities or major verified brands, might see a major reduction in these numbers.
These changes will take effect over “the next few days,” writes Gadde — starting as early as this Thursday, according to the New York Times.
The announcement comes after a recent report from the Washington Post that Twitter is suspending roughly one million suspicious accounts each day since about May.
Twitter’s stock price fell the business day after the story ran, but since rebounded — and has held steady in the hours following today’s announcement.

Source: Google
Most of this recent activity from Twitter — from its sweeping removal of suspicious accounts to removing locked ones from total follower numbers — are part of its ongoing efforts to improve the “health” of the social network.
In March, Twitter posted an official request for proposals from the public to conduct a comprehensive study of the social network’s ability to maintain, as CEO Jack Dorsey put it, “collective health, openness, and civility of public conversation.”
Along with such other Big Tech counterparts as Facebook and Google, Twitter has come under fire for not only failing to sufficiently fight platform abuse — but also, for allowing the network to be weaponized by foreign actors with the spread of false and divisive content to influence the 2016 U.S. presidential election.
Some public figures have been especially outspoken about their dissatisfaction with Twitter’s response to this ongoing crisis of communication — and according to our own survey data, skepticism of the company’s ability to truly resolve these issues is somewhat widespread.
 Data collected using Lucid
If and how this latest move from Twitter will have a significant, lasting impact on the network’s health remains to be seen — but as for its impact on users, some are likely to experience more setbacks than others.
“Follower counts have always been a controversial metric,” says HubSpot VP of Marketing Jon Dick, “but it’s the main way marketers assess the reach and influence of someone on social media.”
“Follower counts have always been a controversial metric.”
– HubSpot VP of Marketing Jon Dick
“The people who will be most impacted are the ‘influencers’ who have tried to buy their way to the top,” Dick explains, who might see more of a drop in follower counts than those with a more authentic Twitter audience.
“Many influencers have built genuine audiences through high quality content, and they shouldn’t have much to worry about,” he continues. “The rest … watch out.”

Unriddled: New Ads on Facebook (This Time in AR), YouTube’s Fight Against Fake News, and More Tech News You Need
Welcome one, welcome all to another Wednesday: the day that marks the halfway point — almost — to the weekend.
As the summer continues to progress and the days are hot and sunny, we know there isn’t a ton of time to spend on pouring over news. So, in keeping with tradition — we’ll keep this week’s “Unriddled” quick.
It’s our Wednesday tech news roundup, and we’re breaking it down.
Unriddled: The Tech News You Need
1. Facebook Is Testing Ads in AR
Wouldn’t it be nice if — upon seeing a picture of an outfit, accessory, or pair of shoes you like online — you could see what it might look like on you, without having to try it on? Now, Facebook is testing ads that allow users to do just that.

Source: TechCrunch
At F8, the company’s annual developer conference, both augmented and virtual reality (AR and VR) took center stage, with Facebook promoting its various products and features within both. That’ll soon be extended to ad partnerships with a handful of brands — including Michael Kors and Sephora, for example — that allow users to “try on” different products through AR. Anthony Ha of TechCrunch has more. Read full story >>
2. YouTube’s New Fight Against Fake News
Following the spring launch of the Google News Initiative, YouTube (which is owned by Google) has announced new efforts to curb less authentic video content — e.g., that concerning conspiracy theories — and promote high-quality journalism. The video-streaming giant says it will do so in part with a $25 million investment to build partnerships with such media companies as Vox, as well as filling new support roles to help news publishers better leverage the platform. Read full statement >>
3. Groupon Is Seeking an Acquirer
Daily deal site Groupon is looking to be acquired. According to Recode, the company has been courting public companies to gauge interest — and pay up. Groupon went public in 2011, when it was valued at $16 million — now, that number has dropped to $2.4 million. Read full story >>
4. Sonos Files for an IPO
Sonos, which among competition from Google and Amazon has made something of a name for itself within the smart speaker market — filed for an initial public offering last week. The audio electronics company will be listed on the Nasdaq Global Select Market as “SONO,” and according to both The Verge and SEC filings, is in a strong financial position to do so. At the end of Q1 2018, Sonos said it sold 19 million products in about 6.9 million households globally, and at an average rate of three speakers per customer. Read full story >>
5. Scooter-Sharing Is a Big Deal, but No One’s Heard of It
Following announcements of Uber’s major investment in electric scooter-sharing company Lime, it’s clear that this “trend” is becoming more than that. And, this isn’t the first of the attention its earned from folks in Silicon Valley, including venture capitalists. But our research shows nearly two-thirds of people haven’t heard of it. How will this latest transportation trend go mainstream? Read full story >>
6. Twitter’s Sweeping Account Suspensions
The week did not start out well for Twitter, who was the subject of a report from The Washington Post on its massive account suspensions, which are recently averaging in the millions. But even with the social media company making a point of promoting its efforts to curb platform abuse, our survey data says over a third of users are skeptical. Read full story >>
That’s all for today. Until next week, feel free to weigh in on Twitter to ask us your tech news questions, or to let us know what kind of events and topics you’d like us to cover.
Featured image credit: Facebook

The Dunning Kruger Effect: Why Your Coworkers Believe They’re Way Smarter Than They Actually Are
If you’ve ever been a manager, you know how frustrating the Dunning Kruger effect can be.
Let’s say you work at a software company, and you need to give Karen, your newest software developer, a performance review. Karen’s exceptionally good at developing code, but she lacks a few critical programming skills. That’s okay — you recognized this skill gap before hiring her, and set up training sessions for this reason.
But when you mention Karen’s programming skill gap to her, her reaction baffles you: “What are you talking about? I’m exceptionally skilled at programming. I don’t need training — in fact, I’m one of the best programmers on your team.”
You’re surprised. Not only is Karen unable to recognize her weakness, but she overestimates her skill in comparison to others, believing herself to be better than some of your best developers. Her lack of knowledge on the subject makes her unable to see her own errors — this is known as the Dunning Kruger effect.
Dunning Kruger Effect
The Dunning Kruger Effect is a pyschological phenomenon in which people of the lowest ability in a subject rate themselves as most competent, compared to others. Ironically, people who lack the most knowledge on a topic also lack the ability to recognize their own mistakes and errors, making them exceptionally confident and biased self-evaluators. They are also unable to fairly judge other people’s performance.
The Dunning Kruger effect, first coined by David Dunning and Justin Kruger in 1999, is a cognitive bias that influences everyone’s perception of their own abilities. Simply put, people are unreliable resources for evaluating their own skills and shortcomings.
However, the Dunning Kruger effect gets slightly more complex than that. People like Karen, with the lowest levels of competency in a subject, often rate themselves highest in terms of expertise. Dunning and Kruger explain this as a double-curse — Karen makes mistakes because she’s not competent in a skill, but that same incompetency blinds her from seeing any errors in her work. In short, she’s not skilled enough in a particular area to see she’s not the best at it. She also misjudges other people’s abilities, assuming she knows more than most of her colleagues.
Meanwhile, true experts often underrate themselves — they’re so knowledgable on the subject, they can see how much they don’t know.
Here, we’ll dive into a few key research findings to exemplify this effect in-action. We’ll also explore a few potential solutions, so you can help any Karens — or any other colleagues on your team who suffer from the Dunning Kruger effect — fairly judge her performance moving forward.
Dunning Kruger Effect Examples
There have been numerous research studies over the years to support the notion that people misjudge their own adequacy — and, that the poorest performers are least accurate about their own skills. Let’s look at three examples now.
Example One: Debate Skills
Ehrlinger et al.’s 2008 study examined students in a collegiate debate tournament. As you might’ve guessed, students performing in the lowest 25% grossly overestimated their skills — they guessed they’d won almost 60% of their matches. In fact, they’d won about 22% of them.
The lowest performers weren’t simply overcompensating for a lack of skill, or boosting their confidence to hide their insecurities. Instead, they were genuinely unaware of their incompetence — the debaters performing in the lowest 25% had the least knowledge of debating, so they were unable to accurately judge their own performance. They weren’t biased judges. They were simply uninformed ones.
The results from this study translates to plenty of real-world examples. If you’ve extensively studied marketing, you might be shocked to hear how your colleague mis-evaluates the results from your company’s new marketing campaign. He might take a look at the staggeringly-low numbers and say, “Looks good to me,” simply because he doesn’t have the skillset to understand how to read SEO analytics — and, without that skillset at all, he believes himself to be above-average.
Example Two: Logical Reasoning Skills
In 1999, Dunning and Kruger published their initial research on the Dunning Kruger effect, called, “Unskilled and unaware of it: how difficulties in recognizing one’s own incompetence lead to inflated self-assessments.” To conduct their research, they looked at people’s self-perceptions in regards to humor, logical reasoning, and grammar.
In particular, we’ll look at study two, which focuses on logical reasoning. In the study, 45 Cornell University undergraduates were asked to complete a 20-item logical reasoning test. They were then asked to evaluate their ability and test performance — first, by providing a “general logical reasoning ability” percentile ranking compared to classmates, and second, by providing an estimated test score compared to classmates. They were also asked to guess how many test scores they got correct.
As theorized, the students in the lowest 12th percentile estimated their “general logical reasoning ability” fell closer to the 68th percentile in the class, and believed their test scores fell at the 62nd percentile. They also thought they’d answered 14.2 problems correctly (on average), when in reality, their mean score was 9.6.
Ultimately, the lowest scorers believed themselves to be above-average performers. On the flip side, the top 86th percentile students drastically underestimated themselves, estimating their general ability fell almost 20 points below, around the 68th percentile.
Have you ever heard someone really good at public speaking sigh and say, “That went terribly”? They probably aren’t just acting humble — if they’re a true expert, they likely underestimate their performance in comparison to those around them.
Example Three: Emotional Intelligence
In our prior examples, we’ve seen how the Dunning Kruger effect influences a person’s perception of their logical skills — but what about other aspects of a person’s personality, like emotional intelligence?
Sheldon, Ames, and Dunning explored emotional intelligence in relation to the Dunning Kruger effect in their 2010 study. While they conducted three separate studies, we’ll focus on the first one, which required 157 masters students to complete a Mayer-Salovey Caruso Emotional Intelligence Test. Participants were given an extensive description of EI and then asked to estimate their percentile ranking on a scale from zero to 100. They also needed to estimate their score on the MSCEIT.
As you might’ve guessed, participants who scored lowest, at the 10th percentile for emotional intelligence, overstimated their EI by 63 to 69 percentile points, and believed their MSCEIT performance to be 62 to 63 points higher than it was.
On the contrary, top performers, in the 90th percentile for EI, underestimated their EI score by five to 20 points.
This example is critical for recognizing the Dunning Kruger effect is not simply related to raw logic-based skill. Instead, it biases other aspects of our lives, including social interactions. Emotional intelligence is key to becoming a better co-worker and leader, and incorrectly assuming you’ve got high EI could be detrimental to your long-term career growth.
Consider taking an emotional intelligence test, or another personality test, to fairly judge your strengths and weaknesses.
Dunning Kruger Effect Potential Solutions
Solution One: Offer Resources to Rectify Your Colleague’s Self-Perceptions
If low performers overestimate their ability in a skill because they don’t have the knowledge to fairly evaluate their performance, a solution could be to provide those low performers with the resources and knowledge necessary to accurately judge their own performances.
During their original 1999 study, Dunning and Kruger tested this hypothesis by asking participants in study four to complete a number of Wason selection tasks (which is meant to evaluate logical reasoning skills). Afterwards, they provided roughly half the participants with a training session on how to solve Wason tasks, and then asked them to re-evaluate how well they’d done.
Overall, bottom quartile performers who received the training session became better and more accurate judges of their own abilities. Before the training, they’d ranked their ability around the 55th percentile, estimated their test performance around the 51st percentile, and reported answering 5.3 problems correctly.
After the training, these same bottom performers re-ranked their ability around the 44th percentile, estimated their test performance around the 32nd percentile, and reported answering only one problem correctly.
If you’re dealing with a colleague who can’t see how badly she’s performing, perhaps it’s because she doesn’t have the tools or training necessary to see her mistakes. Rather than explaining her mistakes and hoping she’ll get it, maybe you need to go further and offer training resources to re-calibrate how she critiques her skills.
For instance, perhaps your colleague Karen’s programming inadequacy is due to a lack of knowledge of Java Script — her background in coding leads her to believe she intuitively understands Java Script, but she can’t see how programming differs from code. If this is the case, offering a free training on Java Script could show Karen how much she needs to learn, and how to better evaluate her performance.
Solution Two: Provide Feedback Sessions
When a new colleague joins your team, she carries with her a list of preconceived notions of her strengths and weaknesses — but studies have proven people’s perception of their skills are only weakly correlated to their actual performance (Mabe and West, 1982). This makes it difficult for people to fairly evaluate their own abilities — if I believe I’m an exceptionally strong writer, and I’m given a test labelled, “Writing Rules,” I’m going to speed through the test and assume all my answers are correct, and it will be harder to accept objective feedback to the contrary.
On the other hand, if I’m given a test labelled “Math Rules,” and I’m not personally invested in the subject, I’m a better self-evaluator and will more fairly judge my own performance.
However, I could be wrong about my own skills — maybe I’m better at math than I am at writing, in which case, my evaluations are biased from the get-go.
A Ehrlinger and Dunning study from 2003 tested this same concept — they provided participants with a 10-item test and either described it as an “abstract reasoning” test or as a “computer programming skills” test. The participants had already described themselves as exceptionally strong in abstract reasoning, but admitted no knowledge of computer programming. As expected, participants who believed they’d taken an “abstract reasoning” test scored themselves 12% more favorably than when the test was labelled “computer programming”.
While there are no easy solutions to this, it’s important to take into consideration. Arming your colleagues with the knowledge that they are biased judges of their own performance could be a strong initial step. Perhaps you want to conduct a feedback session, in which you teach colleagues how to openly accept hard-to-hear feedback by acknowledging they aren’t always fair self-evaluators.
You could also offer workplace learning courses. Ultimately, the more your coworkers learn, the less likely they are to think they’re experts in a subject — which, ironically, makes them more likely to become one.

Fitts’s Law: The UX Hack that Will Strengthen Your Design
The next time you get in your car, take a closer look at your foot pedals. You might notice something you’ve never paid too much attention to before: your brake pedal is bigger and closer to your seat than your accelerator pedal.
Once you notice this subtlety, it immediately makes sense, right? If the brake pedal is bigger and closer to you, then it’s quicker and easier to stop than it is to accelerate. This makes driving safer for you and everyone else on the road. If the pedals’ size and closeness were reversed, our roads would constantly look like a bumper car arena.
The design of car pedals is based off a predictive model of human movement called Fitts’s law. And it’s all around us: the space bar is the biggest key on your keyboard because it’s the most important one. And the button that turns off heavy machinery is bigger than the one that turns it on — you don’t want people accidentally turning heavy machinery on. But you do want to make it easy to for people to turn it off.
What is Fitts’s law?
Fitts’s law is a predictive model for the speed of human movement, commonly used in human-computer interaction. It states that the time it takes someone to select an object depends on how far they are from the object and the size of the object. Small objects that are far from your starting position or related objects that are far away from each other take the longest time to select. Large objects that are close to your starting position or related objects that are close together take the shortest time to select.
In the physical world, this law seems pretty straightforward. The biggest button on a microwave is the door button because opening the microwave door is the most important action. In human-computer interaction, it’s just as simple.
When your cursor is far away from a small call-to-action, you need to be more precise to accuracy click on it, increasing the time and energy you spend moving your mouse toward the CTA. But when your cursor is close to a large CTA, you don’t need to be as precise to accurately click on it. You can spend less time and energy moving your mouse toward the CTA and still get the same result.
Fitts’s law is widely applied in UX and UI design, or any interface that involves pointing with a mouse or finger. It’s the reason why call-to-actions on websites are large. Think about it: if you want users to take specific actions on your site, placing large call-to-actions where users expect them to be makes them easy to find and click on.
That said, these guidelines should be taken with a grain of salt. Logic alone can’t design a stellar user experience. Emotions drive human behavior, attracting us to visually appealing objects that are easy to use. And designing a user-centered experience requires a solid understanding of human psychology. Below, we’ll cover how to balance the logic of Fitts’s law with psychology by examining three examples from some of the top user experiences out there.
3 Examples of Fitts’s Law in Web Design
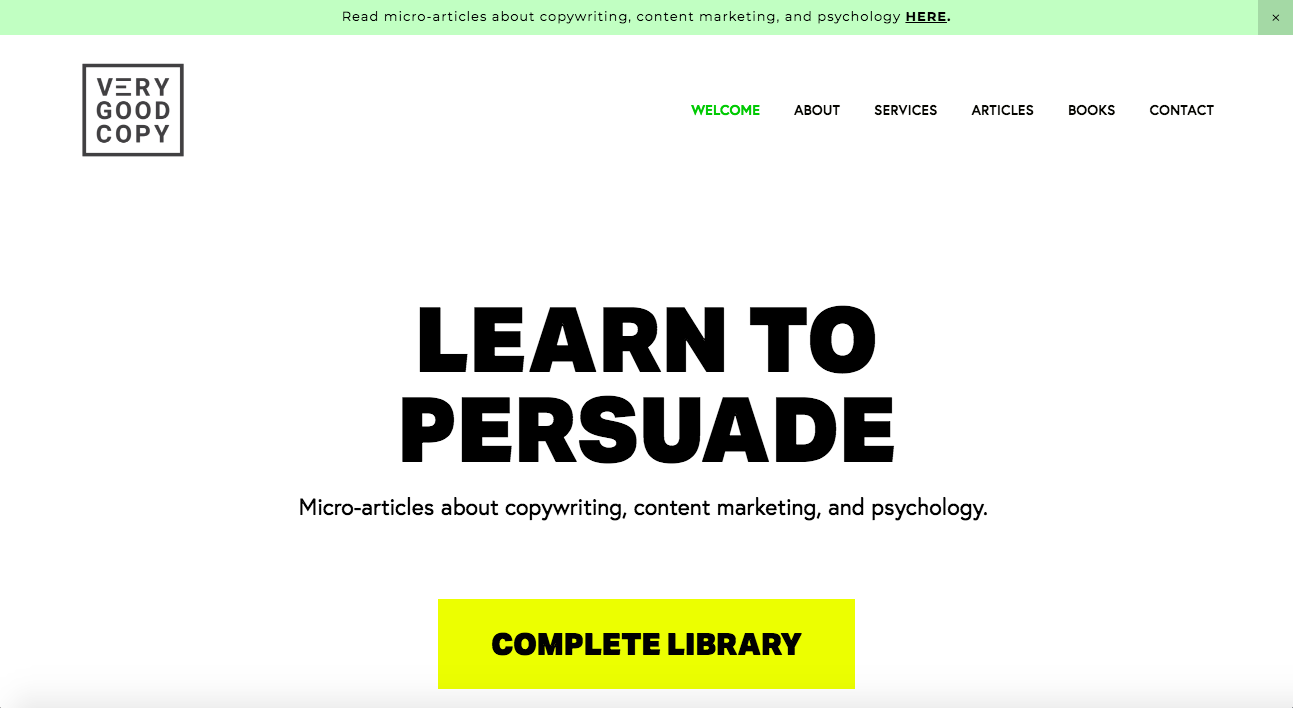
1. Size | VeryGoodCopy
When an entire button or image is large, clickable, and has clear boundaries, they’re easy to select. Users can intuitively understand where to click and where not to click. But forcing users to point their cursor directly over a specific part of a button, like the text, requires more precision, and, in turn, time and effort.
Bigger isn’t always better, though. Increasing your button’s size can produce diminishing returns of usability. A button that’s too big can shatter your page’s balance and hog valuable real estate that’s better suited for white space or another call-to-action. Buttons that are large enough to demand attention without disrupting the visual balance of your page are what maximize usability.
Ultimately, pixels are scarce. But the relationship of usability and size lets you salvage valuable real estate to clean up your page with white space or boost its conversion rate by adding another call-to-action, like VeryGoodCopy’s website below.
2. Distance | HubSpot
When users land on your website, and you want them to take a specific action, you need to estimate where the starting point of their cursor will be. This is called the prime pixel.
Brands don’t actually know their website visitors’ prime pixel location, but this is surprisingly a good thing. If they knew where this point was, then they could adapt their website design to your cursor location and create the shortest path to a desired CTA from it. Your user experience would be different every time you entered the site. And that would make it much harder to find things — you’d essentially be looking at a new website design every time you enter it.
Estimating the location of your prime pixel is a better alternative because it allows you to build a consistent and easy-to-navigate site. For instance, Google’s search box is always in the center of the screen because when users enter the site, they’re most likely looking at the middle of the screen. Most of the time, the prime pixel should influence the location of the target object. And the shorter the path to desired action, the better the user experience.
On mobile devices, the primary pixel is the area where your thumbs are, which are called the thumb zones. Fitts’s law applies to our thumbs’ range of motion in terms of mobile user experience. That’s why iPhone menus are at the bottom of the screen. Your thumbs naturally hover over that area, so you don’t need to stretch them or move your hands to reach those important buttons.
But since mobile phones don’t have much space on their screens, it’s challenging not to cluster buttons together on your website. This could make it easy for someone’s thumb to aim for one button and mistakenly hit another. Putting enough space between your buttons will prevent these mishaps from happening.
Placing buttons around the prime pixel isn’t a hard rule, though. In theory, pie menus should be easier to use because you barely have to move your cursor to select an option. The buttons are all centered around the prime pixel. But using submenus inside of a pie menu branches them off of circles, which can clutter your page.
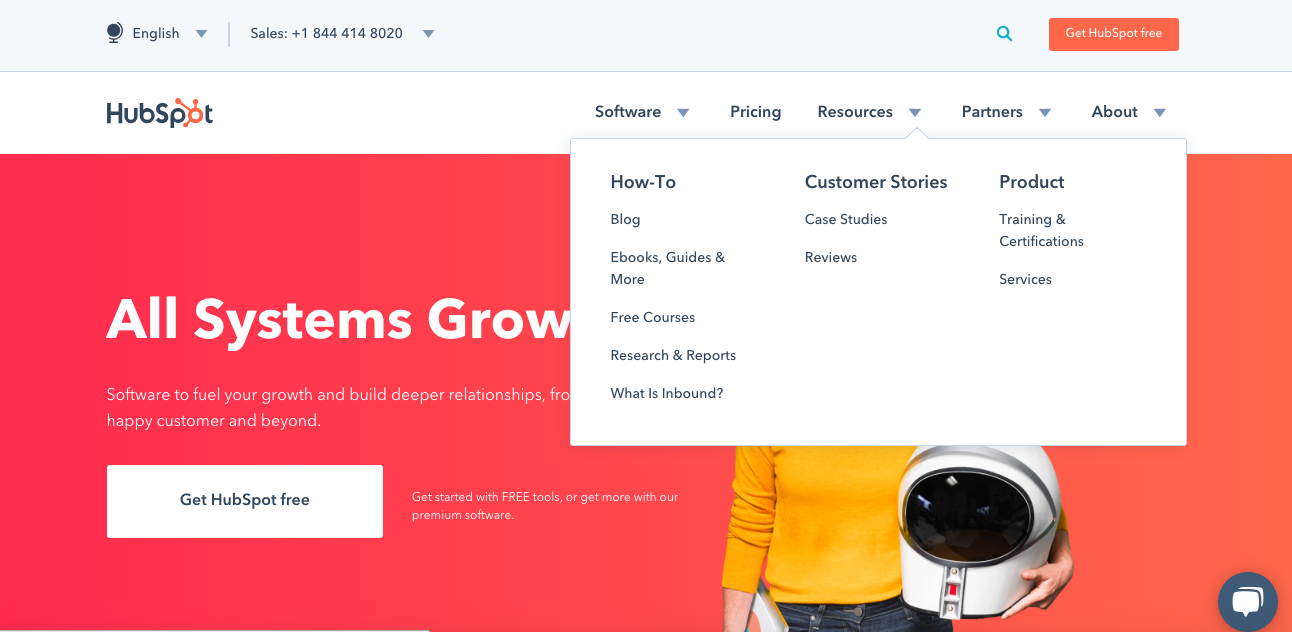
Dropdown menus are the more user-friendly option. Even though they technically take longer to select an option — users have to do a longer cursor movement to find their buttons — drop-down menus are more visually pleasing and hog less space than pie menus. They also unclutter your interface and organize its content into hierarchies and different groups. This allows you to have multiple dropdown menus right next to each other with submenus in all of them, without having to sacrifice the aesthetic of your page or a ton of whitespace, like HubSpot’s homepage below.
Fitts’s law also suggests that you should decrease the distance between objects that users use in a logical order. For instance, the login button is always right next to the username and password form fields.
When certain buttons are related, you should organize them in a way that’s easy to remember and find. Grouping similar buttons creates a familiar mental map on your website that users can basically memorize.
But placing every comparable button right next to each other could clutter your page and lead to a lot of user mistakes, especially if you put a high risk button, like a delete email button, right next to a frequently used button, like a send email button. To reduce these accidental actions, there should either be a two-step method to verify the action, an undo option, or ample space between the buttons.
3. Effort | Google and Apple
A lot of vital commands like ‘exit’, ‘start’, and ‘shut down’ are located in the corners of your computer screen. Placing buttons there makes it easier for users to select them because the buttons are pinned by two sides. And the cursor stops at each side, so you can’t go beyond them. This means you don’t have be as precise when you want to click a button in a corner or edge. You just have to move your cursor to its general vicinity.
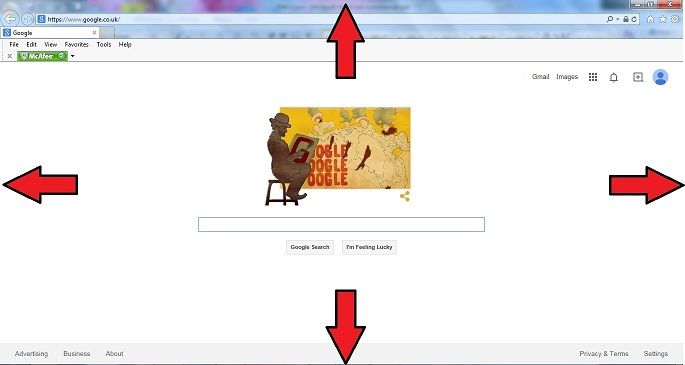
Placing buttons in corners and edges isn’t as user friendly on mobile devices, though. If you place them there, users need to stretch their fingers or move their hands just to reach them.
Less effort isn’t always better either. Crucial commands that are easy to do like turning off your phone doesn’t allow users to minimize the costs of their mistakes. Once they trigger them, users can’t undo them. There’s no forgiveness in the design at all.
To prevent frequent accidental shutdowns on their phones, Apple makes users swipe a slider to turn off their phone. And to rescind a power off, all users have to do is press the cancel button. The cancel button’s consequence doesn’t compare to turning the phone off, so Apple makes it easier to accidentally press it.

Fitts’s law is incredibly useful, but it isn’t full proof. Data always trumps theory, especially when testing user experience, so consider tracking the way users use your website and optimize its design for usability and conversions. Remember, Fitts’s law should never be a hard rule in user experience design. But it should always be an essential guideline.

24 Excel Formulas, Keyboard Shortcuts & Tricks That’ll Save You Lots of Time
Marketing and Microsoft Excel go together like peanut butter and chocolate. There’s just one problem.
For many of us, trying to organize and analyze Excel worksheets can feel like walking into a brick wall over and over again. You’re manually replicating columns and scribbling down long-form math on a scrap of paper, all while thinking to yourself, “There has to be a better way to do this.”
Truth be told, there is — you just don’t know it yet.
Excel can be tricky that way. On one hand, it’s an exceptionally powerful tool for reporting and analyzing marketing data. On the other, without the proper training, it’s easy to feel like it’s working against you. For starters, there are more than a dozen critical formulas Excel can automatically run for you so you’re not combing through hundreds of cells with a calculator on your desk.
Excel Formulas
- IF
- Percentage
- Subtraction
- Multiplication
- Division
- DATE
- Array
- COUNT
- AVERAGE
- SUMIF
- TRIM
- LEFT, MID, and RIGHT
- VLOOKUP
- RANDOMIZE
To help you use Excel more effectively (and save a ton of time), we’ve compiled a list of essential formulas, keyboard shortcuts, and other small tricks and functions you should know.
NOTE: The following formulas apply to Excel 2017. If you’re using a slightly older version of Excel, the location of each feature mentioned below might be slightly different.
IF Formula in Excel
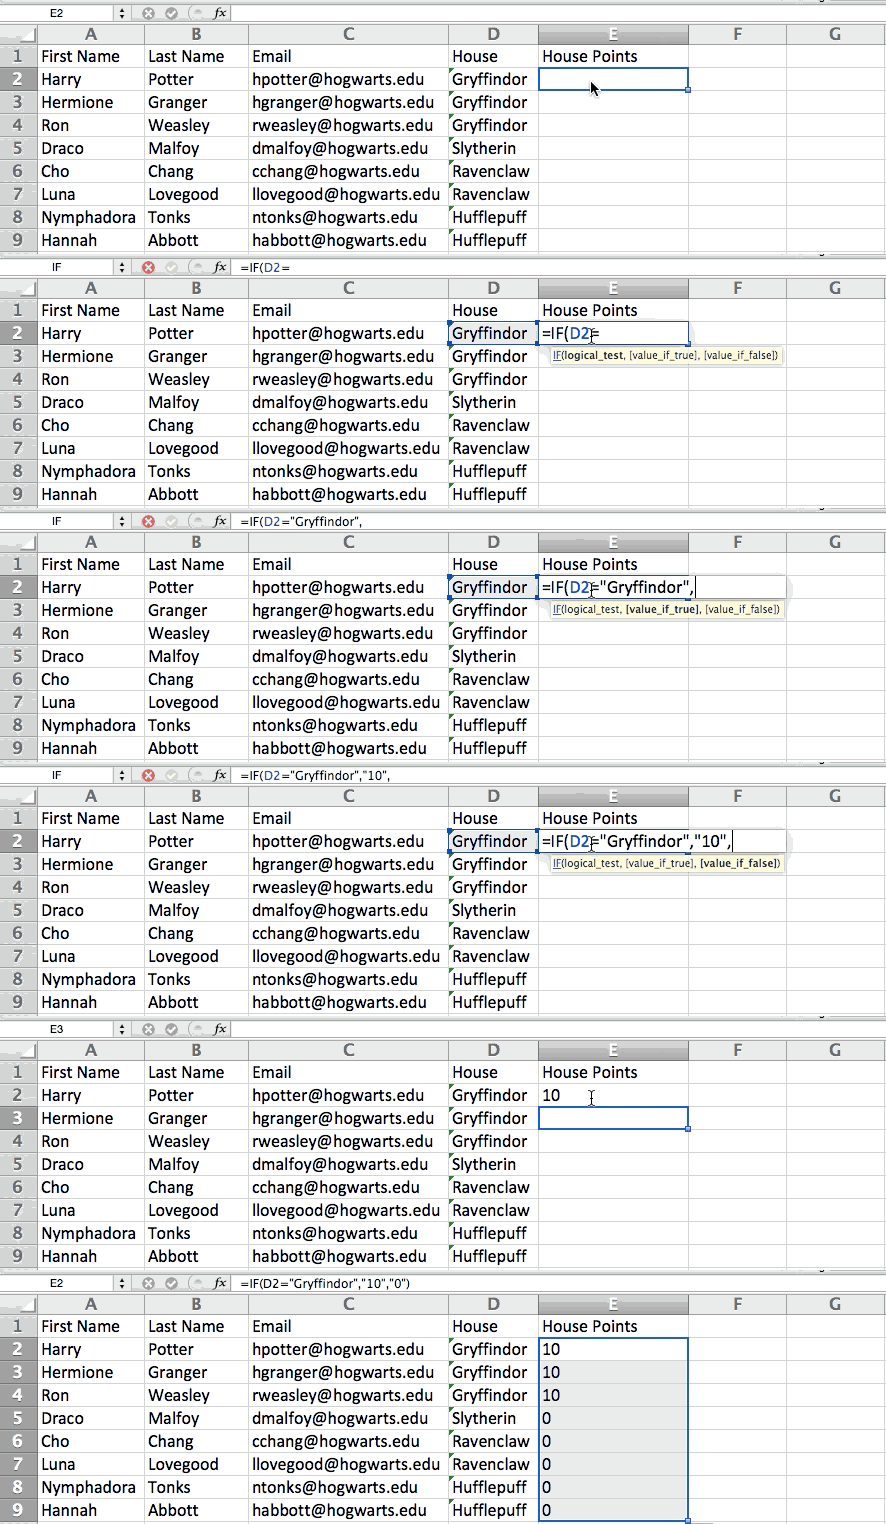
The IF formula in Excel is denoted =IF(logical_test, value_if_true, value_if_false). This allows you to enter a text value into the cell “if” something else in your spreadsheet is true or false. For example, =IF(D2=”Gryffindor”,”10″,”0″) would award 10 points to cell D2 if that cell contained the word “Gryffindor.”
There are times when we want to know how many times a value appears in our spreadsheets. But there are also those times when we want to find the cells that contain those values, and input specific data next to it.
We’ll go back to Sprung’s example for this one. If we want to award 10 points to everyone who belongs in the Gryffindor house, instead of manually typing in 10’s next to each Gryffindor student’s name, we’ll use the IF-THEN formula to say: If the student is in Gryffindor, then he or she should get ten points.
- The formula: IF(logical_test, value_if_true, value_if_false)
- Logical_Test: The logical test is the “IF” part of the statement. In this case, the logic is D2=”Gryffindor.” Make sure your Logical_Test value is in quotation marks.
- Value_if_True: If the value is true — that is, if the student lives in Gryffindor — this value is the one that we want to be displayed. In this case, we want it to be the number 10, to indicate that the student was awarded the 10 points. Note: Only use quotation marks if you want the result to be text instead of a number.
- Value_if_False: If the value is false — and the student does not live in Gryffindor — we want the cell to show “0,” for 0 points.
- Formula in below example: =IF(D2=”Gryffindor”,”10″,”0″)
Percentage Formula in Excel
To perform the percentage formula in Excel, enter the cells you’re finding a percentage for in the format, =A1/B1. To convert the resulting decimal value to a percentage, highlight the cell, click the Home tab, and select “Percentage” from the numbers dropdown.
There isn’t an Excel “formula” for percentages per se, but Excel makes it easy to convert the value of any cell into a percentage so you’re not stuck calculating and reentering the numbers yourself.
The basic setting to convert a cell’s value into a percentage is under Excel’s Home tab. Select this tab, highlight the cell(s) you’d like to convert to a percentage, and click into the dropdown menu next to Conditional Formatting (this menu button might say “General” at first). Then, select “Percentage” from the list of options that appears. This will convert the value of each cell you’ve highlighted into a percentage. See this feature below.
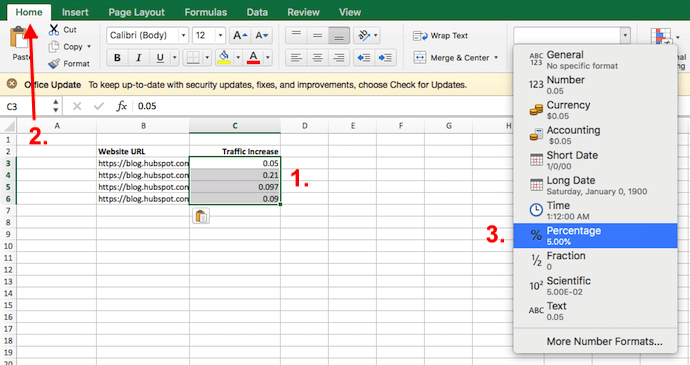
Keep in mind if you’re using other formulas, such as the division formula (denoted =A1/B1), to return new values, your values might show up as decimals by default. Simply highlight your cells before or after you perform this formula, and set these cells’ format to “Percentage” from the Home tab — as shown above.
Subtraction Formula in Excel
To perform the subtraction formula in Excel, enter the cells you’re subtracting in the format, =SUM(A1, -B1). This will subtract a cell using the SUM formula by adding a negative sign before the cell you’re subtracting. For example, if A1 was 10 and B1 was 6, =SUM(A1, -B1) would perform 10 + -6, returning a value of 4.
Like percentages, subtracting doesn’t have its own formula in Excel either, but that doesn’t mean it can’t be done. You can subtract any values (or those values inside cells) two different ways.
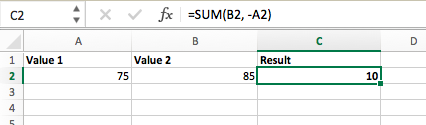
- Using the =SUM formula. To subtract multiple values from one another, enter the cells you’d like to subtract in the format =SUM(A1, -B1), with a negative sign (denoted with a hyphen) before the cell whose value you’re subtracting. Press enter to return the difference between both cells included in the parentheses. See how this looks in the screenshot above.
- Using the format, =A1-B1. To subtract multiple values from one another, simply type an equals sign followed by your first value or cell, a hyphen, and the value or cell you’re subtracting. Press Enter to return the difference between both values.
Multiplication Formula in Excel
To perform the multiplication formula in Excel, enter the cells you’re multiplying in the format, =A1*B1. This formula uses an asterisk to multiply cell A1 by cell B1. For example, if A1 was 10 and B1 was 6, =A1*B1 would return a value of 60.
You might think multiplying values in Excel has its own formula or uses the “x” character to denote multiplication between multiple values. Actually, it’s as easy as an asterisk — *.
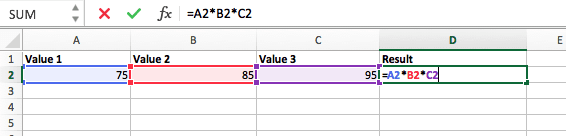
To multiply two or more values in an Excel spreadsheet, highlight an empty cell. Then, enter the values or cells you want to multiply together in the format, =A1*B1*C1 … etc. The asterisk will effectively multiply each value included in the formula.
Press Enter to return your desired product. See how this looks in the screenshot above.
Excel Division Formula
To perform the division formula in Excel, enter the cells you’re dividing in the format, =A1/B1. This formula uses a forward slash, “/,” to divide cell A1 by cell B1. For example, if A1 was 5 and B1 was 10, =A1/B1 would return a decimal value of 0.5.
Division in Excel is one of the simplest functions you can perform. To do so, highlight an empty cell, enter an equals sign, “=,” and follow it up with the two (or more) values you’d like to divide with a forward slash, “/,” in between. The result should be in the following format: =B2/A2, as shown in the screenshot below.
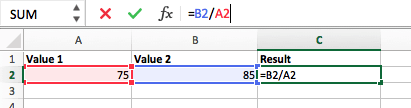
Hit Enter, and your desired quotient should appear in the cell you initially highlighted.
Excel DATE Formula
The Excel DATE formula is denoted =DATE(year, month, day). This formula will return a date that corresponds to the values entered in the parentheses — even values referred from other cells. For example, if A1 was 2018, B1 was 7, and C1 was 11, =DATE(A1,B1,C1) would return 7/11/2018.
Creating dates in the cells of an Excel spreadsheet can be a fickle task every now and then. Luckily, there’s a handy formula to make formatting your dates easy. There are two ways to use this formula:
- Create dates from a series of cell values. To do this, highlight an empty cell, enter “=DATE,” and in parentheses, enter the cells whose values create your desired date — starting with the year, then the month number, then the day. The final format should look like this: =DATE(year, month, day). See how this looks in the screenshot below.
- Automatically set today’s date. To do this, highlight an empty cell and enter the following string of text: =DATE(YEAR(TODAY()), MONTH(TODAY()), DAY(TODAY())). Pressing enter will return the current date you’re working in your Excel spreadsheet.
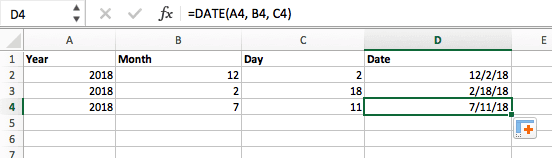
In either usage of Excel’s date formula, your returned date should be in the form of “mm/dd/yy” — unless your Excel program is formatted differently.
Excel Array Formula
An array formula in Excel surrounds a simple formula in brace characters using the format, {=(Start Value 1:End Value 1)*(Start Value 2:End Value 2)}. By pressing ctrl+shift+center, this will calculate and return value from multiple ranges, rather than just individual cells added to or multiplied by one another.
Calculating the sum, product, or quotient of individual cells is easy — just use the =SUM formula and enter the cells, values, or range of cells you want to perform that arithmetic on. But what about multiple ranges? How do you find the combined value of a large group of cells?
Numerical arrays are a useful way to perform more than one formula at the same time in a single cell so you can see one final sum, difference, product, or quotient. If you’re looking to find total sales revenue from several sold units, for example, the array formula in Excel is perfect for you. Here’s how you’d do it:
- To start using the array formula, type “=SUM,” and in parentheses, enter the first of two (or three, or four) ranges of cells you’d like to multiply together. Here’s what your progress might look like: =SUM(C2:C5
- Next, add an asterisk after the last cell of the first range you included in your formula. This stands for multiplication. Following this asterisk, enter your second range of cells. You’ll be multiplying this second range of cells by the first. Your progress in this formula should now look like this: =SUM(C2:C5*D2:D5)
- Ready to press Enter? Not so fast … Because this formula is so complicated, Excel reserves a different keyboard command for arrays. Once you’ve closed the parentheses on your array formula, press Ctrl+Shift+Enter. This will recognize your formula as an array, wrapping your formula in brace characters and successfully returning your product of both ranges combined.
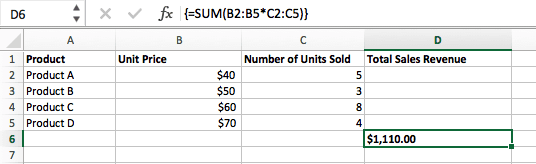
In revenue calculations, this can cut down on your time and effort significantly. See the final formula in the screenshot below.
COUNT Formula in Excel
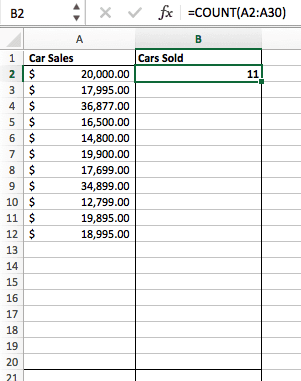
The COUNT formula in Excel is denoted =COUNT(Start Cell:End Cell). This formula will return a value that is equal to the number of entries found within your desired range of cells. For example, if there are eight cells with entered values between A1 and A10, =COUNT(A1:A10) will return a value of 8.
The COUNT formula in Excel is particularly useful for large spreadsheets, wherein you want to see how many cells contain actual entries. Don’t be fooled: This formula won’t do any math on the values of the cells themselves. This formula is simply to find out how many cells in a selected range are occupied with something.
Using the formula in bold above, you can easily run a count of active cells in your spreadsheet. The result will look a little something like this:
AVERAGE Formula in Excel
To perform the average formula in Excel, enter the values, cells, or range of cells of which you’re calculating the average in the format, =AVERAGE(number1, number2, etc.) or =AVERAGE(Start Value:End Value). This will calculate the average of all the values or range of cells included in the parentheses.
Finding the average of a range of cells in Excel keeps you from having to find individual sums and then performing a separate division equation on your total. Using =AVERAGE as your initial text entry, you can let Excel do all the work for you.
For reference, the average of a group of numbers is equal to the sum of those numbers, divided by the number of items in that group.
SUMIF Formula in Excel
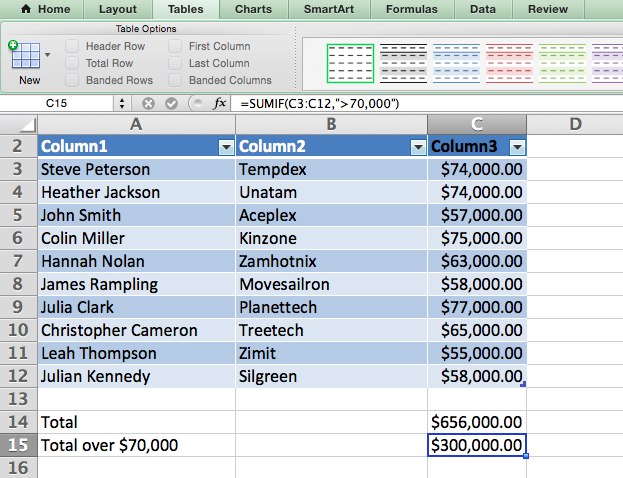
The SUMIF formula in Excel is denoted =SUMIF(range, criteria, [sum range]). This will return the sum of the values within a desired range of cells that all meet one criterion. For example, =SUMIF(C3:C12,”>70,000″) would return the sum of values between cells C3 and C12 from only the cells that are greater than 70,000.
Let’s say you want to determine the profit you generated from a list of leads who are associated with specific area codes, or calculate the sum of certain employees’ salaries — but only if they fall above a particular amount. Doing that manually sounds a bit time-consuming, to say the least.
With the SUMIF function, it doesn’t have to be — you can easily add up the sum of cells that meet certain criteria, like in the salary example above.
- The formula: =SUMIF(range, criteria, [sum_range])
- Range: The range that is being tested using your criteria.
- Criteria: The criteria that determine which cells in Criteria_range1 will be added together
- [Sum_range]: An optional range of cells you’re going to add up in addition to the first Range entered. This field may be omitted.
In the example below, we wanted to calculate the sum of the salaries that were greater than $70,000. The SUMIF function added up the dollar amounts that exceeded that number in the cells C3 through C12, with the formula =SUMIF(C3:C12,”>70,000″).
TRIM Formula in Excel
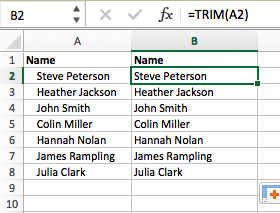
The TRIM formula in Excel is denoted =TRIM(text). This formula will remove any spaces entered before and after the text entered in the cell. For example, if A2 includes the name ” Steve Peterson” with unwanted spaces before the first name, =TRIM(A2) would return “Steve Peterson” with no spaces in a new cell.
Email and file sharing are wonderful tools in today’s workplace. That is, until one of your colleagues sends you a worksheet with some really funky spacing. Not only can those rogue spaces make it difficult to search for data, but they also affect the results when you try to add up columns of numbers.
Rather than painstakingly removing and adding spaces as needed, you can clean up any irregular spacing using the TRIM function, which is used to remove extra spaces from data (except for single spaces between words).
- The formula: =TRIM(text).
- Text: The text or cell from which you want to remove spaces.
Here’s an example of how we used the TRIM function to remove extra spaces before a list of names. To do so, we entered =TRIM(“A2”) into the Formula Bar, and replicated this for each name below it in a new column next to the column with unwanted spaces.
Below are some other Excel formulas you might find useful as your data management needs grow.
LEFT, MID, and RIGHT Formula
Let’s say you have a line of text within a cell that you want to break down into a few different segments. Rather than manually retyping each piece of the code into its respective column, users can leverage a series of string functions to deconstruct the sequence as needed: LEFT, MID, or RIGHT.
LEFT:
- Purpose: Used to extract the first X numbers or characters in a cell.
- The formula: =LEFT(text, number_of_characters)
- Text: The string that you wish to extract from.
- Number_of_characters: The number of characters that you wish to extract starting from the left-most character.
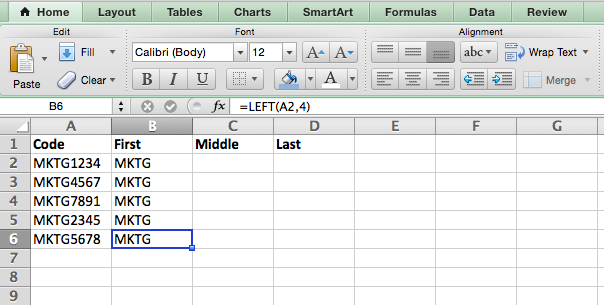
In the example below, we entered =LEFT(A2,4) into cell B2, and copied it into B3:B6. That allowed us to extract the first 4 characters of the code.
MID:
- Purpose: Used to extract characters or numbers in the middle based on position.
- The formula: =MID(text, start_position, number_of_characters)
- Text: The string that you wish to extract from.
- Start_position: The position in the string that you want to begin extracting from. For example, the first position in the string is 1.
- Number_of_characters: The number of characters that you wish to extract.
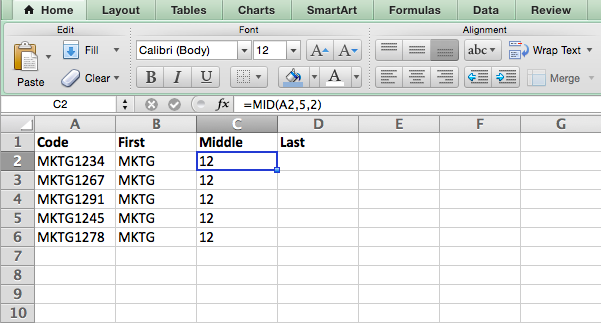
In this example, we entered =MID(A2,5,2) into cell B2, and copied it into B3:B6. That allowed us to extract the two numbers starting in the fifth position of the code.
RIGHT:
- Purpose: Used to extract the last X numbers or characters in a cell.
- The formula: =RIGHT(text, number_of_characters)
- Text: The string that you wish to extract from.
- Number_of_characters: The number of characters that you want to extract starting from the right-most character.
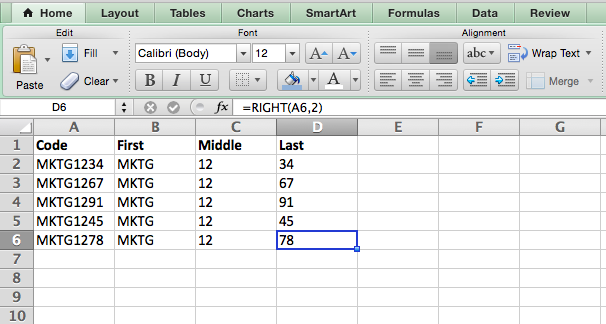
For the sake of this example, we entered =RIGHT(A2,2) into cell B2, and copied it into B3:B6. That allowed us to extract the last two numbers of the code.
VLOOKUP Formula
This one is an oldie, but a goodie — and it’s a bit more in depth than some of the other formulas we’ve listed here. But it’s especially helpful for those times when you have two sets of data on two different spreadsheets, and want to combine them into a single spreadsheet.
My colleague, Rachel Sprung — whose “How to Use Excel” tutorial is a must-read for anyone who wants to learn — uses a list of names, email addresses, and companies as an example. If you have a list of people’s names next to their email addresses in one spreadsheet, and a list of those same people’s email addresses next to their company names in the other, but you want the names, email addresses, and company names of those people to appear in one place — that’s where VLOOKUP comes in.
Note: When using this formula, you must be certain that at least one column appears identically in both spreadsheets. Scour your data sets to make sure the column of data you’re using to combine your information is exactly the same, including no extra spaces.
- The formula: VLOOKUP(lookup value, table array, column number, [range lookup])
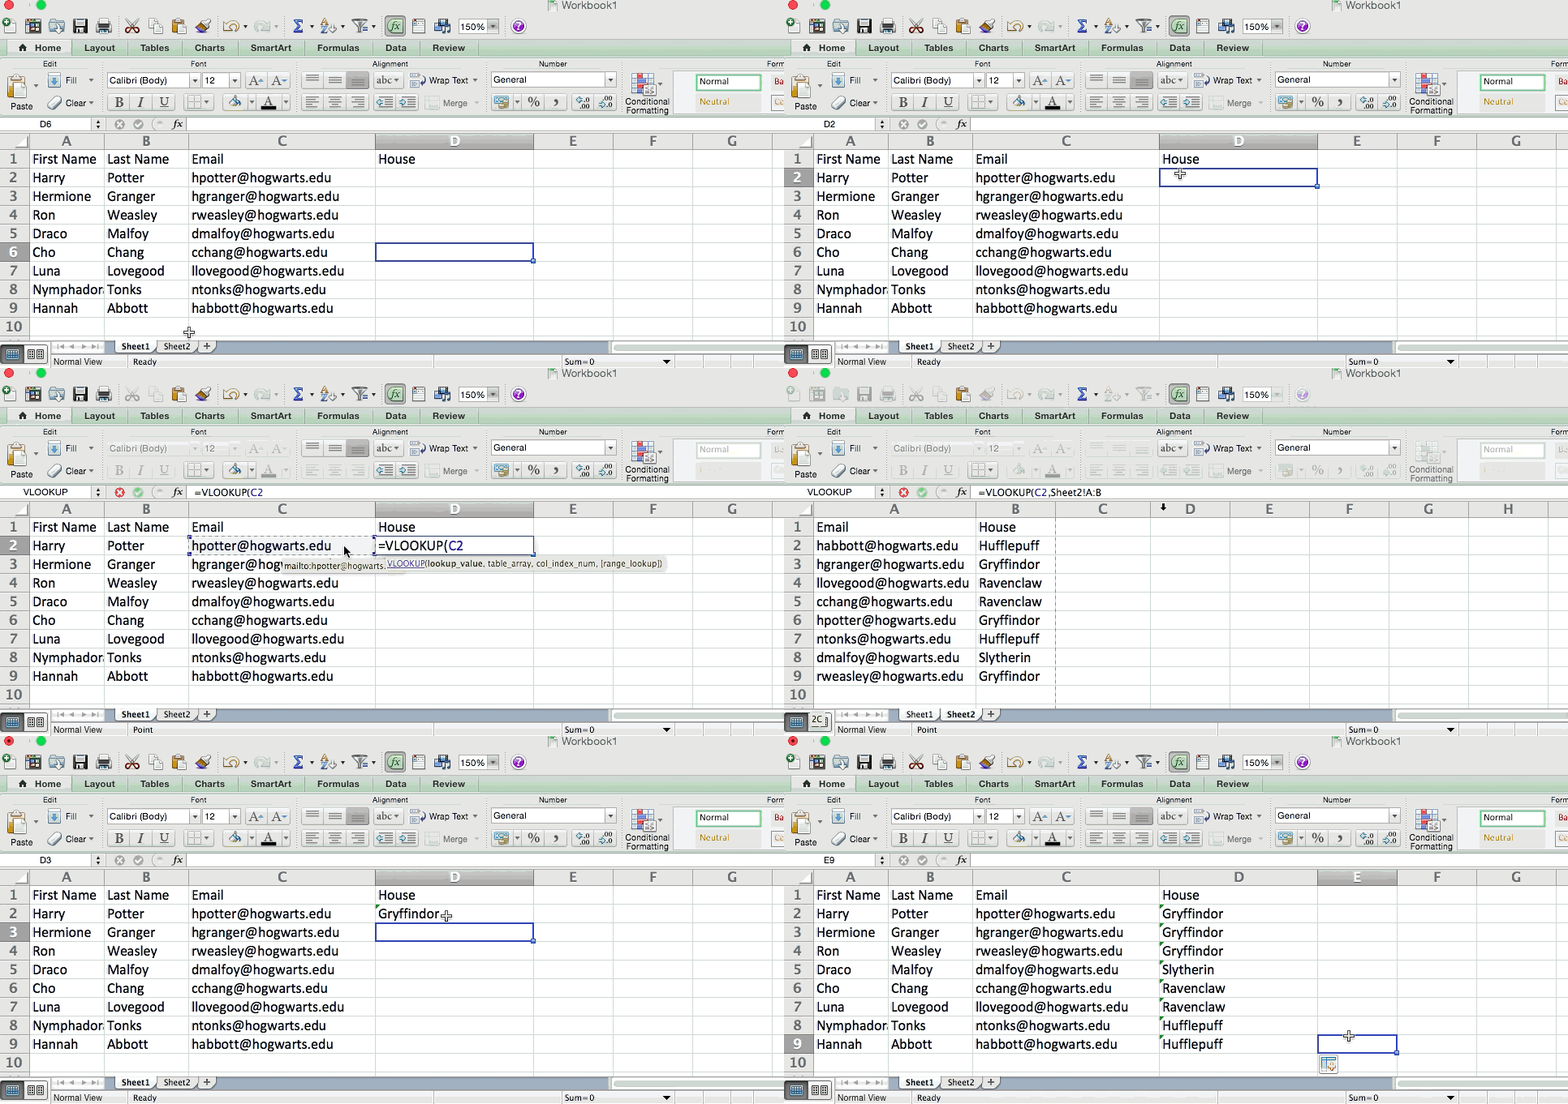
- Lookup Value: The identical value you have in both spreadsheets. Choose the first value in your first spreadsheet. In Sprung’s example that follows, this means the first email address on the list, or cell 2 (C2).
- Table Array: The range of columns on Sheet 2 you’re going to pull your data from, including the column of data identical to your lookup value (in our example, email addresses) in Sheet 1 as well as the column of data you’re trying to copy to Sheet 1. In our example, this is “Sheet2!A:B.” “A” means Column A in Sheet 2, which is the column in Sheet 2 where the data identical to our lookup value (email) in Sheet 1 is listed. The “B” means Column B, which contains the information that’s only available in Sheet 2 that you want to translate to Sheet 1.
- Column Number: The table array tells Excel where (which column) the new data you want to copy to Sheet 1 is located. In our example, this would be the “House” column, the second one in our table array, making it column number 2.
- Range Lookup: Use FALSE to ensure you pull in only exact value matches.
- The formula with variables from Sprung’s example below: =VLOOKUP(C2,Sheet2!A:B,2,FALSE)
In this example, Sheet 1 and Sheet 2 contain lists describing different information about the same people, and the common thread between the two is their email addresses. Let’s say we want to combine both datasets so that all the house information from Sheet 2 translates over to Sheet 1. Here’s how that would work:
RANDOMIZE Formula
There’s a great article that likens Excel’s RANDOMIZE formula to shuffling a deck of cards. The entire deck is a column, and each card — 52 in a deck — is a row. “To shuffle the deck,” writes Steve McDonnell, “you can compute a new column of data, populate each cell in the column with a random number, and sort the workbook based on the random number field.”
In marketing, you might use this feature when you want to assign a random number to a list of contacts — like if you wanted to experiment with a new email campaign and had to use blind criteria to select who would receive it. By assigning numbers to said contacts, you could apply the rule, “Any contact with a figure of 6 or above will be added to the new campaign.”
- The formula: RAND()
- Start with a single column of contacts. Then, in the column adjacent to it, type “RAND()” — without the quotation marks — starting with the top contact’s row.
- For the example below: RANDBETWEEN(bottom,top)
- RANDBETWEEN allows you to dictate the range of numbers that you want to be assigned. In the case of this example, I wanted to use one through 10.
- bottom: The lowest number in the range.
- top: The highest number in the range,
- Formula in below example: =RANDBETWEEN(1,10)

Helpful stuff, right? Now for the icing on the cake: Once you’ve mastered the Excel formula you need, you’ll want to replicate it for other cells without rewriting the formula. And luckily, there’s an Excel function for that, too. Check it out below.
How to Copy Formula in Excel
- Type your formula into an empty cell.
- Press “Enter” to run the formula.
- Hover your cursor over the bottom-right corner of the cell containing the formula.
- Click and hold the small plus (“+”) sign that appears.
- Drag your cursor down the column.
- Release your mouse to copy the formula into each subsequent cell.
- Check each new value to ensure it corresponds to the correct cells.
Tired of manually entering data that follows a pattern across a bunch of cells? Excel’s Auto Fill feature is designed to minimize the work required on your end, by making it easy to repeat values you’ve already input.
To do so, click and hold the lower right corner of a cell, and then drag it down or across into adjacent cells. When you release, Excel will fill in the adjacent cells with the data from the cell you first selected.

Excel Keyboard Shortcuts
Quickly select rows, columns, or the whole spreadsheet.
Perhaps you’re crunched for time. I mean, who isn’t? No time, no problem. You can select your entire spreadsheet in just one click. All you have to do is simply click the tab in the top-left corner of your sheet to highlight everything all at once.
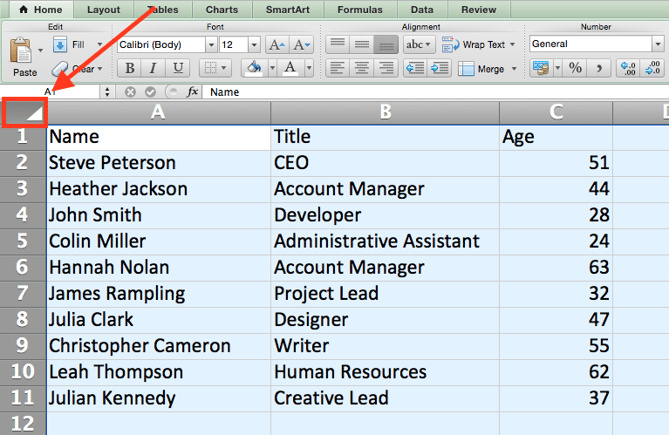
Just want to select everything in a particular column of row? That’s just as easy with these shortcuts:
For Mac:
- Select Column = Command + Shift + Down/Up
- Select Row = Command + Shift + Right/Left
For PC:
- Select Column = Control + Shift + Down/Up
- Select Row = Control + Shift + Right/Left
This shortcut is especially helpful when you’re working with larger data sets, but only need to select a specific piece of it.
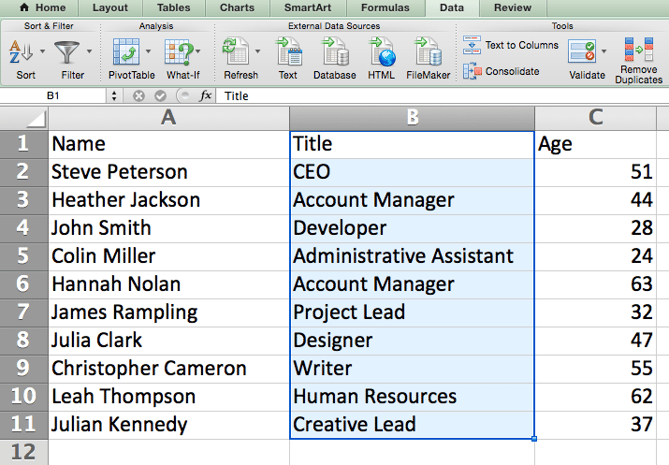
Quickly open, close, or create a workbook.
Need to open, close, or create a workbook on the fly? The following keyboard shortcuts will enable you to complete any of the above actions in less than a minute’s time.
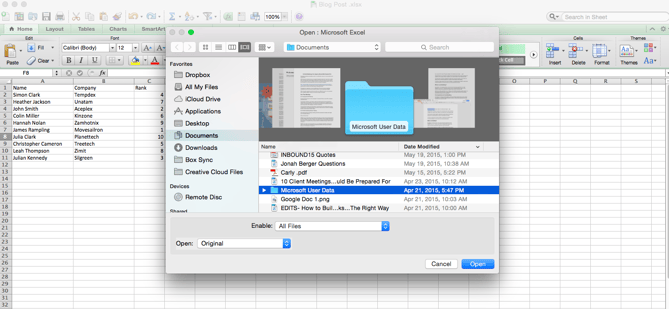
For Mac:
- Open = Command + O
- Close = Command + W
- Create New = Command + N
For PC:
- Open = Control + O
- Close = Control + F4
- Create New = Control + N
Format numbers into currency.
Have raw data that you want to turn into currency? Whether it be salary figures, marketing budgets, or ticket sales for an event, the solution is simple. Just highlight the cells you wish to reformat, and select Control + Shift + $.
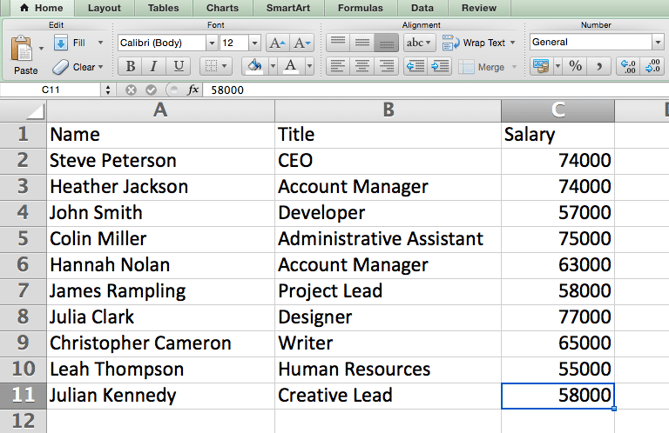
The numbers will automatically translate into dollar amounts — complete with dollar signs, commas, and decimal points.
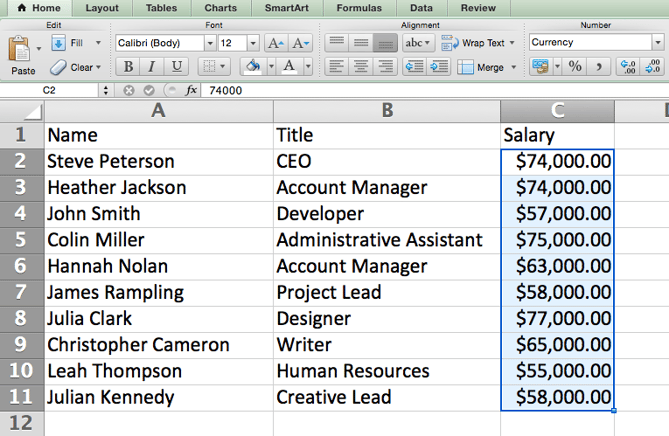
Note: This shortcut also works with percentages. If you want to label a column of numerical values as “percent” figures, replace “$” with “%”.
Insert current date and time into a cell.
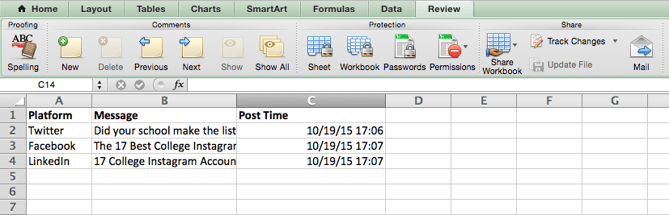
Whether you’re logging social media posts, or keeping track of tasks you’re checking off your to-do list, you might want to add a date and time stamp to your worksheet. Start by selecting the cell to which you want to add this information.
Then, depending on what you want to insert, do one of the following:
- Insert current date = Control + ; (semi-colon)
- Insert current time = Control + Shift + ; (semi-colon)
- Insert current date and time = Control + ; (semi-colon), SPACE, and then Control + Shift + ; (semi-colon).
Other Excel Tricks
Customize the color of your tabs.
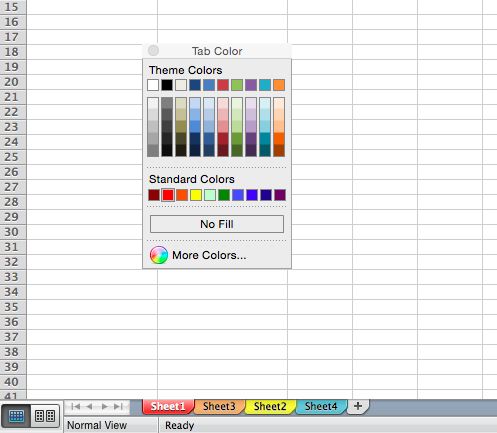
If you’ve got a ton of different sheets in one workbook — which happens to the best of us — make it easier to identify where you need to go by color-coding the tabs. For example, you might label last month’s marketing reports with red, and this month’s with orange.
Simply right click a tab and select “Tab Color.” A popup will appear that allows you to choose a color from an existing theme, or customize one to meet your needs.
Add a comment to a cell.
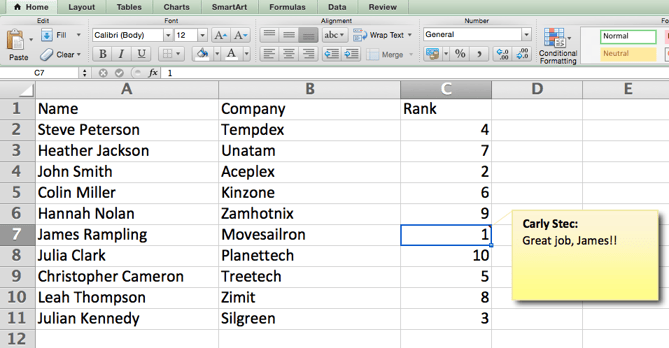
When you want to make a note or add a comment to a specific cell within a worksheet, simply right-click the cell you want to comment on, then click Insert Comment. Type your comment into the text box, and click outside the comment box to save it.
Cells that contain comments display a small, red triangle in the corner. To view the comment, hover over it.
Copy and duplicate formatting.
If you’ve ever spent some time formatting a sheet to your liking, you probably agree that it’s not exactly the most enjoyable activity. In fact, it’s pretty tedious.
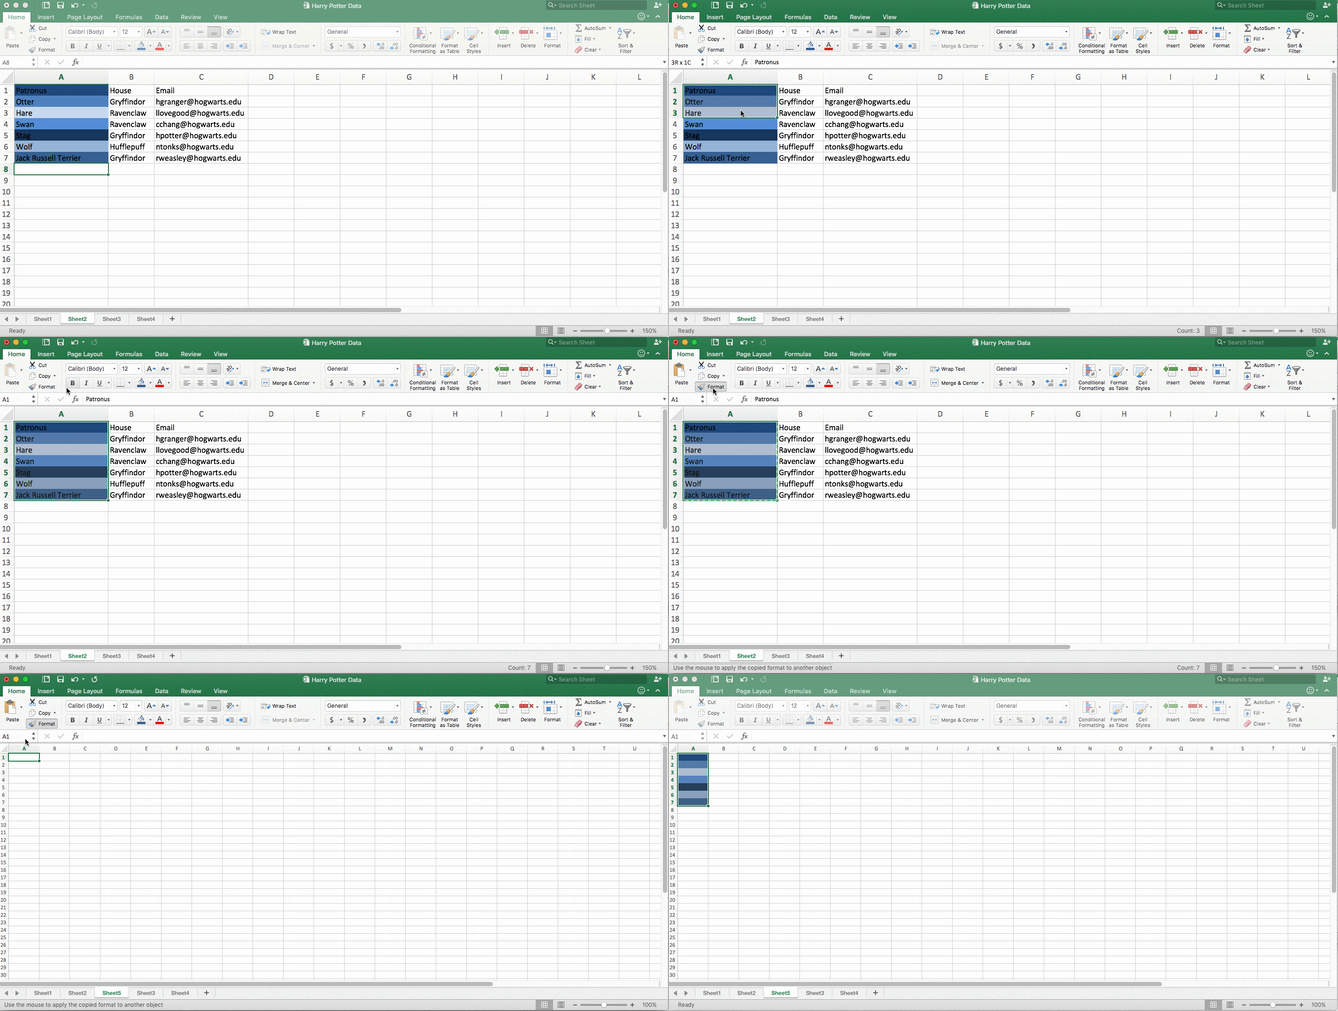
For that reason, it’s likely that you don’t want to repeat the process next time — nor do you have to. Thanks to Excel’s Format Painter, you can easily copy the formatting from one area of a worksheet to another.
Select what you’d like to replicate, then select the Format Painter option — the paintbrush icon — from the dashboard. The pointer will then display a paintbrush, prompting you to select the cell, text, or entire worksheet to which you want to apply that formatting, as shown below:
Identify duplicate values.
In many instances, duplicate values — like duplicate content when managing SEO — can be troublesome if gone uncorrected. In some cases, though, you simply need to be aware of it.
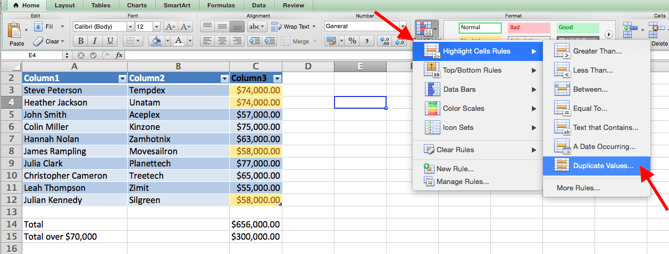
Whatever the situation may be, it’s easy to surface any existing duplicate values within your worksheet in just a few quick steps. To do so, click into the Conditional Formatting option, and select Highlight Cell Rules > Duplicate Values
Using the popup, create the desired formatting rule to specify which type of duplicate content you wish to bring forward.
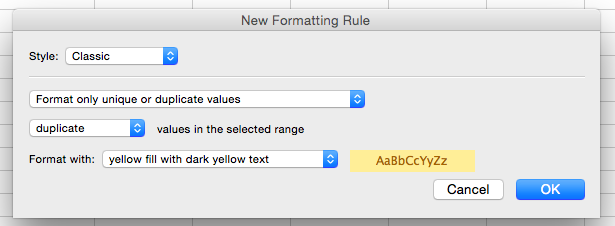
In the example above, we were looking to identify any duplicate salaries within the selected range, and formatted the duplicate cells in yellow.
In marketing, the use of Excel is pretty inevitable — but with these tricks, it doesn’t have to be so daunting. As they say, practice makes perfect. The more you use these formulas, shortcuts, and tricks, the more they’ll become second nature.
To dig a little deeper, check out a few of our favorite resources for learning Excel. Want more Excel tips? Check out this post on how to create a pivot table with medians.

What You Missed at Google’s Marketing Innovations Keynote
Last month, Google let the world know that big changes were coming to its famed AdWords.
Those changes would come in the form of a major rebrand — and what was once AdWords is now a suite of three separate brands: Google Ads, Google Marketing Platform, and Google Ad Manager.
Today, all three took center stage at Google Marketing Live, where the Marketing Innovations keynote went into a bit more detail about these changes — and the purpose they ultimately serve for those who use them.
But it was almost as if today’s key takeaways had more to do with reverberating themes echoed throughout the keynote than the products themselves — things that Google, for some time now, has worked to make synonymous with its name and its brand. Things like machine learning, personalization, and solving for user experience.
Here’s a closer look at some of them.
What You Missed at Google’s Marketing Innovations Keynote
Google Puts Machine Learning Center Stage
Machine learning is what many think of as Google’s “thing.” It plays a major part in what shapes the search algorithm, as well as in the latest updates to Gmail (e.g., smart compose), and it helped to build the controversial Google Duplex: technology that allows Google Assistant to make strikingly human-like calls to make appointments and reservations.
Ads are no exception to Google’s machine learning initiatives. But that’s not new to today’s announcements, as the company announced “Smart display campaigns,” for example, over a year ago.
Still, machine learning is informing the latest generation of Google’s ad- and marketing-focused offerings — and is lending itself, says SVP of Ads and Commerce Sridhar Ramaswamy, to the crucial nexus of assistance and personalization that makes a great ad.
“Ads should add value,” he told the audience.
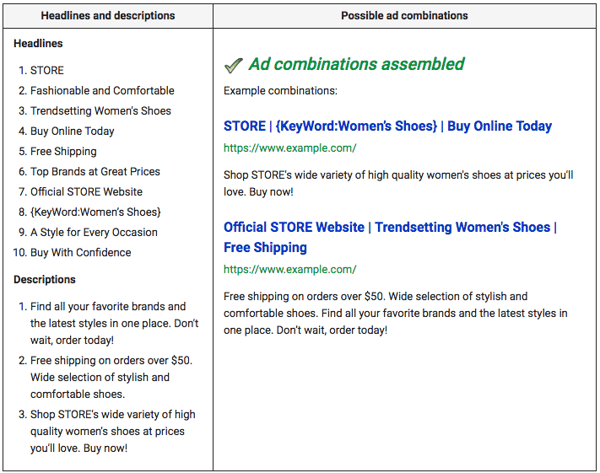
Much of what was announced today takes on the responsibility of helping marketers figure out how to create such valuable ads. Take the concept of responsive search ads, for instance, where advertisers are asked to create a new ad with 15 possible headlines and four description lines.
From there, Google tests different combinations of both, using machine learning to determine which one has the greatest returns for a given search query.
Source: Google
Goal-Oriented Campaigns
Not all ads are created equal.
That’s one reason why their ability to provide value is so crucial — not everyone is searching for the same thing.
That’s a phenomenon that Google has incorporated into its public “principles” of ads — and search, for that matter. And, it’s another place where machine learning comes in: to display the right ad for the right audience, allowing it to provide both the assistance and personalization Ramaswamy alluded to.
But advertisers — and the businesses behind them — all have different intended outcomes, too, that go beyond the bottom line. For brick-and-mortar retailers, for instance, bringing customers through the front door might be a key goal (which Google also said it will address with its new local campaign tools).
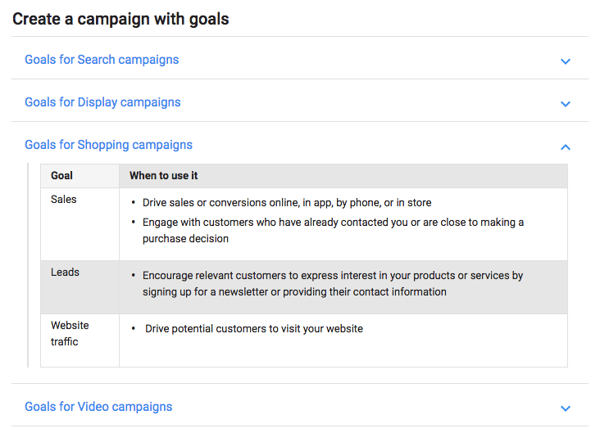
Google today introduced a way to customize various types of campaigns — Search, Display, Shopping, or Video — specifically around an advertiser’s goals.
Machine learning isn’t quite as front-and-center here, but likely has informed the recommendations that Google makes to advertisers when they input these goals — based on what it’s learned historically about consumer behavior.
Source: Google
The Merging of Analytics and Advertising
As valuable as these new tools and the technology behind them might be, it’s equally important to measure the return on any investment made in them.
That’s why there’s often an emphasis on metrics. The ability to determine what caused a customer convert — like a specific ad, for instance — as well as how and why is especially important when something like a funded ad or campaign is concerned.
It also makes sense to be able to have all of that information in one place. And instead of keeping analytics and campaign content in separate silos, Google has introduced Display & Video 360 to synthesizes what used to be such fragmented ad products — such as DoubleClick Bid Manager, Campaign Manager, and Audience Center — into a single product.

Source: Google
Looking Ahead
What really underscored today’s announcements is the ability to address and adapt to the rapid evolution of consumer preferences and behavior — and to know if efforts to do so are working.
Marketers and advertisers are faced with the challenge of achieving an ideal promotional trifecta — of what Google Ads Group Product Manager Philip McDonnell identified as the right product, in front of the right person, at the right time.
That works in tandem with the technology people use to seek information, which Ramaswamy was keen to point out “has been changing at an unrelenting pace.”
It’s why HubSpot Head of SEO Victor Pan, who previously managed multi-million-dollar digital advertising strategies, advises marketers to be patient.
“Google will likely train and retrain its machine learning — based on input from the early adapters among advertisers who work with these tools,” he says. “The technology will only continue to evolve.”
But ultimately, marketers — including those within small-to-midsize businesses — should be able to adapt.
“Google’s trying to demystify machine learning to a larger audience through adoption,” Pan explains. “What better way to do that via Google Ads?”
The full rebrand of Google AdWords into Google Ads is scheduled to take place on July 24th. We’ll be monitoring these changes as they launch, and providing updates on if/how these changes will be reflected within HubSpot.
Featured image source: Google

Personalization Versus Privacy: Making Sense of the Privacy Paradox
With so much competition online, personalized content and appealing to the individual consumer is a key way for businesses to break through the noise.
As customers, we want businesses to know what we want and tailor the content we see accordingly, but when companies appear to have too many insights into our personal affairs it sets alarm bells ringing — and quite frankly freaks us out — making us less likely to engage with the company again for fear of spilling more proverbial beans on our private information.
Whilst on one hand we’re more informed than ever about how marketers may be controlling our personal data, and are more cautious about protecting it. On the other hand, we are still sharing personal information freely online on a daily basis and liberally ticking boxes to agree with pages and pages of terms and conditions that most of the time we haven’t even read …
Welcome to the Privacy Paradox, a term coined to describe the way in which consumers today are torn between their desire for personalized content and their natural instinct to protect their personal information.
Are we signing our lives away?
Whilst the media are always quick to name and shame companies for their questionable use of personal data, consumers have to take a certain level of responsibility for how these companies managed to get their hands on this information in the first place.
In a recent experiment run by two communications professors, a fictitious social media platform was created and people were asked to read the terms and conditions before registering. Only 25% looked at the terms and conditions and 98% of respondents (that includes most of the 25% that claimed to have read through the legislation) signed consent without even noticing that paragraph 2.3.1 of the contract required them to surrender their first-born child to the organization as payment for the free service.
I think it’s safe to assume that this is not a hidden clause we have to be on the lookout for any time soon, however, it does demonstrate how many consumers are likely to be somewhat accountable for personal data leakage simply through disregard for terms and conditions and agreeing to contracts before they know what the relationship entails.
Why are we so generous with what we share?
The question of why we are so forthcoming with our personal information could generate enough discussion for an entire thesis, but ultimately it all boils down to three main factors:
1. We now live in a culture focused on documenting our lives rather than just living them.
When something exciting happens to us, before we even stop to truly enjoy it ourselves we’ve posted it on every social platform we can to make sure the world knows how much fun we’re having. The convenience of having instant access to what’s going on in the world, being able to share stories with all of our friends simultaneously and the ego-trip of seeing ‘likes,’ ‘loves’ and ‘tears of laughter’ when we do share distracts consumers from considering what prying corporate eyes may also be taking note of their activity.
2. Our right to privacy is invisible, inaudible and intangible.
Therefore, when we give it away, we don’t feel like we’re really parting with anything, much like putting those expensive shoes on our credit card and being stung by the interest later.
3. It makes for an easy life.
Smartphones and home working policies have made the nine-to-five shift a thing of the past for many corporate workers, and with those that work part-time often juggling childcare, household jobs, family food shops and trying to squeeze the gym in for good measure, time has become an invaluable asset. As a result, any brand or service that promises to save us time or offers efficiency is hard for consumers to refuse.
Personalization
The Business Perspective
For businesses, there is huge financial opportunity in personalizing content — it’s been suggested that personalization can deliver five to eight times the ROI and boost sales by at least 10% (McKinsey) so it’s understandable why business owners are trying every trick in the book to capitalize on this powerful technique.
Long-term, having access to personal data will enable businesses to elevate their consumers’ experience of their website to a much superior level than their competitors, and therefore the brand will become synonymous with excellent service resulting in more organic traffic.
Mary Meeker’s internet trends report 2018 boldly claims that ‘there’s no need anymore to create generalized content as personalization and local marketing can lead to more successful results.’ However, some marketers are so dazzled by the depth of information that modern technology can unveil, they seem to have over egged the pudding when it comes to personalizing data and need to remember it’s the quality not quantity of customized content that matters.
Data collected by Accenture for their 2016 Personalization Pulse Check report shows that almost two-thirds of consumers who reported a brand experience that was too personal or invasive did so ‘because the brand had information about the consumer that they didn’t share knowingly or directly, such as a recommendation based on a purchase they made with a different business.’
Digital marketers need to apply the same social etiquette as if interacting with their consumer on a real-life, personal level. For instance, a shop assistant will discuss preferences and requirements with a customer in a high-street store in order to better understand their tastes and direct them to the relevant items in the shop to help them make an informed purchase.
However, they will not then follow that customer for the rest of the day recording their shopping activity ready for their next visit, that would be absurd. When we put the concept into a real-life situation, it’s easy to see why many consumers now feel that businesses are crossing the line when it comes to taking advantage of their personal data.
The Consumer Perspective
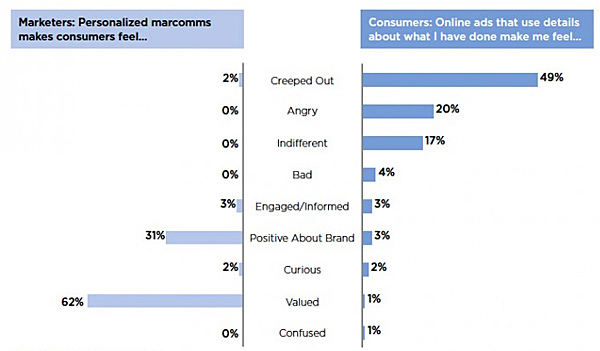
Consumers and businesses are not always on the same page when it comes to the use of personalized content in advertising, as illustrated by CEB’s research below:
(Source)
The fact that almost half of consumers were ‘creeped out’ by the way in which online ads had used their details suggests that they weren’t aware marketers had access to this information. One reason for this is that many consumers don’t truly appreciate what the term ‘personal data’ encompasses and what scraps of information marketers are pulling together to create customized content.
Bank details, addresses and passport numbers are all clearly data we actively protect, but research has shown that most moves we make online can be manipulated to uncover sensitive information that consumers think is secure.
For example, during his talk at TedxGhent 2014, Bram Bonne describes how information sent out by our devices when connected to free public Wi-Fi networks can easily be picked up by others on the same network. So companies could be picking up personal information you are sharing through messenger conversations, emails and websites simply through your use of their free public hotspot.
This type of invasion can be avoided but it relies on the consumer to actively read the privacy policies displayed to them and to ensure the required security tools are in place. This requires effort and more importantly time but, as we know, this is a highly valuable commodity in the modern age so it comes down to what consumers value more: their time or their privacy.
Making Sense of the Privacy Paradox
As terrifying and futuristic as this all sounds, it isn’t really news.
Companies have been tracking customer buying patterns for decades right back to the first supermarket club card scheme, the strategy has just simply evolved with the times and technology. Consumers are becoming increasingly aware that if a company really wanted to control our data, then they could, whether or not they should is another matter.
To exist harmoniously in the Privacy Paradox, both consumers and businesses need to adjust and take responsibility for their actions. Consumers need to start paying attention to what they are agreeing to and change their thought processes to consider the long-term consequences of sharing their personal information with the world wide web, not just the immediate gains.
Likewise, businesses need to start being transparent and practicing some restraint when collecting personal data and only seek information that will enhance the experience of the service they are offering. Less is more, and if consumers feel like a company knows too much about them, they probably do.

The Best B2B Lead Gen Campaigns for Every Channel
Lead generation for B2B is not about chasing a “secret method” that results in a ton of leads. Instead, building the best lead generation strategy for your business is more about understanding tried-and-tested channels, and finding the most effective combination of tactics for your unique goals.
A disciplined B2B marketer should understand the different dynamics, budgets, and expectations typical of each lead generation channel. This article will help you gain insights into each major channel for B2B lead generation, including social media, PPC, blogging, and email. Best of all, we’ll show you effective strategies and impressive real-world examples for each.
Social Media Marketing Strategies
Social media is now a critical component of B2B marketing. It often doesn’t cost much for paid ads compared to traditional advertising costs, but offers broad mileage. However, unlike B2C where social media is among the most effective digital marketing channels, it’s more complicated in the B2B market.
What is the conversion rate of social media?
While there’s no single answer for B2B social media conversion rates, there are some calculated assumptions you can use to gauge efficacy. A Marketo study pegged social media conversion at 1.95%, vs. inbound at 3.82%, after studying more than 4,000 user account’s data.
Anecdotal stories, like the case of SaleCycle, suggest social media falls short in conversion rates compared to other B2B digital channels, despite its wide reach.
Quantity over quality seems to be the norm when it comes to B2B social media lead generation. This makes it an ideal channel for top-of-the-funnel awareness — for instance, you might promote a downloadable ebook to capture quality leads with an initial offer.
There are two main channels you should focus on:
- LinkedIn Ads
- Facebook Lead Ad
Let’s dive into each of these primary B2B social media channels now.
LinkedIn Ads
It’s no surprise that LinkedIn, the go-to B2B social network, has above-the-board figures when it comes to B2B social media conversion. LinkedIn is the top social media platform for B2B marketers, so it’s a viable channel to pursue.

Source: 2016 Content Marketing Institute.
However, investing your energy in a channel with high engagement rates doesn’t automatically guarantee success. The tactics you use on LinkedIn need to:
- Audience targeting based on buyer persona
- Lending to the ad a newsworthy, topical angle
- Continuously testing CTAs, images and copy
You can learn more about the nitty-gritty of LinkedIn Ad strategies from this LinkedIn-HubSpot 2-week free course.
Facebook Lead Ads
You should also integrate Facebook Lead Ads into your social media strategy. A 2017 survey by research firm BCG showed 60% of B2B buyers used mobile in their recent purchases. Additionally, online business queries have been shifting rapidly towards mobile for the past few years.
Since Facebook Lead Ads are designed for lead generation inside the world’s largest social media channel, they’re especially potent. Facebook launched this service in 2015, after their analytics showed users found it difficult to signal to businesses their intent on Facebook mobile. Facebook Lead Ad solves this problem because it allows B2B users to sign up for your offer in just two taps, without leaving the social network. It’s both targeted to your audience and highly customizable.
Facebook Lead Ad isn’t designed to replace your landing pages. AdEspresso found their Landing Pages and Lead Ads had nearly identical cost-per-lead at around $0.94. While Facebook Lead Ad helps you capture leads inside Facebook, your landing pages are still necessary for capturing leads from organic search and PPC.
For more details, check out this step-by-step procedure on how to create Facebook Lead Ads.

Facebook Lead Ad lets your prospects sign up for your offer inside the social media mobile interface.
Examples of Great B2B Social Media Lead Generation Campaigns
Case #1: Use of scarcity and exclusivity. EntreLeadership used scarcity (a limited-time offer) to increase the value of their offer. Their slogan — “Sharing Dave Ramsey’s business wisdom” — rings exclusivity. It’s a chance to gain rarefied insight. Their visual is also engaging, with the use of light colors against a dark background, while the key messages and CTAs are clearly highlighted.

Case #2: Asking for only the data you need. FreeAgent understands asking only for an email address during the first encounter greatly reduces opt-in friction at the early stage. More customer data can be gathered later in the campaign as leads are qualified with more product-specific offers. In the beginning, the email address-only approach guarantees a wider initial lead base.

Case #3: Give before you get. Digital Marketer doesn’t sell — it gives something valuable away for free. That’s a compelling deal. Their image amplifies the message and the CTA is clear but subtle. Instead of selling anything, Digital Marketer simply hooks leads through the law of reciprocity, which makes users feel they should return the favor during a later engagement.

PPC Lead Generation Strategies
Pay-per-click (PPC) lead generation campaigns focus on a wide range of paid advertising platforms — the most popular being Google AdWords and Display Network. However, you’ll find a wide range of PPC lead generation options outside of Google, including:
- B2B review directories or comparison sites
- Trade media display ads
- Social media advertising
- Affiliate marketing
What is the conversion rate in PPC lead generation?
The general consensus for Adwords conversion rate is 2.70%, and Display conversion is averaged at 0.89%. But the rates vary depending on your industry. It’s important to know your industry benchmarks. A good starting point is to ask the PPC vendor of their average conversion ratio across the board. This lets you evaluate your campaign results better.
Should PPC replace organic marketing? No — they complement each other. For instance, many high-value keyword searches have only PPC ads above the fold like this:

In other words, even if you have good organic ranking, it may be buried under PPC ads. Google researchers ran statistical models on their SERPs to find out if paid search eats up organic traffic. The result showed 89% of traffic generated by paid ads isn’t replaced by organic.
An Example of an Efficient PPC Lead Generation Channel
Among the PPC platforms mentioned above, B2B review directories and comparison sites can provide a uniquely fresh lead source. In a crowded industry, other PPC channels are most likely already saturated by big players in your space, the ones with deep pockets.
For instance, in SaaS, a highly competitive industry across verticals, AdWords bidding is highly competitive, so you need to target a lot of relevant keywords. Sometimes competitors even bid for keywords against your own brand — like this example, where Netsuite ranks higher for “Intuit Accounting”.

For many SaaS startups and SMBs, having another lead source like B2B review sites provides the option to meet and even surpass monthly lead quotas. Let’s take a closer look at which popular marketing tools are used for lead generation by such sites. For example, here’s what FinancesOnline, one of the top software review platforms, offers:
1. Lead generation campaigns: The review site can link directly to a vendor’s sign-up landing page, encouraging people who read your review to try out your free-trial next. These campaigns can generate as much as 24% conversion rate.
2. Premium placement: In an increasingly commodified SaaS category, like a CRM where features are more standardized than unique, being included in a premium placement can make or break your sales opportunity. You have a much higher chance of attracting new leads if you’re listed among the most popular solutions, as prospects will usually only try out a few products. Make sure you get on such a list, because your competitors are probably already there.
3. Industry awards: When buyers are comparing your product to your closest competitors’, having your product stand out thanks to a featured quality award can have a critical impact on your sale. FinancesOnline, like many other review platforms, can give your product an edge with such awards.

Here’s how premium positioning on FinancesOnline looks like
It’s important you look for a third-party online marketplace in your industry, and get in touch with these middle-men to ensure your product is listed.
Blogging Lead Generation Strategies
Blogging is at the core of content marketing, which is a strategy that focuses on creating content that is interesting or valuable to your defined audience with the goal of attracting and sustaining online engagement for leads down the road.
A lot has been said about the benefits of business blogging. Let’s reiterate the major advantages that apply to the B2B market:
- Drive traffic to your website. With the right SEO planning and editorial calendar, your blog gives you search presence, linking you to keywords being searched for by your prospects. Every blog post you write is one additional indexed page to get your content on Google.
- Convert traffic to leads. A well-placed CTA in a compelling blog post can direct prospects to your landing page for leads.
- Repeat business. A blog can delight existing customers with fresh content for repeat business or referrals.
How efficient is blogging for B2B?
As part of content marketing, blogging has its advantages. Here are three essential ones you should know:
- Content marketing generates 3x more leads vs. traditional marketing (DemandMetric).
- Businesses using content marketing experience 6x higher conversion rates vs. non-adopters (Aberdeen).
- Custom content influences 61% of consumers (Dragon Search Marketing).
Blogging also establishes niche authority and places prospects within your sphere of influence. We don’t need to go far — just search “inbound marketing” or its derivatives and you’ll come across HubSpot consistently.

How effective is blogging in the long run? At HubSpot, about 90% of the leads their marketing team generates each month come from blog posts that were published in many months or sometimes years ago.
Which content types drive lead generation?
The content types listed below are most effective when they align with your marketing goals. In short, the hard work is still on you — you have to develop topics that are lead magnets to your audience.
- Authoritative posts: Topics you’re an expert in.
- Solid opinion pieces: Insights backed by data.
- Original research: Commissioned for industry consumption.
- How-tos: Tips, tutorials that address prospects’ problems.
- Trending content: Piggybacks on popular topics relevant to your business.
- Infographics: Information turned into digestible visual bits for easy consumption.
- Videos: Did you know 72% of prospects prefer to watch a video than read to learn about a product? (State of Video Marketing Survey, Wyzowl 2017).
Examples of Great B2B Blogging Campaigns
Case #1: Running your blog like a media pro. HubSpot is influential when it comes to inbound marketing. But it didn’t happen by accident — HubSpot’s marketing team works hard to run their blog as a media site with a full editorial calendar and a team of writers and editors manning the front.
HubSpot’s blog publishes tips, listicles, ideas, inspiration, insights, reports, ebooks, white papers, videos, etc. all relating to inbound across its niche segments in marketing, sales and service. The blog even outperforms entrenched business media like Forbes and CNN Money in SERPs about inbound marketing.

Case #2: Know who you’re talking to. FreshBooks is clear about its target audience. In fact, the first step to having great content is to know your audience (your “Ideal Customer” personas). For FreshBooks, this means delivering “actionable insights into all aspects of running a small business.”

Case #3: Banner your thought leader. Have a resident thought leader and put his or her insights and opinions about your business and industry into your blog posts. Your thought leader should be writing regular posts to leverage SEO and brand association, both of which can result in more leads down the road. Even Seth Godin needs to write daily.

Email Marketing Lead Generation Strategies
In a world of posts, likes, and shares, email doesn’t look sexy, but it is as relevant today as it was years ago. In fact, email is often the bridge between marketing automation and CRM, two cloud solutions most widely used by marketers today. The email opt-in is still the starting point of lead generation and email marketing is the core of lead nurturing.
How does email marketing hold up today? Actually, it was the best B2B digital marketing channel in 2014, according to a Chief Marketer study. Two years later, in 2016, DemandWave released its State of B2B Digital Marketing Report, which showed email marketing is right at the top of digital channels driving leads and revenues for U.S. B2B marketers.

The advent of automated lead scoring, predictive analytics and AI algorithms only reinforce email marketing with laser-focused, personalized touches and real-time delivery. In short, email marketing is still one of your best tools to engage intent signals, distribute content and deliver pitches.
What is the conversion rate of email marketing?
You’re looking at two variables when it comes to email marketing:
- Open rate
- Click-through rate (CTR)
A GetResponse study puts the overall email open rate average at 82.20% and CTR at 21.69%. The report further divided the figures by location, with North America at 21.01% (open rate) and 3.50% (CTR). By industry, internet marketing has 18.05% open rate and 3.16% CTR.
Meanwhile, Marketing Insider Group puts email marketing conversion into another perspective: you earn $44 for every dollar spent on email marketing. The general consensus is, yes, email marketing has one of the highest conversion rates, corroborating the DemandWave findings above.
Which factors influence email marketing conversion?
It takes creativity to brainstorm your content or offer, but with that aside, email marketing is more like a science. You can measure it, analyze it, and improve it. Here are the key factors that affect your email marketing conversion rates:
- Value offer: You must have a lead magnet to attract email sign-ups, whether it’s value content, freebies, deals, or anything that is interesting to your audience.
- Landing page: Optimize it by having a clear offer of your lead magnet, compelling CTA, permission and appealing visuals.
- Email subject line: Short, crisp, and compelling with clear benefit to the recipient.
- Segmentation: Split your list into sublists for more targeted messages, which will allow you to increase you open and click-through rates.
- Analytics: Run analytics to do regular clean-up of your lists and update it as necessary based on past recipient actions.
Examples of Great B2B Email Marketing Campaigns
Case #1: Storytelling. At its core, email marketing is about your message, and here’s where your skill in storytelling can weave magic into a bland topic like a business workshop, captivating the prospect’s interest. Perry Marshall, the best-selling author of Ultimate Guide to Google AdWords, is a master of storytelling, able to hook seemingly unrelated subjects together, and all leading to his value offer.

Case #2: Use of humor. The visual allusion to the iconic film character used by Grammarly, the Godfather (and the cat!), is witty and helps engage readers for those few critical seconds. he vendor also uses a funny tweet at the bottom to cap the offer with even more humor. Note that the use of humor is tricky and can backfire if executed poorly; but in this case, it’s tightly woven into the offer’s message.

Case #3: Housekeeping. Email marketing isn’t all about the welcome — some goodbyes are in order, too. Cleaning up your list is one step towards qualifying leads for higher conversions down the funnel. Hire Value makes sure its list is updated by sorting out inactive subscribers.

Top 10 Lead Generation Best Practices
Our brief case studies above didn’t happen by accident, but rather as a result of their marketers’ relentless pursuit of techniques that work efficiently. We’ve highlighted some of these above, but let’s leave you with this checklist on the 10 best practices in lead generation:
- Target the right audience. Know your buyer personas. In B2B, your audience could be different people in different departments. Often, you don’t have an audience, but micro-audiences with varying interests and pain points.
- Create lead magnets. Develop content or offers that pique the interest of your target audience. The best lead magnets use NLP techniques in marketing, such as, clear, tangible benefit, urgency, exclusivity, social proof, authority and immediate gratification.
- Explore new lead channels. Search, social and top media sites are expectedly crowded with high-value sponsorships. You can, however, discover unique PPC channels like the B2B software review site FinancesOnline in our example above, or similar third-party marketplaces for your industry. Because these sites cater to your customers, they tend to have higher conversion rates and dominate high-value general organic search keywords.
- Capture the right information. The rule of thumb is to get only the most basic customer data at the initial stage (e.g. name and email address) and, as you work the lead down the pipeline, ask for a little more data.
- Score, sort, segment leads. Not all leads are valuable and not all have the same value. Based on your metrics, run a lead scoring tool to sort leads into proper segments, which will let you target your micro-audiences with personalized messages and offers. Today’s marketing automation software like HubSpot is very powerful and can automate this important process.
- Blog consistently. Regularly posting content improves your SEO, authority, brand awareness, industry stickiness, and, generally, your web presence.
- Integrate organic and PPC. These two complement each other. When executed together, they can fill in the gaps. For example, you can run paid search for any organic keywords for which you’re not ranking highly.
- Benchmark your conversion rates. Don’t be content with seeing your rates improve month-to-month or year-to-year. Compare them with the competition — that’s the true picture of your business’ competitiveness.
- Automate. The best marketing automation will put your lead generation in auto-mode, by capturing leads from your campaign, scoring them, nurturing them throughout the lead pipeline and qualifying and handing them over to sales.
- Go mobile. Mobile marketing is the next battlefield for B2B leads. More business buyers are using their smartphones in the purchase journey. Make sure your forms, emails, websites, and ads are optimized for mobile.
Those are some of the best B2B lead generation campaigns and techniques at your fingertips. Apply or reapply these time-tested techniques and share with us how much they improve your lead volume

17 Truly Inspiring Company Vision and Mission Statement Examples
Mission Statement Examples
- Life is Good: To spread the power of optimism.
- sweetgreen: To inspire healthier communities by connecting people to real food.
- Patagonia: Build the best product, cause no unnecessary harm, use business to inspire and implement solutions to the environmental crisis.
- American Express: We work hard every day to make American Express the world’s most respected service brand.
- Warby Parker: To offer designer eyewear at a revolutionary price, while leading the way for socially conscious businesses.
- InvisionApp: Question Assumptions. Think Deeply. Iterate as a Lifestyle. Details, Details. Design is Everywhere. Integrity.
- Honest Tea: To create and promote great-tasting, healthy, organic beverages.
- IKEA: To create a better everyday life for the many people.
- Nordstrom: To give customers the most compelling shopping experience possible.
- Cradles to Crayons: Provides children from birth through age 12, living in homeless or low-income situations, with the essential items they need to thrive – at home, at school and at play.
- Universal Health Services, Inc.: To provide superior quality healthcare services that: PATIENTS recommend to family and friends, PHYSICIANS prefer for their patients, PURCHASERS select for their clients, EMPLOYEES are proud of, and INVESTORS seek for long-term returns.
- JetBlue: To inspire humanity – both in the air and on the ground.
- Workday: To put people at the center of enterprise software.
- Prezi: To reinvent how people share knowledge, tell stories, and inspire their audiences to act.
- Tesla: To accelerate the world’s transition to sustainable energy.
- Invisible Children: To end violence and exploitation facing our world’s most isolated and vulnerable communities.
- TED: Spread ideas.
Where does customer loyalty come from?
Think about those brands that you purchase from over and over, even when there are cheaper options out there. Do you usually fly on a particular airline? Do you buy your coffee from the same place every morning? Do you recommend a specific restaurant whenever out-of-towners ask for suggestions?
Often, the reason we stay loyal to brands is because of their values. The best brands strive to combine physical, emotional, and logical elements into one exceptional customer (and employee) experience.
When you successfully create a connection with your customers and employees, many of them might stay loyal for life — and you’ll have the chance to increase your overall profitability while building a solid foundation of brand promoters.
But achieving that connection is no easy task. The companies that succeed are ones that stay true to their core values over the years and create a company that employees and customers are proud to associate with.
That’s where company vision and mission statements come in. A mission statement is intended to clarify the “what” and “who” of a company, while a vision statement adds the “why” and “how” as well. As a company grows, its objectives and goals may change. Therefore, vision statements should be revised as needed to reflect the changing business culture as goals are met.
Check out some of the following company vision and mission statements for yourself — and get inspired to write one for your brand.
The Difference Between a Company’s Mission and Vision
Let’s start with a bit of a vocabulary lesson. A mission statement declares an organization’s purpose, or why it exists. That often includes a general description of the organization, its function, and its objectives.
A mission statement often informs the vision statement, which describes where the company aspires to be in the future. These two statements are often combined to clearly define the organization’s reason for existing and outlook for internal and external audiences like employees, partners, board members, consumers, and shareholders.
So, what does a good mission and vision statement look like? Have a look at the examples below.
17 of the Best Vision & Mission Statement Examples From Real Companies
1. Life Is Good: To spread the power of optimism.
The Life is Good brand is about more than spreading optimism — although, with uplifting T-shirt slogans like “Seas The Day” and “Forecast: Mostly Sunny,” it’s hard not to crack a smile.
There are a ton of T-shirt companies in the world, but Life is Good’s mission sets itself apart with a mission statement goes beyond fun clothing: to spread the power of optimism. This mission is perhaps a little unexpected if you’re not familiar with the company’s public charity: How will a T-shirt company help spread optimism? Life is Good answers that question below the fold, where what the mission means is explained in more detail, with links to programs implemented to support it: its #GrowTheGood initiative and the Life is Good Kids Foundation page. We really like how lofty yet specific this mission statement is — it’s a hard-to-balance combination.
2. sweetgreen: To inspire healthier communities by connecting people to real food.
Notice that sweetgreen’s mission is positioned to align with your values — not just written as something the brand believes. We love the inclusive language used in its statement, letting us know that the company is all about connecting its growing network of farmers growing healthy, local ingredients with us — the customer — because we’re the ones who want more locally grown, healthy food options.
The mission to connect people is what makes this statement so strong. And that promise has gone beyond sweetgreen’s website and walls of its food shops: The team has made strides in the communities where it’s opened stores as well. Primarily, it provides education to young kids on healthy eating, fitness, sustainability, and where food comes from. The sweetlife music festival attracts 20,000 like-minded people every year who come together to listen to music, eat healthy food, and give back to a cause — the sweetgreen in schools charity partner, FoodCorps.
3. Patagonia: Build the best product, cause no unnecessary harm, use business to inspire and implement solutions to the environmental crisis.

Patagonia’s mission statement combines both the values that bring them market success (building safe, high-quality products) and the values that contribute to a better world (philanthropic efforts to help the environment). For the people behind the brand, “a love of wild and beautiful places demands participation in the fight to save them.” In the name of this cause, the company donates time, services, and at least 1% of its sales to hundreds of grassroots environmental groups around the world.
If your company has a similar focus on growing your business and giving back, think about talking about both the benefit you bring to customers and the value you want to bring to a greater cause in your mission statement.
4. American Express: We work hard every day to make American Express the world’s most respected service brand.

Customers will never love a company until the employees love it first.
— Simon Sinek (@simonsinek)
April 16, 2014
The tweet above is from Simon Sinek, and it’s one that we repeat here at HubSpot all the time. American Express sets itself apart from other credit card companies in its list of values, with an ode to great customer service, which is something it’s famous for.
We especially love the emphasis on teamwork and supporting employees, so that the people inside of the organization can be in the best position to support their customers.
5. Warby Parker: To offer designer eyewear at a revolutionary price, while leading the way for socially conscious businesses.
Speaking of quirky, this “objective” statement from Warby Parker uses words that reflect a young and daring personality: “rebellious,” “revolutionary,” “socially-conscious.” In one sentence, the brand takes us back to the root of why it was founded while also revealing its vision for a better future.
The longer-form version of the mission reads: “We believe that buying glasses should be easy and fun. It should leave you happy and good-looking, with money in your pocket,” which further shows how Warby Parker doesn’t hold back on letting its unique personality shine through. Here, the missions statement’s success all comes down to spot-on word choice.
6. InvisionApp: Question Assumptions. Think Deeply. Iterate as a Lifestyle. Details, Details. Design is Everywhere. Integrity.

These days, it can seem like every B2B company page looks the same — but InvisionApp has one of the cooler company pages I’ve seen. Scroll down to “Our Core Values,” and hover your mouse over any of the icons, and you’ll find a short-but-sweet piece of the overall company mission under each icon. We love the way the statements are laid out under each icon. Each description is brief, authentic, and business babble-free — which makes the folks at InvisionApp seem like trustworthy, B.S.-free types.
7. Honest Tea: To create and promote great-tasting, healthy, organic beverages.

Honest Tea’s mission statement begins with a simple punch line connoting its tea is real, pure, and therefore not full of artificial chemicals. The brand is speaking to an audience that’s tired of finding ingredients in its tea that can’t be pronounced, and have been searching for a tea that’s exactly what it says it is.
Not only does Honest Tea have a punny name, but it also centers its mission around the clever company name. For some time, the company even published a Mission Report each year in an effort to be “transparent about our business practices and live up to our mission to seek to create and promote great-tasting, healthier, organic beverages.”
8. IKEA: To create a better everyday life for the many people.
The folks at IKEA dream big. The vision could have been one of beautiful, affordable furniture, but instead, it’s to make everyday life better for its customers. It’s a partnership: IKEA finds deals all over the world and buys in bulk, then we choose the furniture and pick it up at a self-service warehouse.
“Our business idea supports this vision … so [that] as many people as possible will be able to afford them,” the brand states.
Using words like “as many people as possible” makes a huge company like IKEA much more accessible and appealing to customers.
9. Nordstrom: “To give customers the most compelling shopping experience possible.
When it comes to customer commitment, not many companies are as hyper-focused as Nordstrom is. Although clothing selection, quality, and value all have a place in the company’s mission statement, it’s crystal clear that it’s all about the customer: “Nordstrom works relentlessly to give customers the most compelling shopping experience possible.”
If you’ve ever shopped at a Nordstrom, you’ll know the brand will uphold the high standard for customer service mentioned in its mission statement, as associates are always roaming the sales floors, asking customers whether they’ve been helped, and doing everything they can to make the shopping experience a memorable one.
10. Cradles to Crayons: Provides children from birth through age 12, living in homeless or low-income situations, with the essential items they need to thrive – at home, at school and at play.

Cradles to Crayons divided its mission and model into three sections that read like a game plan: The Need, The Mission, and The Model. The “rule of three” is a powerful rhetorical device called a tricolon that’s usually used in speechwriting to help make an idea more memorable. A tricolon is a series of three parallel elements of roughly the same length — think “I came; I saw; I conquered.”
11. Universal Health Services, Inc.: To provide superior quality healthcare services that: PATIENTS recommend to family and friends, PHYSICIANS prefer for their patients, PURCHASERS select for their clients, EMPLOYEES are proud of, and INVESTORS seek for long-term returns.

A company thrives when it pleases its customers, its employees, its partners, and its investors — and Universal Health Services endeavors to do just that, according to its mission statement. As a health care service, it specifically strives to please its patients, physicians, purchasers, employees, and investors. We love the emphasis on each facet of the organization, by capitalizing the font and making it red for easy skimming.
12. JetBlue: To inspire humanity – both in the air and on the ground.

JetBlue’s committed to its founding mission through lovable marketing, charitable partnerships, and influential programs — and we love the approachable language used to describe these endeavors. For example, the brand writes how it “set out in 2000 to bring humanity back to the skies.”
For those of us who want to learn more about any of its specific efforts, JetBlue’s provided details on the Soar With Reading program, its partnership with KaBOOM!, the JetBlue Foundation, environmental and social reporting, and so on. It breaks down all these initiatives really well with big headers, bullet points, pictures, and links to other webpages visitors can click to learn more. Finally, it ends with a call-to-action encouraging website visitors volunteer or donate their TrueBlue points.
13. Workday: To put people at the center of enterprise software.
Workday, a human resources (HR) task automation service, doesn’t use its mission statement to highlight the features of its product or how it intends to help HR professionals improve in such-and-such a way.
Instead, the business takes a stance on the state of enterprise software in general: There’s a lot of great tech out there. But at Workday, it revolves around the people. We love how confident yet kind this mission statement is. It observes the state of its industry — which Workday believes lacks a human touch — and builds company values around it.
14. Prezi: To reinvent how people share knowledge, tell stories, and inspire their audiences to act.
If you know Prezi, you know how engaging it can make your next business presentation look. According to its mission statement, the company’s clever slide animations and 3-dimensional experience aren’t just superficial product features. With every decision Prezi makes, it’s all about the story you tell and the audience that story affects.
15. Tesla: To accelerate the world’s transition to sustainable energy.
A car company’s punny use of the word “accelerate” is just one reason this mission statement sticks out. The main reason Tesla makes this list is because of how its mission statement describes the industry.
It may be a car company, but Tesla’s main interest isn’t just automobile sales — it’s promoting sustainable energy. And sustainable energy still has a “long road” ahead of it (pun intended) — hence the world’s “transition” into this market.
Ultimately, a mission statement that can admit to the industry’s immaturity is exactly what gets customers to root for it. And Tesla does that nicely.
16. Invisible Children: To end violence and exploitation facing our world’s most isolated and vulnerable communities.
Tenacity is hard to come by in the non-profit sector, and that’s what makes this mission statement so distinguished. Invisible Children is a non-profit that raises awareness around the violence affecting communities across Central Africa, and the company takes quite a confident tone in its mission.
The most valuable quality of this mission statement is that it has an end goal. Many companies’ visions and missions are intentionally left open-ended so that the business might always be needed by the community. Invisible Children, on the other hand, wants to “end” the violence facing African families. It’s an admirable mission that all businesses — not just non-profits — can learn from when trying to motivate their customers.
17. TED: Spread ideas.
We’ve all seen TED Talks online before. Well, the company happens to have one of the most succinct mission statements out there.
TED, which stands for “Technology Education and Design,” has a two-word mission statement that shines through in every Talk you’ve seen the company publish on the internet. That mission statement: “Spread ideas.” Sometimes, the best way to get an audience to remember you is to zoom out as far as your business’s vision can go. What do you really care about? TED has recorded some of the most famous presentations in the world, but in the grand scheme of things, all it wants is to spread ideas around to its viewers.
Here are 22 companies with really catchy slogans and brand taglines.