How to Generate Leads on LinkedIn in 2023, According to LinkedIn’s VP of Marketing
LinkedIn is an incredibly powerful platform for growing both recognition and revenue as a B2B business.
In fact, audiences exposed to brand messages on LinkedIn are 6X more likely to convert, according to data from the social company.
But without a clear strategy in mind, the task of lead generation on LinkedIn can feel challenging. Which is why I sat down with Jim Habig, VP of Marketing at LinkedIn, to learn some of his key insights, as well as additional tips on how to use LinkedIn for lead generation in 2023 and beyond.
Skip to:
- 8 Tips for Generating Leads on LinkedIn in 2023
- The Most Effective Content for Generating Leads on LinkedIn, According to LinkedIn’s VP of Marketing
- What Marketers Get Wrong When It Comes to LinkedIn for Lead Gen
![Free Guide: How to Use LinkedIn for Business, Marketing, and Networking [Download Now]](https://no-cache.hubspot.com/cta/default/53/ddd33609-1733-44d2-a811-a5435b201ffe.png)
LinkedIn Lead Generation Strategy
As a refresher, lead generation refers to all of the activities and strategies you use to attract potential customers. Generating leads is important because, with nurturing, potential customers can become paying customers that use your products and drive revenue.
LinkedIn’s typical audience comprises professional decision-makers with purchasing power, helping you speak directly to the potential customers that can become paying customers. Below, we’ll discuss how you can use LinkedIn for lead generation.
1. Make sure your executives have a strong LinkedIn presence.
When you’re first getting started on LinkedIn, it can be tricky to know how to dedicate your initial efforts. Should you create a compelling LinkedIn Page and immediately begin posting content to your business’s feed? Or should you start by posting all your job openings to attract new talent?
Habig agrees that it’s critical to optimize your company Page to make a strong first impression. He encourages marketers to ensure their Page is complete and up-to-date with relevant information like a business description, logo, website URL, and industry.
However, an often overlooked opportunity to generate leads falls on individual employees’ pages.
As Habig puts it, “You’ll want to encourage your leadership teams and employees to have well-crafted personal profiles with professional headshots, descriptive headlines, and detailed job experiences.
He adds, “A consistent brand presence builds credibility, attracts the right audience and fosters trust among potential leads.”
Consider the leaders at your company and their current LinkedIn presence. Could they contribute more thoughtfully to LinkedIn groups within your industry or post more often to their feeds? More likely than not, your executives could be doing more to grow their LinkedIn following.
For instance, let’s take a look at HubSpot CEO Yamini Rangan’s recent LinkedIn post:
Rangan uses LinkedIn wisely, leveraging the platform to share helpful, relevant content geared towards business leaders. Rangan uses LinkedIn to build a personal brand and help her followers find valuable content related to business growth. Ideally, your executives should be doing the same.
2. Create a powerful LinkedIn Page for your business.
Once you’ve ensured your own executives have a strong LinkedIn presence, it’s time to cultivate an impressive Page for your business.
You’ll want to ensure your page is active, with thought-provoking content and contributions to conversations already happening on LinkedIn.
LinkedIn Pages is a free product that can help your company build visibility on the platform. It’s also a key Page to house your brand’s thought leadership content, such as videos, commentary from executives, and curated information from other sources.
Take a look at LinkedIn Company Pages: The Ultimate Guide [+ 12 Best Practices] to learn more.
3. Post relevant content and engage with your audience.
To ensure your LinkedIn page and profile are strong, consider posting various content types, including video. Featuring this industry-relevant content can help you position yourself as a knowledgeable source and establish relevance and credibility with potential customers.
As Habig puts it, “Creating and sharing high-quality content tailored to your target audience’s interests is key to driving engagement and generating leads. Share a mix of content types — like blog posts, infographics, case studies, and videos to keep your audience engaged.”
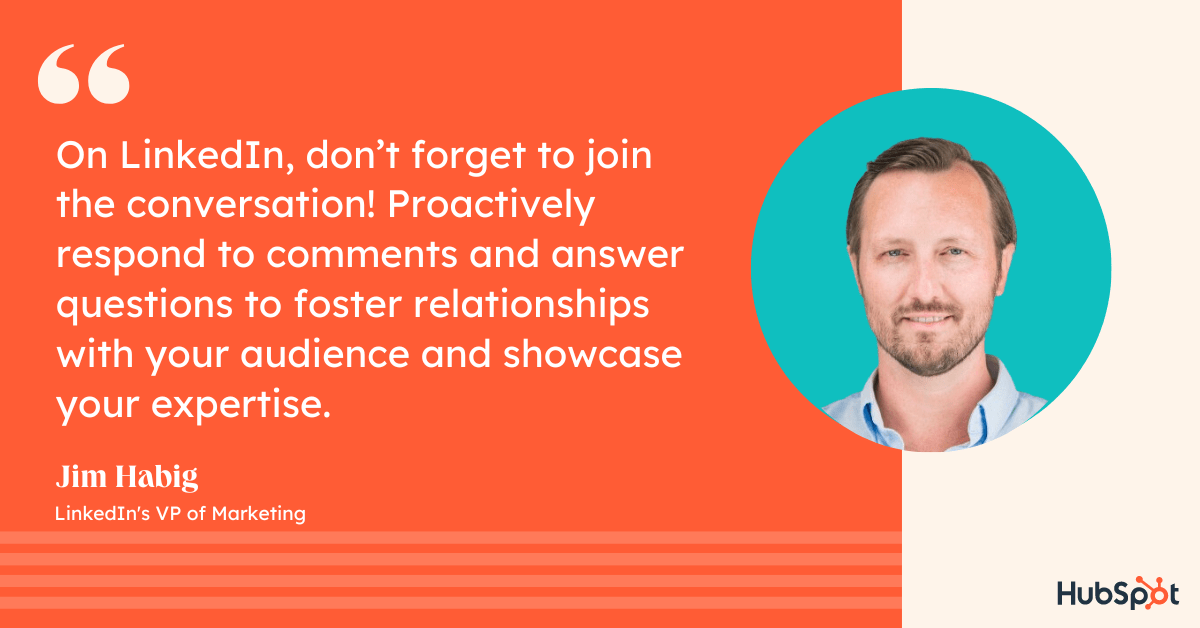
He continues, “And don’t forget to join the conversation! Proactively respond to comments and answer questions to foster relationships with your audience and showcase your expertise.”
When you’re recognized as an insightful, valuable source, you’ll begin to develop connections with like-minded professionals that fit your ideal customer profile. If you post often, you’ll become a regular on their feed, and familiarity makes it easier to initiate further conversations.
If you assume that the connections you have on LinkedIn are professionals within your industry, they can expose you to new audiences with the content you post. When your connections click ‘Like’ on a post you’ve made, it may show up on the feed of a new lead. This lead will see that your shared connection has liked your post, vouching for your credibility and authority, and possibly prompting them to send a request to connect.
To ensure that you’re creating content that people want to see, follow your page analytics to figure out what resonates with them the most and create accordingly.
4. Join LinkedIn groups your clients and customers are in.
LinkedIn, at its core, is a social platform like any other. Just as you can on Facebook, users can create groups centered around industry-relevant interests, and you should join these groups and have conversations with other professionals.
You can post content and updates to encourage discussions about relevant topics or simply talk about the services you offer. If you’ve joined groups wisely, your potential customers can see what you say and begin to recognize you as a source of valuable information.
You can also use groups to learn more about your audience. If members are active, learn from what they say and discover common industry pain points and how leads want these issues addressed. Use this information to your advantage, and create hyper-targeted value propositions when you reach out that speak directly to your customer’s needs.
5. Use LinkedIn Ads and Sponsored Content to ensure your content reaches your intended audience.
Businesses with small marketing budgets may be wary of putting money behind paid campaigns on LinkedIn. They often ask — We have a small marketing budget, and we want to use it wisely. Where should we spend it? Given that LinkedIn is the top paid and organic channel for B2B businesses, spending your money on the platform would be worth your while.
Habig suggests, “Consider using LinkedIn’s advertising and sponsored content solutions to reach the right audience based on factors like job title, industry and company size.”
He adds, “You’ll want to utilize sponsored content to promote your top-performing posts or lead generation forms to capture valuable lead information. Try testing various ad formats like sponsored InMail, carousel ads, and lead gen forms to identify which works best for your target audience.”
In particular, Habig believes the LinkedIn Lead Gen Forms is one of the platform’s most powerful offerings for lead generation.
He told me, “LinkedIn Lead Gen Forms streamline lead generation by auto-populating users’ LinkedIn profile information when they click on your ad. This simplifies the process for users, allowing them to submit their information with ease and boosting lead generation efficiency. Furthermore, the collected data can be effortlessly synchronized with your CRM system.”
Additionally, it’s important to note other native content features — such as articles and polls — can help you increase engagement with your audience.
While LinkedIn has a native ads management service, you can also use HubSpot’s ads management tool to create, organize, and execute advertising campaigns on LinkedIn. You’ll also get access to high-quality reports that explain ad performance, helping you optimize a strategy to meet your customers’ needs.
6. Ensure you have strong sales and marketing alignment.
You’re likely all too familiar with the recent shift in consumer buying behavior. Nowadays, customers are researching online ahead of time and typically use marketing content to inform their purchasing decisions before even reaching out to a sales rep.
With savvier consumers, it is now critical that marketers meet the needs of consumers who are further along the buyer’s journey and then seamlessly hand them off to sales so sales has the context on which stage of the buyer’s journey the consumer is at.
Additionally, many salespeople know the target customer better than anyone, so leveraging sales reps’ knowledge when creating marketing materials is vital.
All of which is to say — it’s critical you align your sales and marketing teams since they play equally valuable parts in finding prospects and closing deals, and they overlap more heavily now than ever before.
To figure out strategies for better aligning your sales and marketing departments, take a look at this Ultimate Guide to Sales and Marketing.
7. Leverage connections with current customers and clients.
LinkedIn’s main draw is networking, and you should use this feature to your advantage for lead generation.
Connect with current customers and clients on LinkedIn and learn from who their industry connections are, as they may be relevant to you as well. If you have relationships with existing clients you connect with, ask for referrals, references, or simply learn how to get in contact with a connection they have that matches your customer profile.
As LinkedIn is a professional network, such requests are less pushy, spammy, and salesesque than cold calling someone after finding their number online. Leads can receive your request to connect, browse your profile, and see your shared connection as a guarantee of trust.
In addition, when you connect with new leads, you’re using warm outreach. This means that you already know a bit about them and can immediately make propositions that relate to their interests, providing value to them off the bat.
8. Maintain a consistent presence on the platform.
Just like all of your other social media sites, LinkedIn requires consistency. If you post an article once a week and then log out, you’re not establishing yourself as a consistent presence with your connections. You also want to communicate consistently with your leads. Disappearing in the middle of a conversation is not a good look and does the opposite of furthering their interest in doing business with you.
Additionally, to ensure you’re reaching the right audiences, consider leveraging LinkedIn Matched Audiences to retarget website visitors.
Habig says, “LinkedIn offers advanced targeting capabilities to help you connect with your ideal audience. With LinkedIn Matched Audiences, you can retarget website visitors, create contact-based audiences using email lists or CRM data, or build account-based audiences by targeting specific companies. This feature enables you to engage people who have already shown interest in your business or are more likely to be interested.”
He adds, “For newcomers to LinkedIn or those seeking guidance on setting up targeting, consider using LinkedIn’s pre-built audience templates. These templates simplify the process and cater to various audiences, such as doctors, recent college graduates, millennials and more.”
As mentioned above, use platform analytics to learn about your audience’s interests, when your posts get the most traction, and create a strategy that will keep you consistently present and visible on LinkedIn.
The Most Effective Content for Generating Leads on LinkedIn, According to LinkedIn’s VP of Marketing
When asked which content Habig believes performs best on LinkedIn when it comes to generating leads, Habig told me two major types of content typically win out: educational, and thought leadership.
As he puts it, “There’s a delicate balance between offering what I’ll call practical content geared towards the practitioners and presenting forward-thinking thought leadership. Both are essential for capturing the attention of your prospects and customers.”
Habig continues, “Providing educational content — such as how-to guides, case studies, whitepapers and e-books — positions your brand as a ‘helpful teammate’ that your audience can rely on for support and expertise.”
On the flip side, you don’t want to ignore the potential power of thought leadership, either.
Habig says, “It’s crucial to incorporate thought leadership, demonstrating that you’re in tune with the industry’s trajectory. According to recent research conducted in collaboration with Edelman, 50% of C-suite executives say that high quality thought leadership has ,more impact on their purchase decision-making during economic downturns than when times are good.”
Of course, you’ll want to assess your own content analytics to determine what performs best with your own audience. But consider testing these new formats — if you haven’t already — and see how they do.
What Marketers Get Wrong When It Comes to LinkedIn for Lead Gen
Finally, I had to ask: What is the biggest mistake marketers make when it comes to LinkedIn lead gen strategies?
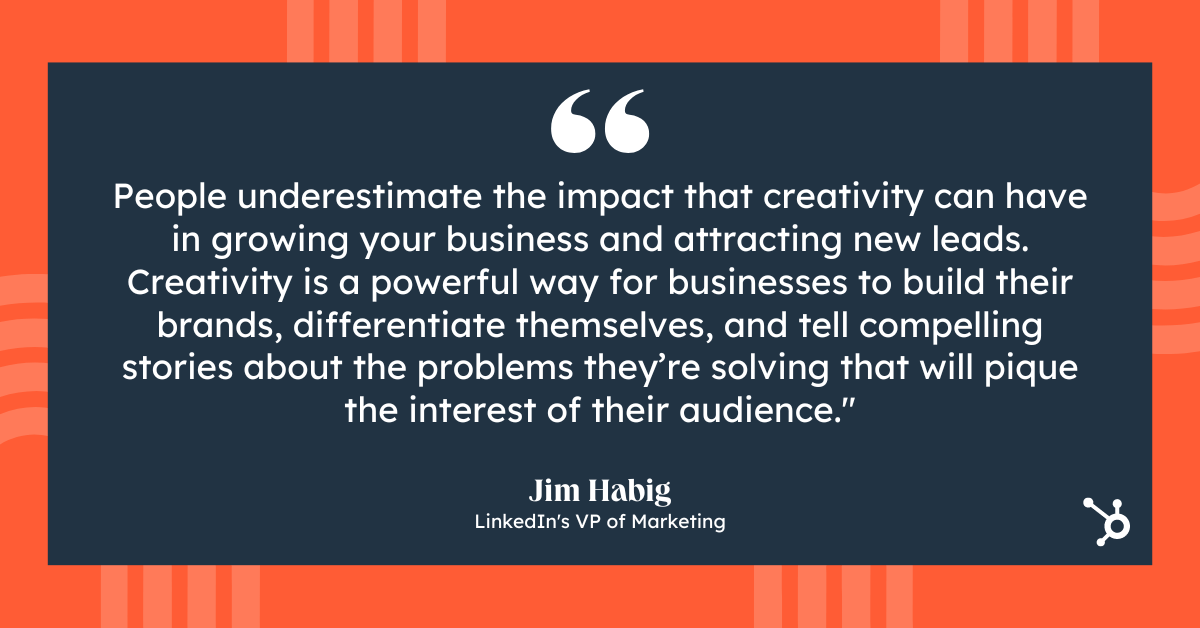
Habig had a straightforward answer: “People underestimate the impact that creativity can have in growing your business and attracting new leads. In a recent report, we found that 69% of people said B2B purchasing is just as emotionally driven as B2C. Creativity is a powerful way for businesses to build their brands, differentiate themselves, and tell compelling stories about the problems they’re solving that will pique the interest of their audience.”
Which is good news for most marketers — who likely got into marketing for the storytelling in the first place.
![]()
11 A/B Testing Examples From Real Businesses
Whether you’re looking to increase revenue, sign-ups, social shares, or engagement, A/B testing and optimization can help you get there.
But for many marketers out there, the tough part about A/B testing is often finding the right test to drive the biggest impact — especially when you’re just getting started. So, what’s the recipe for high-impact success?

Truthfully, there is no one-size-fits-all recipe. What works for one business won’t work for another — and finding the right metrics and timing to test can be a tough problem to solve. That’s why you need inspiration from A/B testing examples.
In this post, let’s review how a hypothesis will get you started with your testing, and check out excellent examples from real businesses using A/B testing. While the same tests may not get you the same results, they can help you run creative tests of your own.
A/B Testing Hypothesis Examples
A hypothesis can make or break your experiment, especially when it comes to A/B testing. When creating your hypothesis, you want to make sure that it’s:
- Focused on one specific problem you want to solve or understand
- Able to be proven or disproven
- Focused on making an impact (bringing higher conversion rates, lower bounce rate, etc.)
When creating a hypothesis, following the “If, then” structure can be helpful, where if you changed a specific variable, then a particular result would happen.
Here are some examples of what that would look like in an A/B testing hypothesis:
- Shortening contact submission forms to only contain required fields would increase the number of sign-ups.
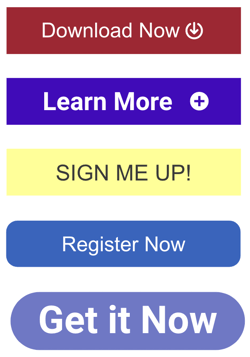
- Changing the call-to-action text from “Download now” to “Download this free guide” would increase the number of downloads.
- Reducing the frequency of mobile app notifications from five times per day to two times per day will increase mobile app retention rates.
- Using featured images that are more contextually related to our blog posts will contribute to a lower bounce rate.
- Greeting customers by name in emails will increase the total number of clicks.
Let’s go over some real-life examples of A/B testing to prepare you for your own.
A/B Testing Examples
Website A/B Testing Examples
1. HubSpot Academy’s Homepage Hero Image
Most websites have a homepage hero image that inspires users to engage and spend more time on the site. This A/B testing example shows how hero image changes can impact user behavior and conversions.
Problem
Based on previous data, HubSpot Academy found that out of more than 55,000 page views, only .9% of those users were watching the video on the homepage. Of those viewers, almost 50% watched the full video.
Chat transcripts also highlighted the need for clearer messaging for this useful and free resource.
That’s why the HubSpot team decided to test how clear value propositions could improve user engagement and delight.
A/B Test Method
HubSpot used three variants for this test, using HubSpot Academy conversion rate (CVR) as the primary metric. Secondary metrics included CTA clicks and engagement.
Variant A was the control.
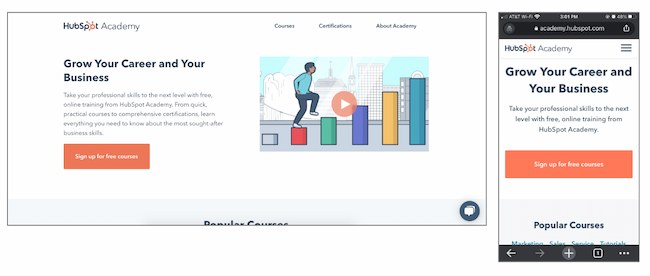
For variant B, the team added more vibrant images and colorful text and shapes. It also included an animated “typing” headline.
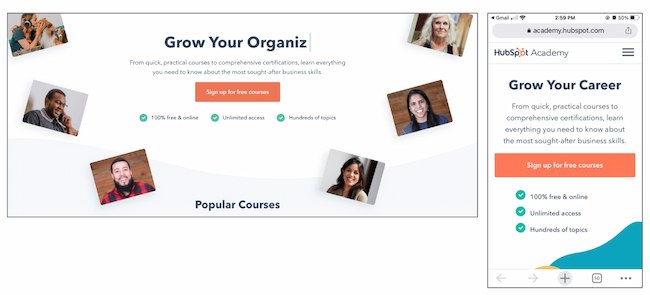
Variant C also added color and movement, as well as animated images on the right-hand side of the page.
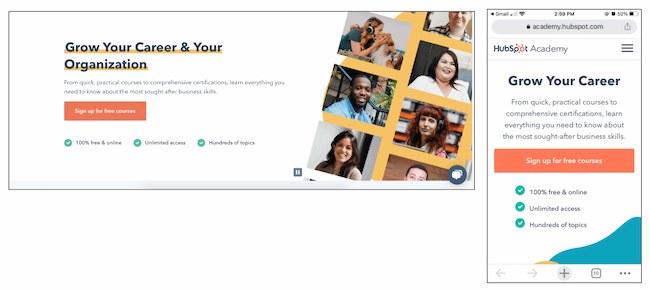
Results
As a result, HubSpot found that variant B outperformed the control by 6%. In contrast, variant C underperformed the control by 1%. From those numbers, HubSpot was able to project that using variant B would lead to about 375 more sign ups each month.
2. FSAstore.com’s Site Navigation
Every marketer will have to focus on conversion at some point. But building a website that converts is tough.
Problem
FSAstore.com is an ecommerce company supplying home goods for Americans with a flexible spending account.
This useful site could help the 35 million+ customers that have an FSA. But the website funnel was overwhelming. It had too many options, especially on category pages. The team felt that customers weren’t making purchases because of that issue.
A/B Test Method
To figure out how to appeal to its customers, this company tested a simplified version of its website. The current site included an information-packed subheader in the site navigation.
To test the hypothesis, this A/B testing example compared the current site to an update without the subheader.
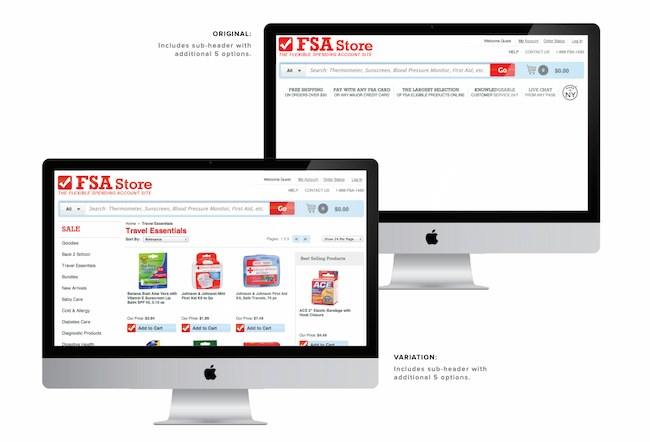
Results
This update showed a clear boost in conversions and FSAstore.com saw a 53.8% increase in revenue per visitor.
3. Expoze’s Web Page Background
The visuals on your web page are important because they help users decide whether they want to spend more time on your site.
In this A/B testing example, Expoze.io decided to test the background on its homepage.
Problem
The website home page was difficult for some users to read because of low contrast. The team also needed to figure out how to improve page navigation while still representing the brand.
A/B Test Method
First, the team did some research and created several different designs. The goals of the redesign were to improve the visuals and increase attention to specific sections of the home page, like the video thumbnail.
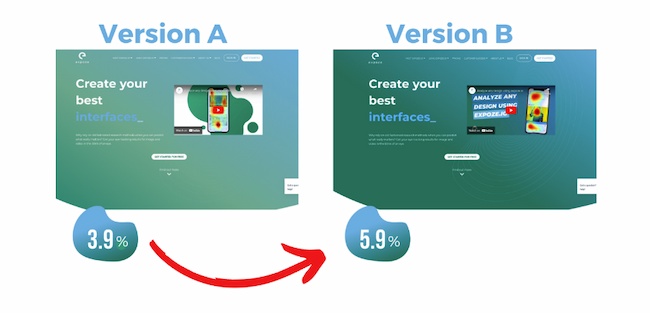
They used AI-generated eye tracking as they designed to find the best designs before A/B testing. Then they ran an A/B heatmap test to see whether the new or current design got the most attention from visitors.
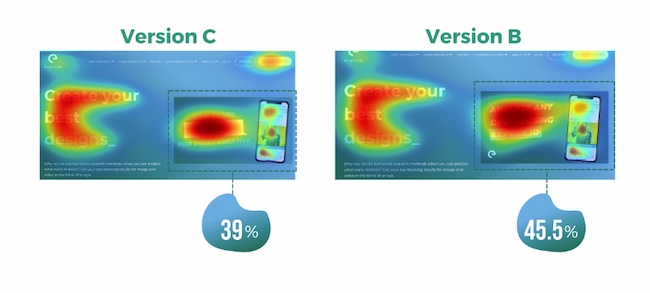
Results
The new design showed a big increase in attention, with version B bringing over 40% more attention to the desired sections of the home page.
This design change also brought a 25% increase in CTA clicks. The team believes this is due to the added contrast on the page bringing more attention to the CTA button, which was not changed.
4. Thrive Themes’ Sales Page Optimization
Many landing pages showcase testimonials. That’s valuable content and it can boost conversion.
That’s why Thrive Themes decided to test a new feature on its landing pages — customer testimonials.
Problem
In the control, Thrive Themes had been using a banner that highlighted product features, but not how customers felt about the product.
The team decided to test whether adding testimonials to a sales landing page could improve conversion rates.
A/B Test Method
In this A/B test example, the team ran a 6-week test with the control against an updated landing page with testimonials.
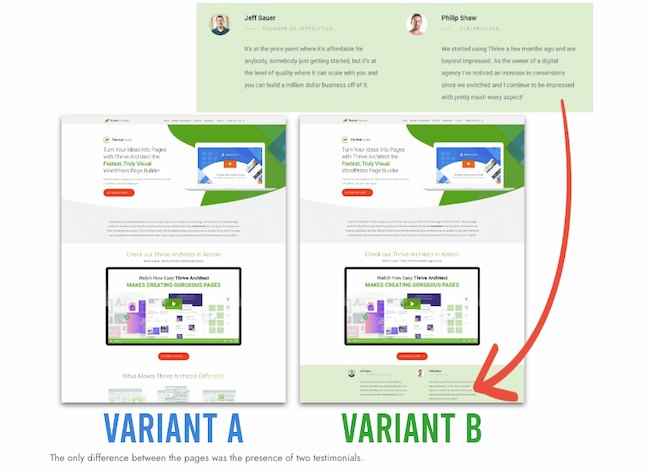
Results
This change netted a 13% increase in sales. The control page had a 2.2% conversion rate, but the new variant showed a 2.75% conversion rate.
Email A/B Testing Examples
5. HubSpot’s Email Subscriber Experience
Getting users to engage with email isn’t an easy task. That’s why HubSpot decided to A/B test how alignment impacts CTA clicks.
Problem
HubSpot decided to change text alignment in the weekly emails for subscribers to improve the user experience. Ideally, this improved experience would result in a higher click rate.
A/B Test Method
For the control, HubSpot sent centered email text to users.
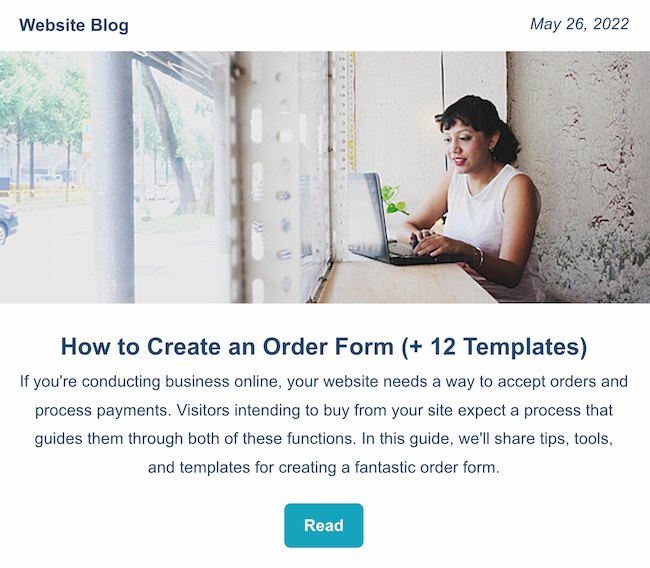
For variant B, HubSpot sent emails with left-justified text.
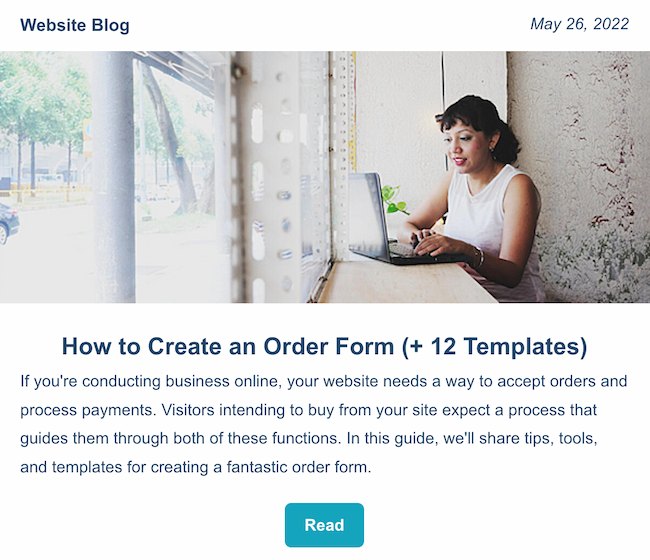
Results
HubSpot found that emails with left-aligned text got fewer clicks than the control. And of the total left-justified emails sent, less than 25% got more clicks than the control.
6. Neurogan’s Deal Promotion
Making the most of email promotion is important for any company, especially those in competitive industries.
This example uses the power of current customers for increasing email engagement.
Problem
Neurogan wasn’t always offering the right content to its audience and it was having a hard time competing with a flood of other new brands.
A/B Test Method
An email agency audited this brand’s email marketing, then focused efforts on segmentation. This A/B testing example starts with creating product-specific offers. Then, this team used testing to figure out which deals were best for each audience.
Results
These changes brought higher revenue for promotions and higher click rates. It also led to a new workflow with a 37% average open rate and a click rate of 3.85%.
For more on how to run A/B testing for your campaigns, check out this free A/B testing kit.
Social Media A/B Testing Examples
7. Vestiaire’s TikTok Awareness Campaign
A/B testing examples like the one below can help you think creatively about what to test and when. This is extra helpful if your business is working with influencers and doesn’t want to impact their process while working toward business goals.
Problem
Fashion brand Vestaire wanted help growing the brand on TikTok. It was also hoping to increase awareness with Gen Z audiences for its new direct shopping feature.
A/B Test Method
Vestaire’s influencer marketing agency asked eight influencers to create content with specific CTAs to meet the brand’s goals. Each influencer had extensive creative freedom and created a range of different social media posts.
Then, the agency used A/B testing to choose the best-performing content and promoted this content with paid advertising.
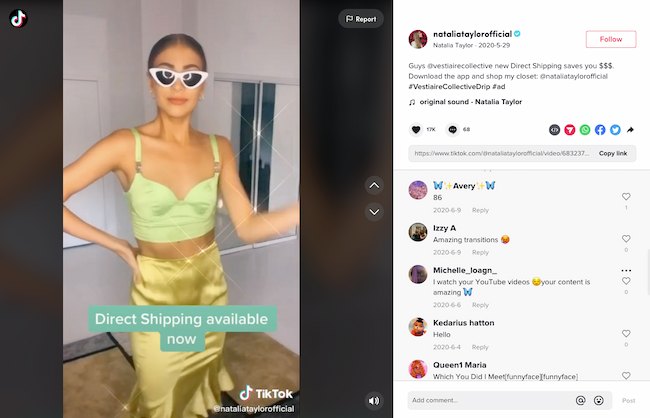
Results
This testing example generated over 4,000 installs. It also decreased the cost per install by 50% compared to the brand’s existing presence on Instagram and YouTube.
8. Underoutfit’s Promotion of User-Generated Content on Facebook
Paid advertising is getting more expensive, and clickthrough rates decreased through the end of 2022.
To make the most of social ad spend, marketers are using A/B testing to improve ad performance. This approach helps them test creative content before launching paid ad campaigns, like in the examples below.
Problem
Underoutfit wanted to increase brand awareness on Facebook.
A/B Test Method
To meet this goal, it decided to try adding branded user-generated content. This brand worked with an agency and several creators to create branded content to drive conversion.
Then, Underoutfit ran split testing between product ads and the same ads combined with the new branded content ads. Both groups in the split test contained key marketing messages and clear CTA copy.
The brand and agency also worked with Meta Creative Shop to make sure the videos met best practice standards.

Results
The test showed impressive results for the branded content variant, including a 47% higher clickthrough rate and 28% higher return on ad spend.
9. Databricks’ Ad Performance on LinkedIn
Pivoting to a new strategy quickly can be difficult for organizations. This A/B testing example shows how you can use split testing to figure out the best new approach to a problem.
Problem
Databricks, a cloud software tool, needed to raise awareness for an event that was shifting from in-person to online.
A/B Test Method
To connect with a large group of new people in a personalized way, the team decided to create a LinkedIn Message Ads campaign. To make sure the messages were effective, it used A/B testing to tweak the subject line and message copy.
Results
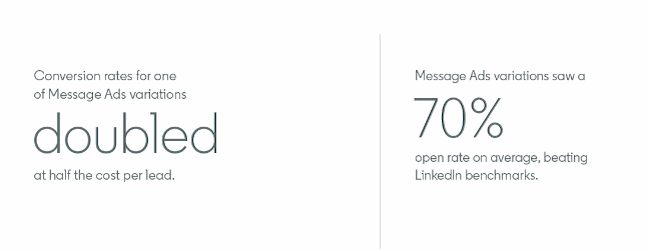
The third variant of the copy featured a hyperlink in the first sentence of the invitation. Compared to the other two variants, this version got nearly twice as many clicks and conversions.
Mobile A/B Testing Example
7. HubSpot’s Mobile Calls-to-Action
On this blog, you’ll notice anchor text in the introduction, a graphic CTA at the bottom, and a slide-in CTA when you scroll through the post. Once you click on one of these offers, you’ll land on a content offer page.
While many users access these offers from a desktop or laptop computer, many others plan to download these offers to mobile devices.
Problem
But on mobile, users weren’t finding the CTA buttons as quickly as they could on a computer. That’s why HubSpot tested mobile design changes to improve the user experience.
Previous A/B tests revealed that HubSpot’s mobile audience was 27% less likely to click through to download an offer. Also, less than 75% of mobile users were scrolling down far enough to see the CTA button.
A/B Test Method
So, HubSpot decided to test different versions of the offer page CTA, using conversion rate (CVR) as the primary metric. For secondary metrics, the team measured CTA clicks for each CTA, as well as engagement.
HubSpot used four variants for this test.
For variant A, the control, the traditional placement of CTAs remained unchanged.
For variant B, the team redesigned the hero image and added a sticky CTA bar.
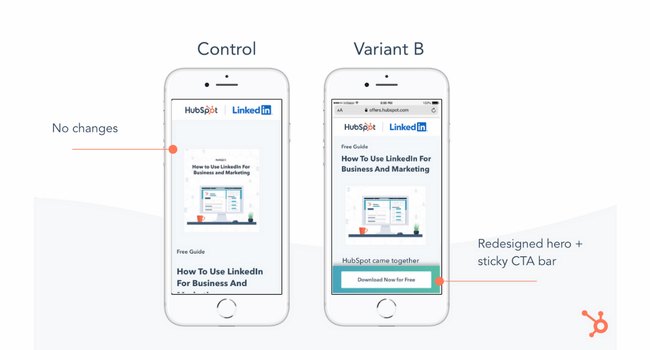
For variant C, the redesigned hero was the only change.
For variant D, the team redesigned the hero image and repositioned the slider.
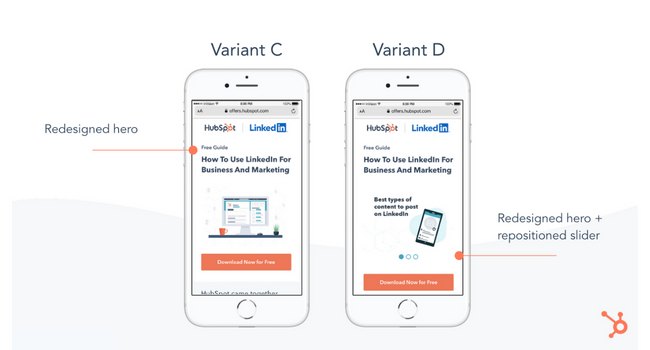
Results
All variants outperformed the control for the primary metric, CVR. Variant C saw a 10% increase, variant B saw a 9% increase, and variant D saw an 8% increase.
From those numbers, HubSpot was able to project that using variant C on mobile would lead to about 1,400 more content leads and almost 5,700 more form submissions each month.
11. Hospitality.net’s Mobile Booking
Businesses need to keep up with quick shifts in mobile devices to create a consistently strong customer experience.
A/B testing examples like the one below can help your business streamline this process.
Problem
Hospitality.net offered both simplified and dynamic mobile booking experiences. The simplified experience showed a limited number of available dates and the design is for smaller screens. The dynamic experience is for the larger mobile device screens. It shows a wider range of dates and prices.
But the brand wasn’t sure which mobile optimization strategy would be better for conversion.
A/B Test Method
This brand believed that customers would prefer the dynamic experience and that it would get more conversions. But it chose to test these ideas with a simple A/B test. Over 34 days, it sent half of the mobile visitors to the simplified mobile experience, and half to the dynamic experience, with over 100,000 visitors total.
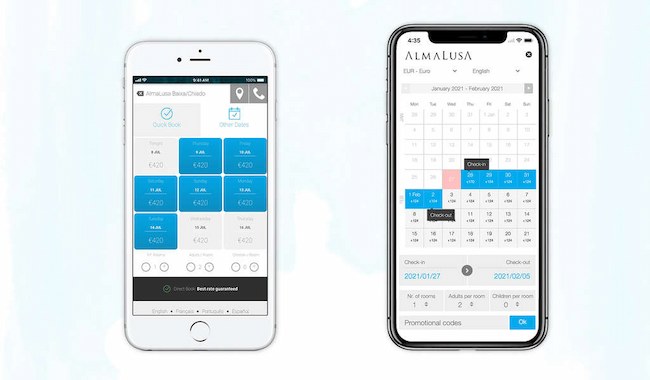
Results
This A/B testing example showed a 33% improvement in conversion. It also helped confirm the brand’s educated guesses about mobile booking preferences.
A/B Testing Takeaways for Marketers
A lot of different factors can go into A/B testing, depending on your business needs. But there are a few key things to keep in mind:
- Every A/B test should start with a hypothesis focused on one specific problem that you can test.
- Make sure you’re testing a control variable (your original version) and a treatment variable (a new version that you think will perform better).
- You can test various things, like landing pages, CTAs, emails, or mobile app designs.
- The best way to understand if your results mean something is to figure out the statistical significance of your test.
- There are a variety of goals to focus on for A/B testing (increased site traffic, lower bounce rates, etc.), but you should be able to test, support, prove, and disprove your hypothesis.
- When testing, make sure you’re splitting your sample groups equally and randomly, so your data is viable and not due to chance.
- Take action based on the results you observe.
Start Your Next A/B Test Today
You can see amazing results from the A/B testing examples above. These businesses were able to take action on goals because they started testing. If you want to get great results, you’ve got to get started, too.
Editor’s note: This post was originally published in October 2014 and has been updated for comprehensiveness.

![]()
28 CTA Templates to Design Clickable CTAs in PowerPoint [Download]
Calls-to-action (CTAs) are a crucial part of your marketing arsenal. You need effective CTAs to convert website visitors into leads. CTAs prompt your audience to take an action in their lifecycle that actually benefits them — and the growth of your business.

In addition to your CTA’s copy, its design needs to grab people’s attention. That’s why we created 28 free call-to-action (CTA) templates in PowerPoint for you to customize and use. Don’t let the fear of DIY design stop you. The template will teach you how to customize your new CTAs effectively.
This post will give you a sneak peek into a large set of designs available in the template. Download it now and follow along.

Download Now: 28 Free CTA Templates
Best Free Call-to-Action Templates
Struggling to create engaging CTA designs or just looking for some inspiration? Here are some of the best free call-to-action templates that can help you.
1. Basic Calls-to-Action
Sometimes you just need a quick and clean button that helps drive conversions.
Building a landing page that requires a customized submit button? Working on a website page that needs to drive visitors to a coupon? Drafting a blog post that needs a “read more” button after the summary? We’ve got you covered.
Here are some template examples for basic CTAs.
2. Contextualized Calls-to-Actions
You’ve seen some basic CTA options thus far. The next set of CTA templates call on you to include more context.
Here are two sample designs available in the template.

These designs are created to further explain the value of taking action. Just be sure to keep the overall layout of the button simple so that users can easily see the action you’re calling on them to take.
3. Photo and Mobile Device Calls-to-Action
Photos can serve as a great asset when creating your call-to-action designs. Not to mention it’s super easy because all you have to do is overlay some text.
Photos make it easy to humanize and customize your messages for your brand and audience.
Here are three sample CTA designs from the bunch.

Similarly, mobile and desktop devices can help make your action “pop.” Rather than including a screenshot of your product, try putting that screenshot on a kindle to show it in action.
If you have trouble locating copyright-free photos, you can download our free stock photos resource. No attribution is required; just download and use.
4. Qualifying Calls-to-Actions
When you’re trying to nurture a lead further down the funnel, you want to ensure you’re presenting CTAs to qualify them for your sales team.

For these CTAs, it’s essential that they are welcoming and not pushy. Having a great design can help you naturally move your leads further down your marketing funnel.
Here are two examples from the templates you could customize to help convert a lead to marketing qualified lead.
Crafting Your CTAs
Not sure how to exactly save and use these templates? Don’t worry. Your download of these 28 templates will include step-by-step instructions on how to save and use these templates on your website.
Soon you’ll be grabbing customers’ attention and driving leads.

![]()
How Social Media Influenced Coachella
Welcome to HubSpot Marketing News! Tap in for campaign deep dives, the latest marketing industry news, and tried-and-true insights from HubSpot’s media team.
Coachella didn’t start off as the Met Gala for influencers.
The festival was first held in October 1999 and was intended to be an accessible event for alternative music fans. Held just three months after the infamous Woodstock ‘99, the first Coachella had an audience of just 25,000 people and failed to make a profit, costing organizers nearly $1 million.
After taking a year off, Coachella made its comeback in April 2001. While Coachella began picking up popularity in its first decade, the 2010s ushered in a distinctly new era for the festival and it became a profitable and style-defining event.
So, what changed?
In its first few years, Coachella featured predominantly alternative artists, with headliners like Beck and Rage Against the Machine. By the 2010s, mainstream artists including Jay-Z, Lady Gaga, and Beyonce started drawing bigger crowds.
What started as a single-day event evolved into a six-day festival spanning over consecutive weekends. By 2016, there were over 99,000 attendees at Coachella each weekend — combined to be nearly 10x the attendance of the first event.
How Influencer Marketing Changed Coachella
The rise of social media also had a major impact on Coachella’s growth. Influencer culture and “festival fashion” became nearly synonymous with the event.
As content creators and celebrities began attending Coachella in droves, what they wore nearly overshadowed what was happening on stage. Brands, particularly brands that relied on influencer marketing, began leveraging Coachella as a pivotal part of their business strategies.
In 2015 and 2016 H&M partnered with Coachella organizers to launch #HMLovesCoachella, a clothing collection that captures the boho aesthetic the festival is known for. H&M also hosted a pop-up shop at the 2016 festival where attendees could purchase the clothes on-site.
Perhaps no company has used Coachella as an influencer marketing tool as heavily as the LA-based clothing company Revolve.
How Revolve Uses Influencer Marketing at Coachella to Drive Revenue
It’s reported that nearly 70% of the company’s sales come from influencers, and experiential marketing with content creators at events like Coachella is a core revenue driver.
Since 2015, Revolve has hosted Revolve Festival, an invite-only party for celebrities and influencers.
Over the years Revolve Festival has made headlines for partnering with celebrity brands like Kendall Jenner’s 818 Tequila and Hailey Bieber’s Rhode Beauty, and for last year’s transportation issues that left influencers comparing the party to 2017’s disastrous Fyre Festival.
Despite the controversy, Revolve Festival, combined with content distributed by influencers dressed in Revolve’s clothes, has helped the brand generate an astounding five billion social and media impressions.
Between sponsors throwing money at the opportunity to have their brands seen at the event, and influencers turning their experiences into content for their followers, Coachella has gone from a modest music festival to a $1+ billion marketing machine.
Elsewhere in Marketing
The latest marketing news and strategy insights.
Instagram is now letting users put up to five links in their bio.
YouTube is ending its in-video shopping feature.
Twitter gives Twitter Blue subscribers the ability to monetize their popular tweets.
Google is reportedly working on an AI-powered search engine to compete with Bing and OpenAI.
AI in content marketing: the HubSpot blog recently surveyed a group of marketers to learn how they’re using AI in their processes.

![]()
The Ultimate Guide to Google Data Studio in 2020
Google Data Studio is now Google Looker Studio, and it’s making data reporting even more accessible, visual, and impactful than before. The new interface, features, and functionality have some serious advantages when it comes to visualizing competitive data insights.
In this guide, we’ll introduce some of the coolest, newest features of the platform to get you ramped up quickly. We’ll also walk you through the most notable changes between Google Data Studio and Google Looker Studio.
![→ Download Now: SEO Starter Pack [Free Kit]](https://no-cache.hubspot.com/cta/default/53/1d7211ac-7b1b-4405-b940-54b8acedb26e.png)
Pro Tip: Even with the major overhaul, Google Looker Studio is still entirely free and accessible to all (even if you don’t have any data of your own!)— that means you can follow along with this tutorial in real-time.
With Looker Studio, you can create custom dashboards, reports, and visualizations to gain insights into your business operations. The platform offers a wide range of data connectors and report templates, allowing you to interpret data from various sources.
1. Log into Looker Studio
To log in to Looker Studio, you’ll need a Google account — I recommend using the same one as your Analytics, Search Console, and/or Google Ads account.
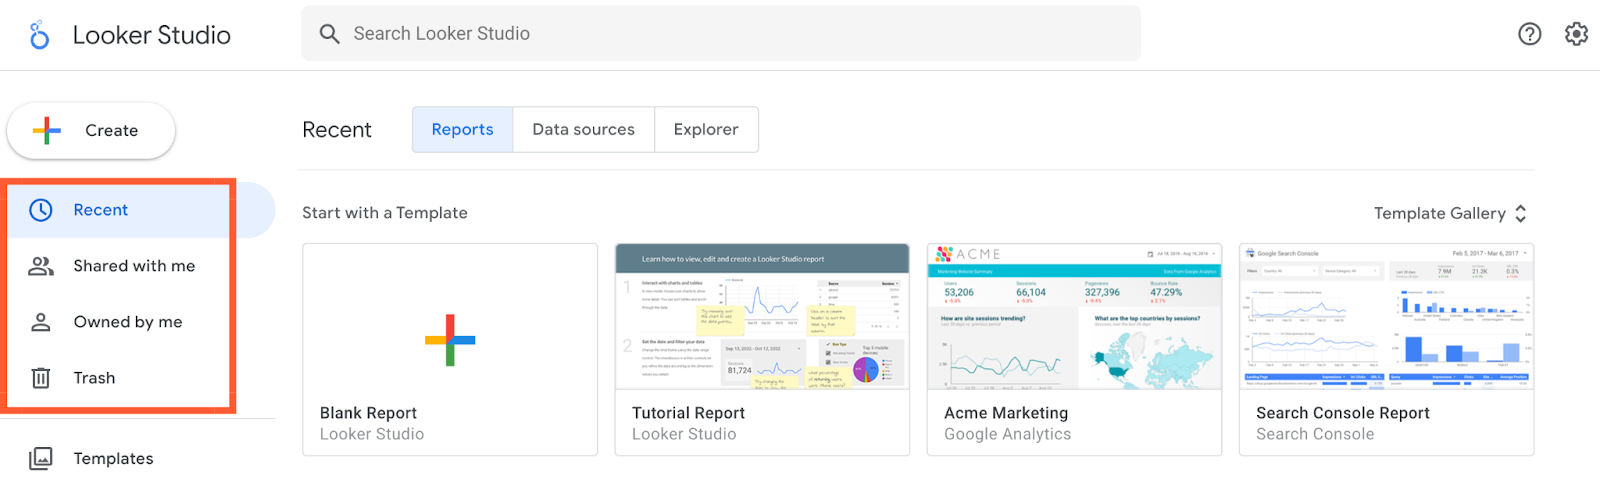
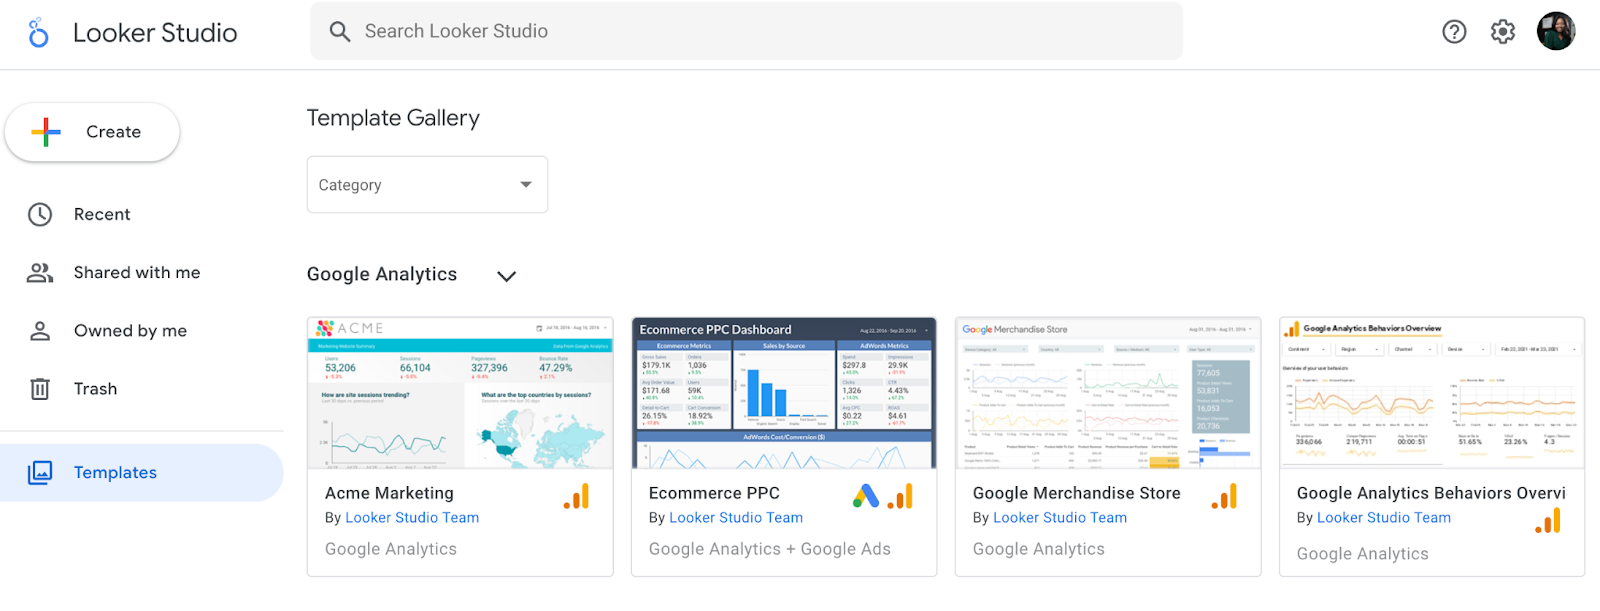
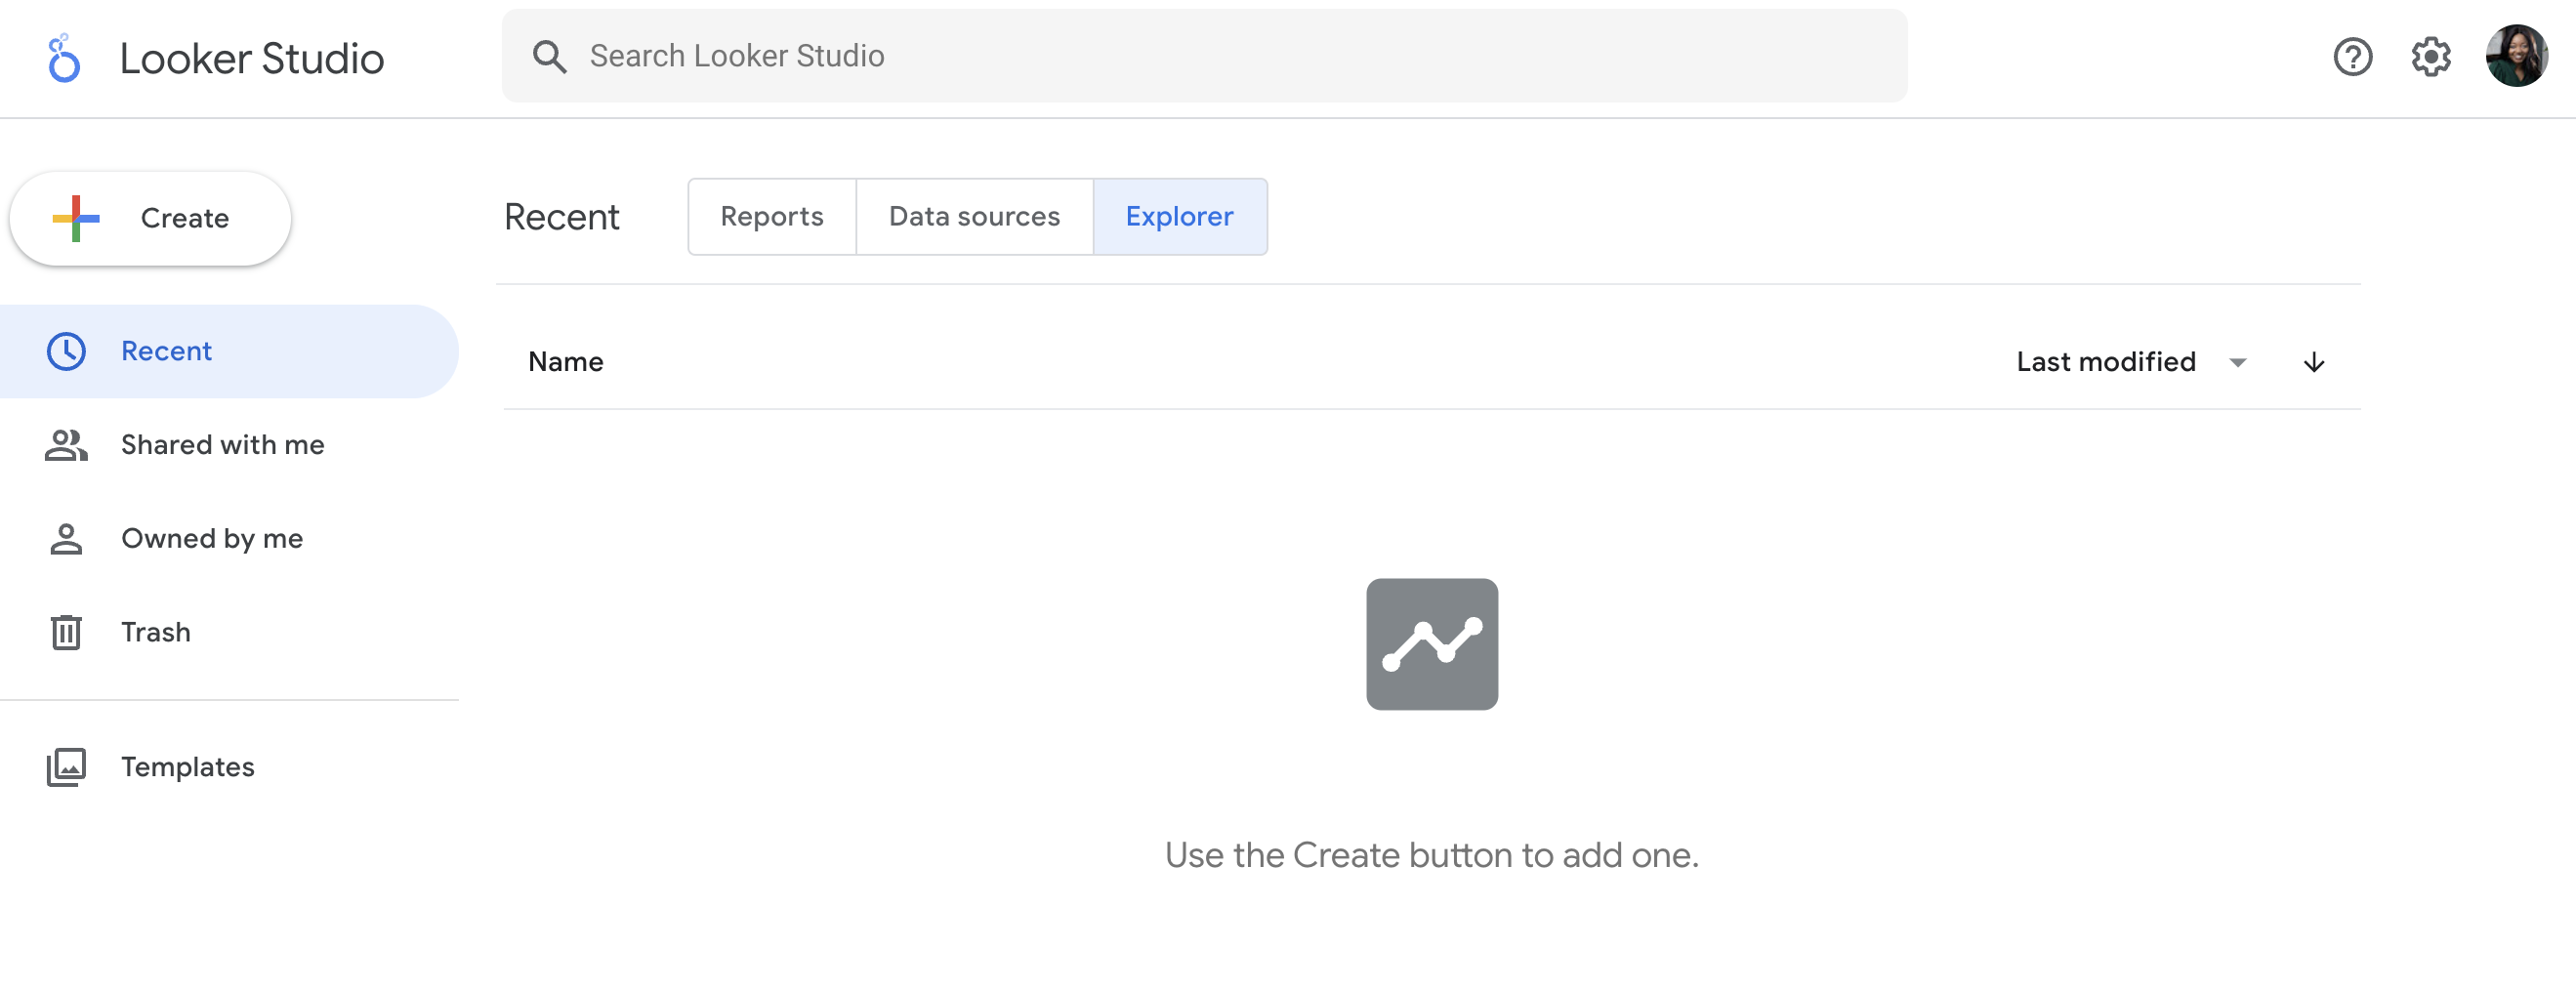
After logging in, you’ll land on a page displaying your most recent Looker Studio reports.
2. Explore the Looker Studio Dashboard

If you’ve used Google Docs, Sheets, or Drive before, this dashboard should look pretty familiar. In the center, you have the option to start a blank report, start a tutorial, or see report templates. To the left, you’ll see a column that houses several tabs including Reports, Shared with me, Owned by me, Trash, and Templates. At the top, you’ll see three more tabs: Reports, Data sources and explorer.
Let’s go over each of these tabs in detail.
Reports
Here’s where you can access all of your reports (equivalent to a workbook in Tableau or Excel).
To create a report in Google Looker Studio:
- Click the Create button.
- Choose Report.
- Add a data source.
- Customize your report.
Once you’ve created your report, you can access it later in your dashboard. To soft through several reports, filter them by name, owner, or last opened date by using the dropdown filters.
Data Sources
Data sources list all the connections you’ve created between Looker Studio and your original data sources.

To create a data source in Google Looker Studio:
- Click the Create button.
- Choose Data source.
- Enter in your company information, click Continue.
- Set up email preferences.
- Select a Google Connector.
- Authorize the Google Connector using a Google Account.
- Choose the account and property you want to view.
- Click Create Report.
Pro Tip: If you’re using Google Analytics and/or Search Console (which I highly recommend), you’ll need to individually connect each view and property, respectively. So if you have three GA views for three different subdomains, you’ll need to set up three separate data sources.
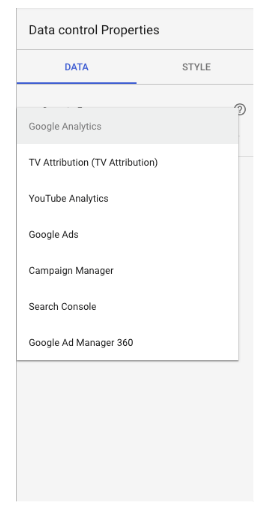
Looker Studio currently supports 760+ data sources. Below are the most popular sources:
Explorer
Explorer is an experimental tool that lets you experiment or tweak a chart without modifying your report itself.
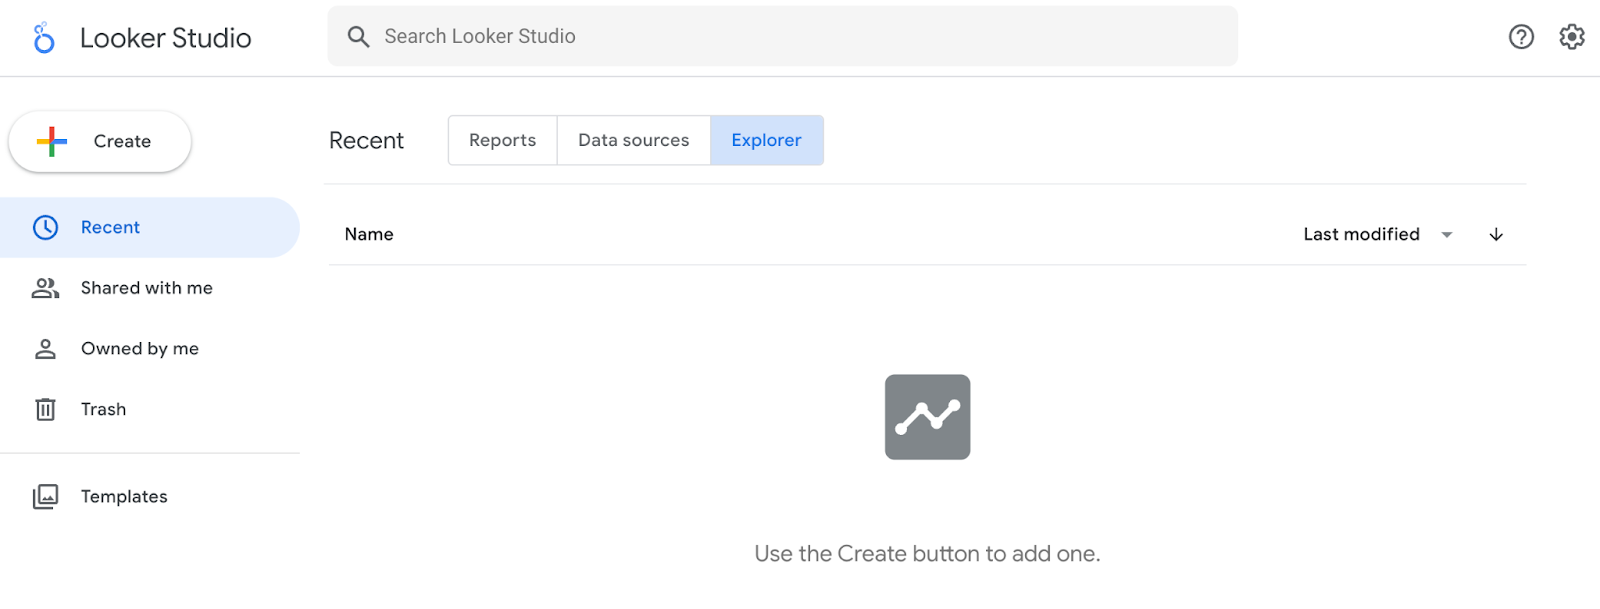
For instance, let’s say you’ve created a table in Looker Studio that shows the top landing pages by conversion rate. While looking at this table, you think, “Huh, I wonder what I’d find if I added average page load time.”
You don’t want to edit the chart in the report, so you export it into Explorer — where you can tweak it to your heart’s content. If you decide the new chart is valuable, it’s easy to export it back into the report.
Template Gallery
The template gallery is a collection of templates and examples you can use depending on your business needs.
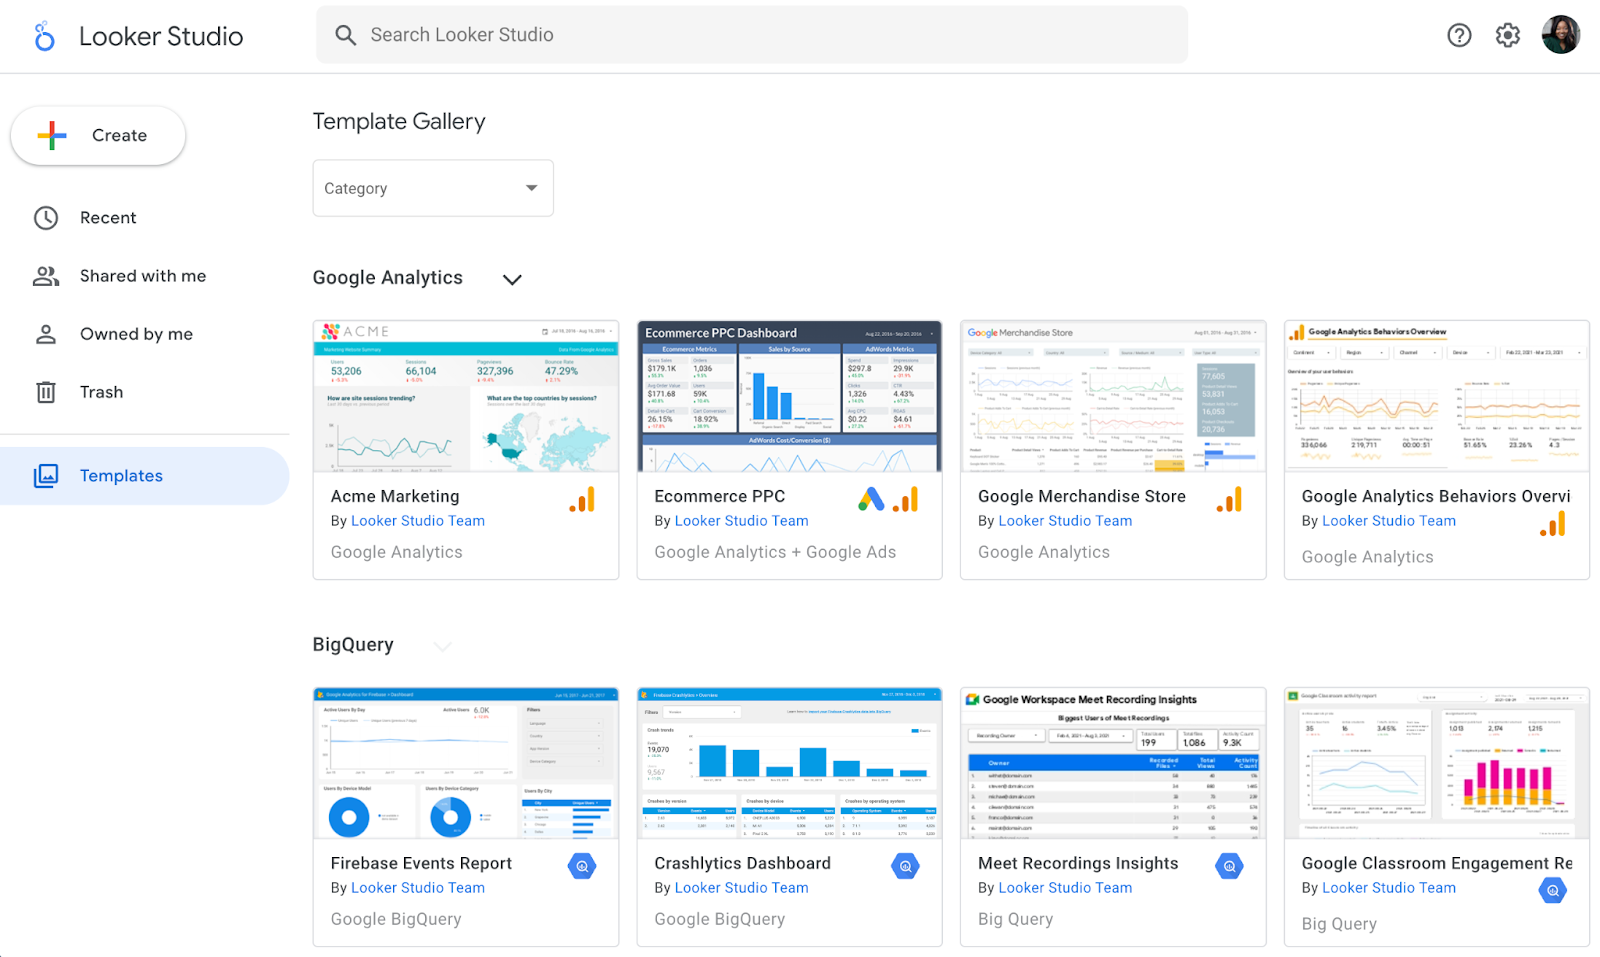
For instance, if you run an ecommerce store, the ecommerce revenue template would be very useful.
Google Looker Studio Tutorial
Connect Data Sources to Google Looker Studio
Here’s a step-by-step guide on how to connect data sources to Google Looker Studio.
1. Create a data source.
Click “Create” and choose “Data source”.

2. Use Google Analytics.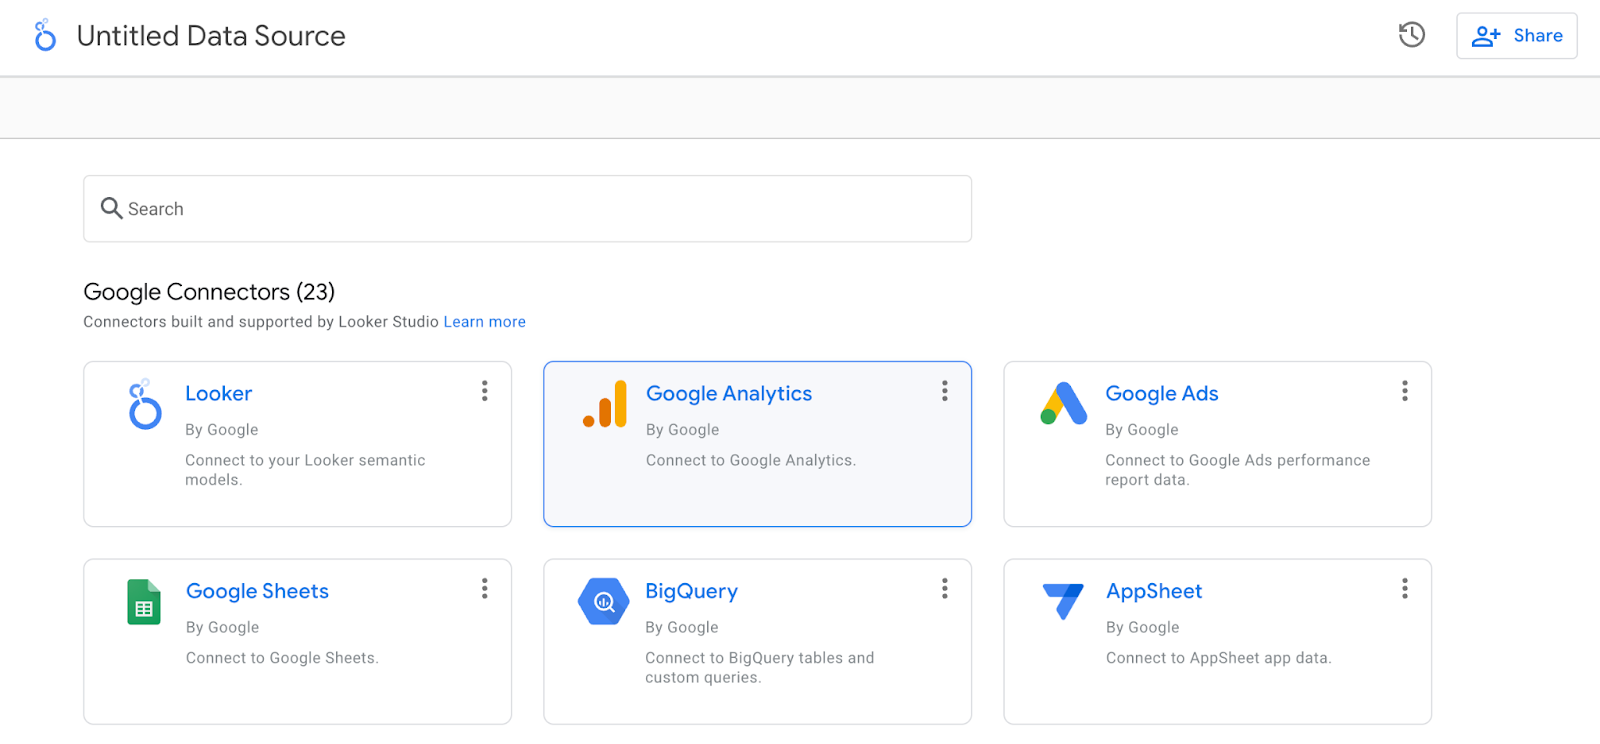
The process is nearly identical for other sources.
If you want to follow along exactly with what I’m doing, connect the Google Analytics Demo Account for the Google Merchandise Store.
3. Authorize the connection and select an account.
Next, you’ll be prompted to authorize the connection. Once you’ve done that, you’ll need to select an account, property, and view.

You’ll be presented with something like the view below: a list of every field in your Analytics account (both the standard ones and the ones you’ve added).
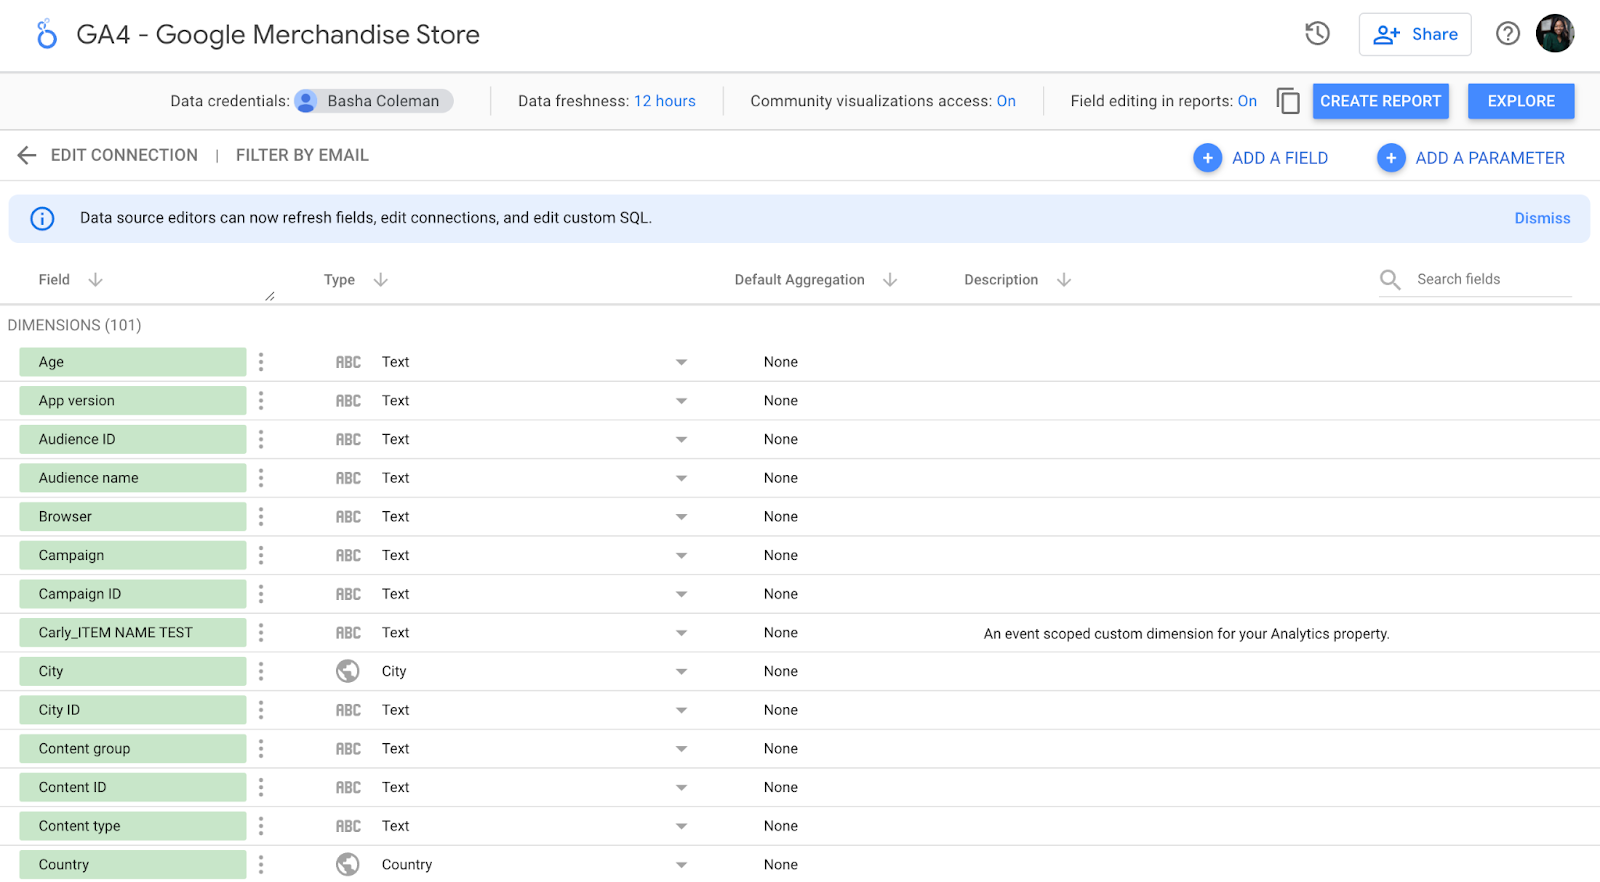
Does this feel overwhelming? Yep, same here.
We could do a lot in this step — add new fields, duplicate existing ones, turn them off, change field values, etc. But, of course, we could also do all those things in the report itself, and it’s much easier there. So let’s do that.
Create a Report in Google Looker Studio
1. Click “Create Report” in the upper right.
Looker Studio will ask if you want to add a new data source to the report; yes, you do.

Here’s what you’ll see. It’s pretty bare, but not for long!

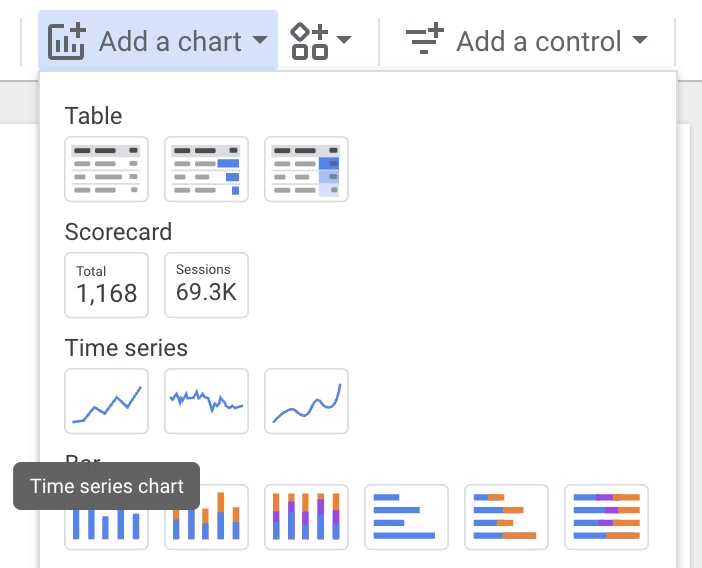
2. Click “Add a chart” in the toolbar.
It’s time to add your very first chart. The good news is that data Studio makes it easy to compare chart types with some handy illustrations.
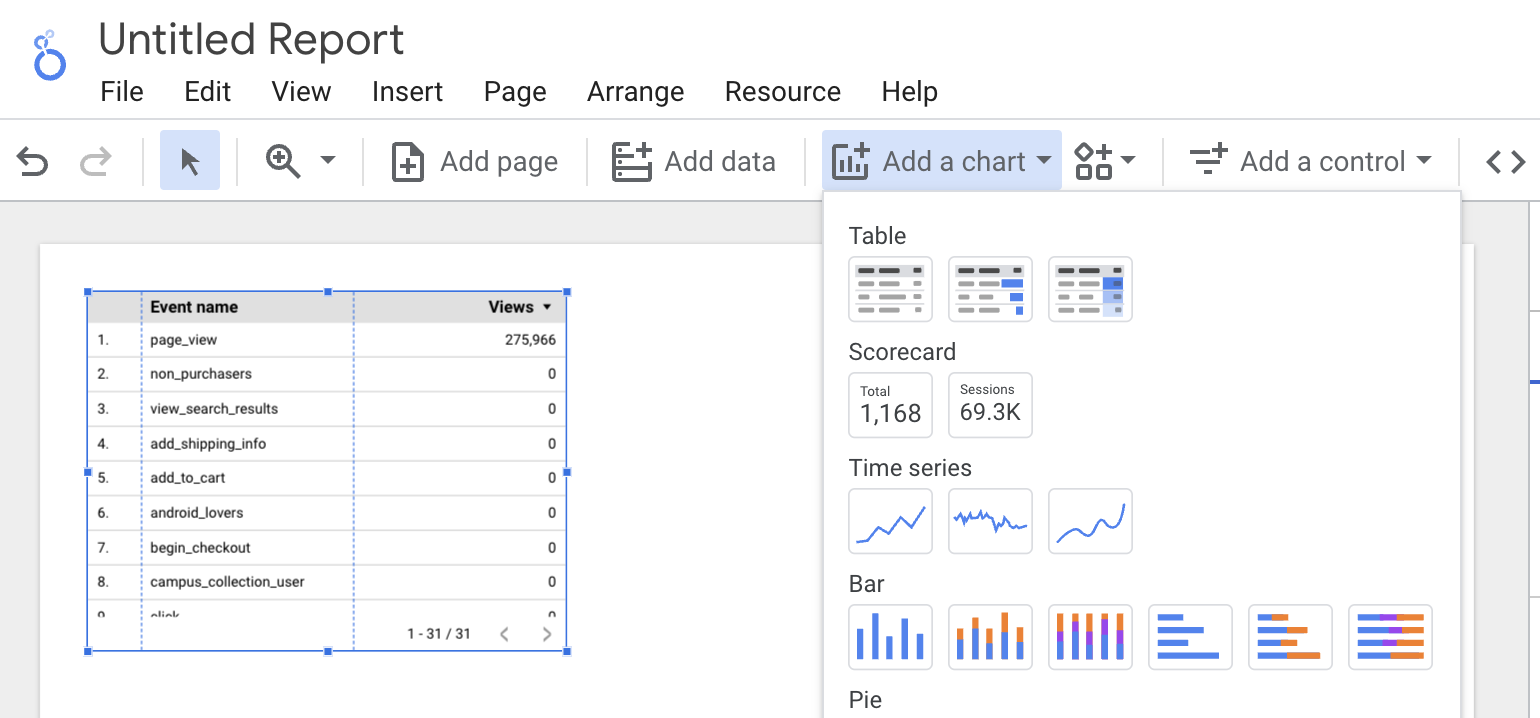
3. Choose the first option under “Time series.”
For the purpose of this tutorial, we’ll start with a “Time series” chart. This chart type shows change over time.
Once it appears on your report, the right-hand pane will change. Here’s what you should see:

By default, the dimension is “Date”; you can change this to any of the time-based dimensions, including “Year,” “Hour,” etc.
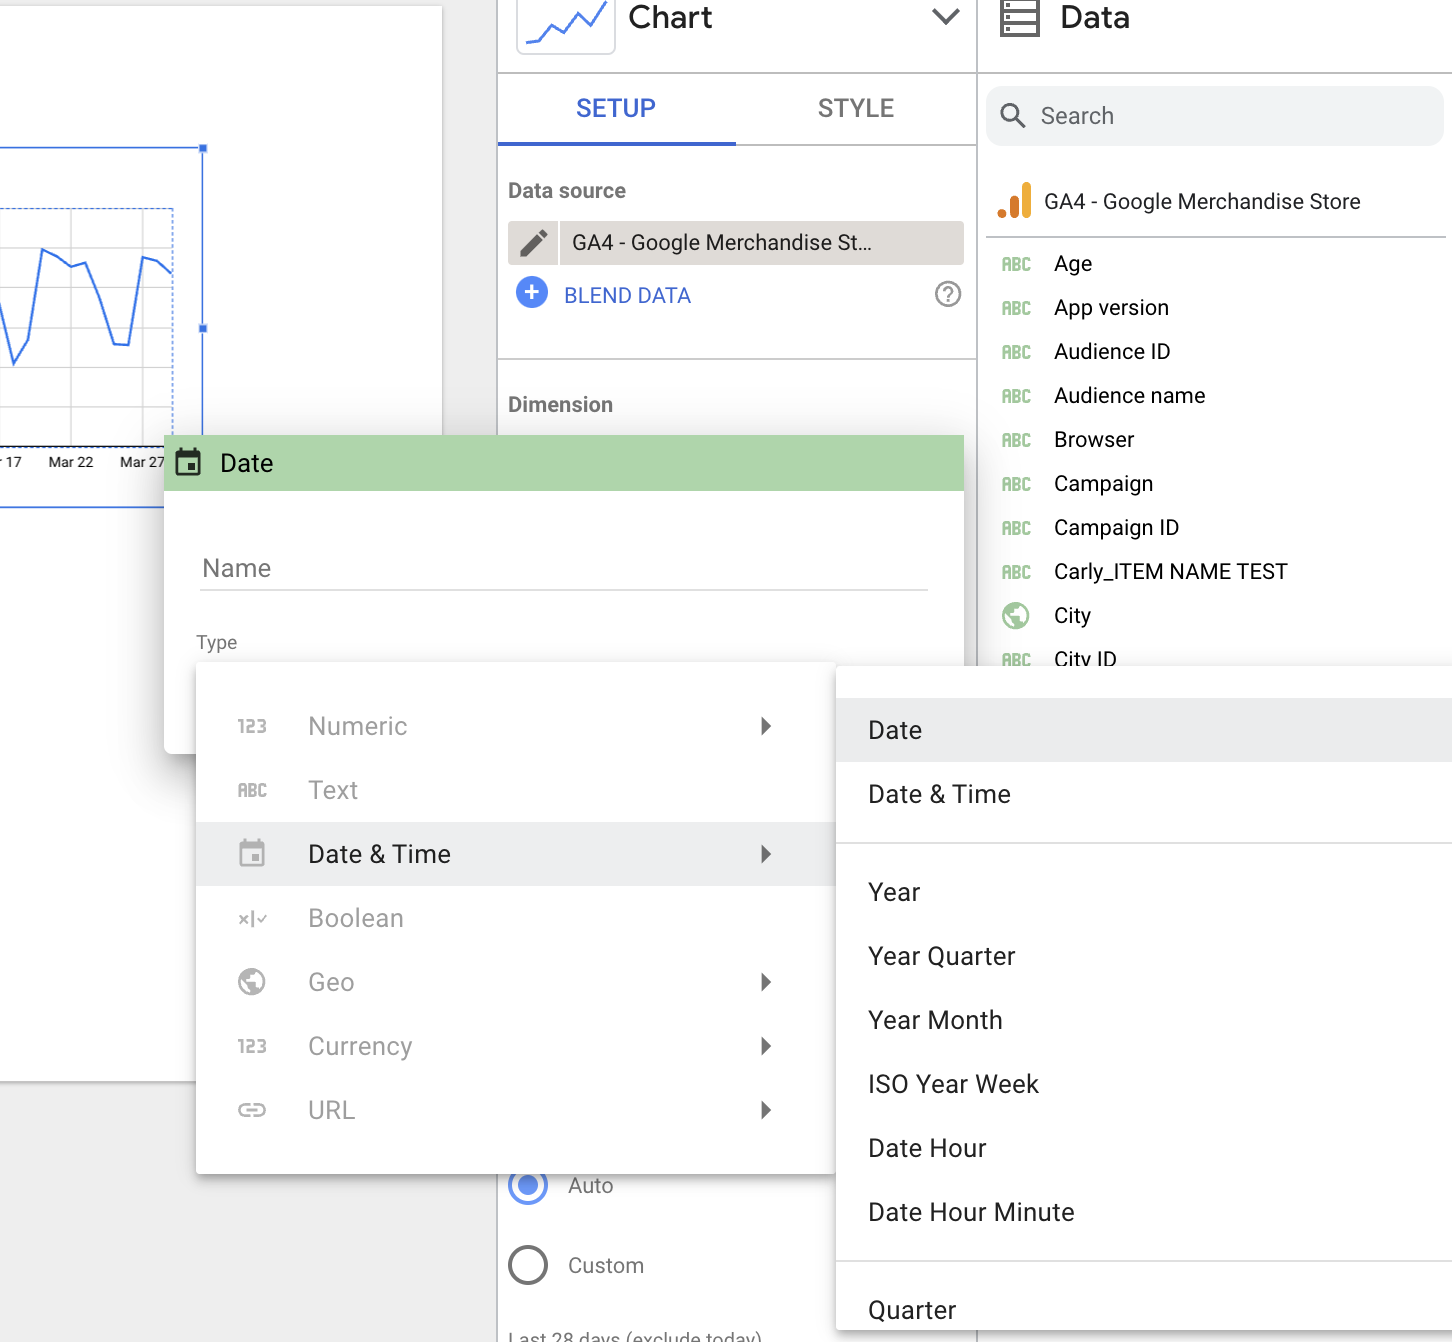
I will stick with “Date” because the Demo Account doesn’t have a lot of historical data.
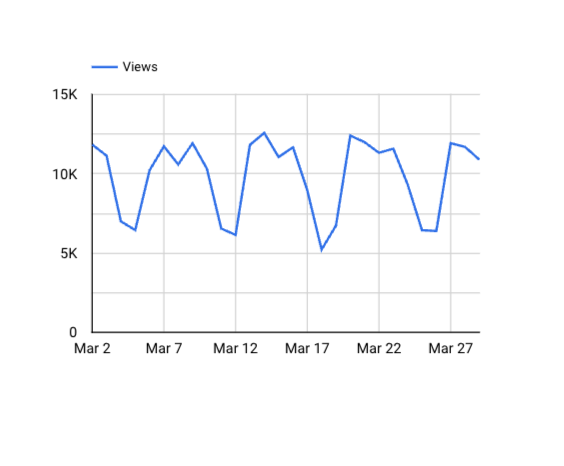
Looker Studio will automatically select a metric (i.e., what’s displayed on the Y-axis) for you. Feel free to change this; for instance, it defaulted to “Pageviews” for me, but I’d rather see “Revenue per user.”
4. Add another metric.
First, make sure you’ve selected the chart, so you see the pane:

You have two options for adding a metric (or dimension).
You can click the blue plus-sign icon — which will bring up a search box so you can find the field you want — or you can drag a field from the right into the metric section.
To delete a metric, simply hover over it with your mouse and click the white “x” that appears.

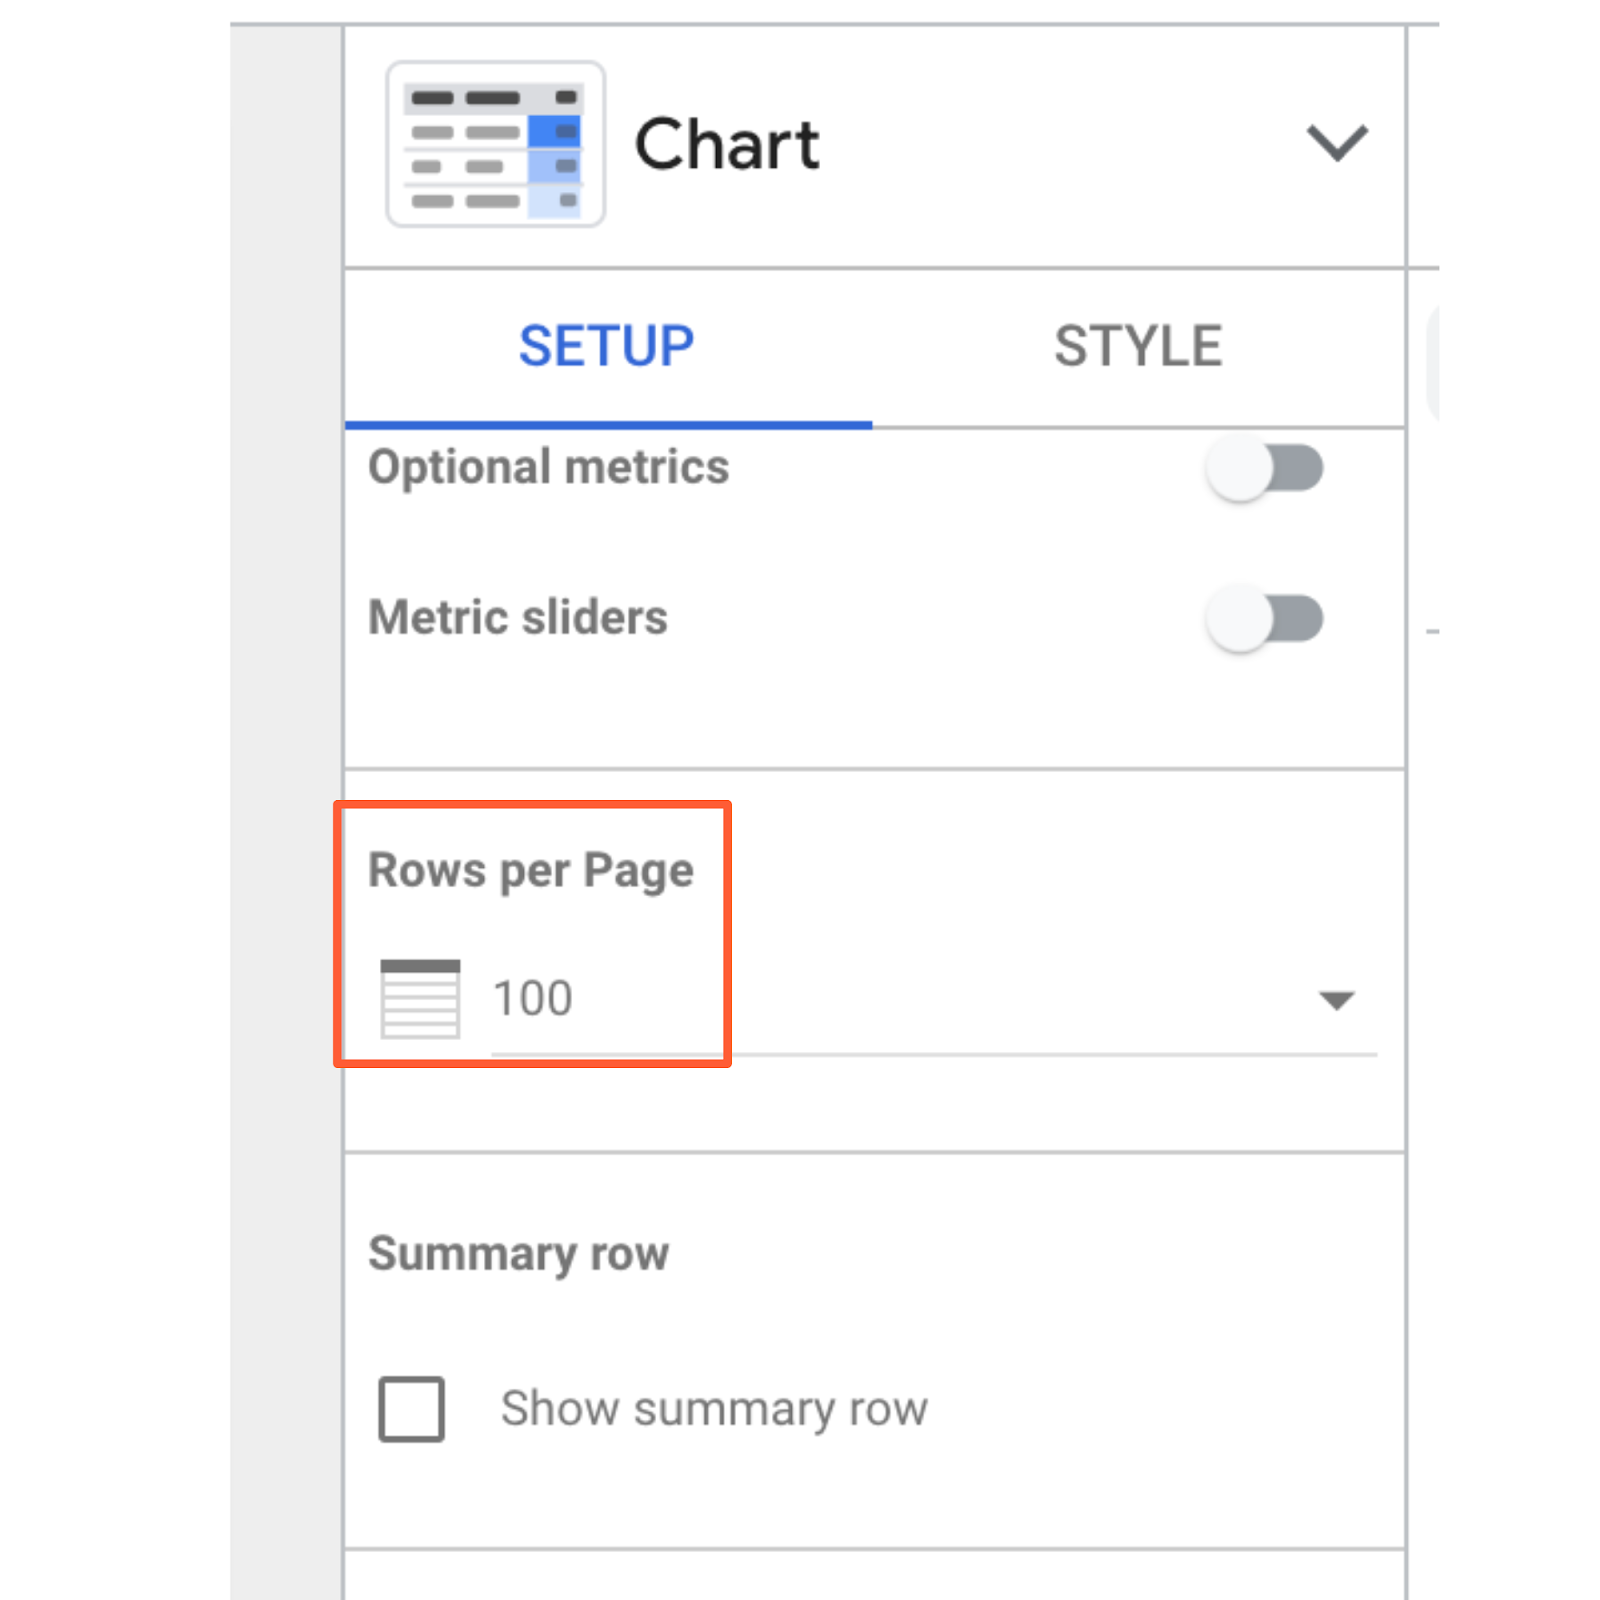
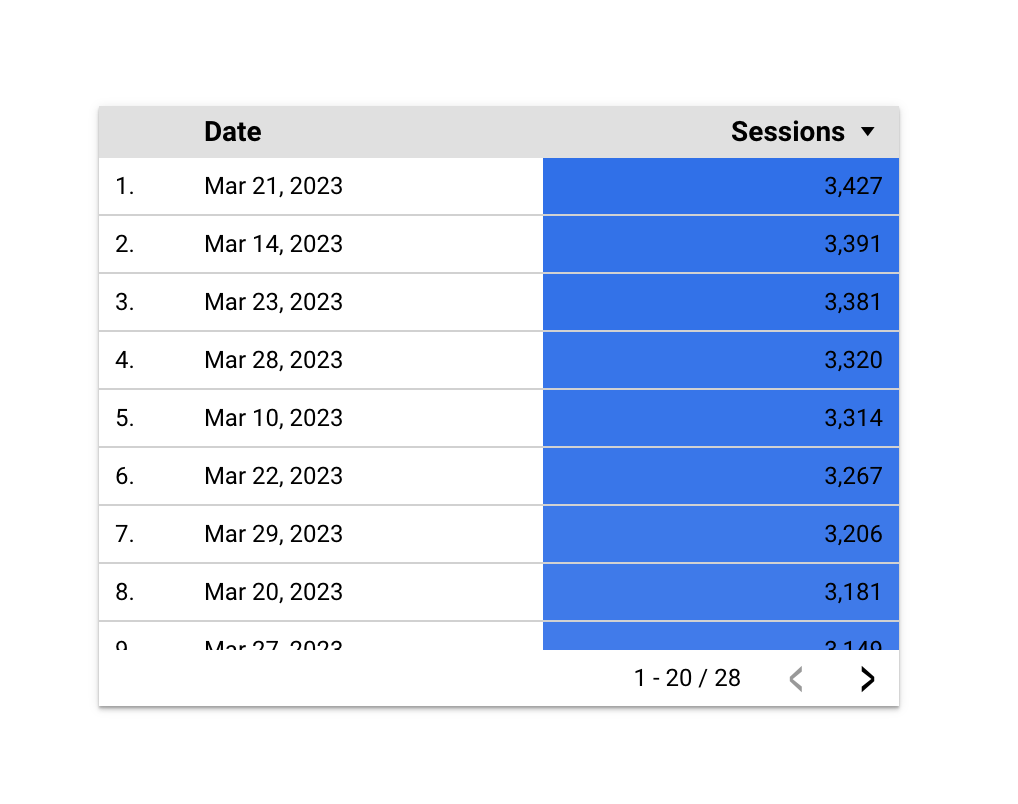
5. To add a table, choose the third option under “Add a chart.”

My chart defaults to Medium (for dimension) and Pageviews (for metric), so I change it to Product and Unique Purchases.
And I think this table’s formatting could use some work.
Change the “Rows per page” from 100 to 20 (much easier to read) and check the box for adding a Summary row.
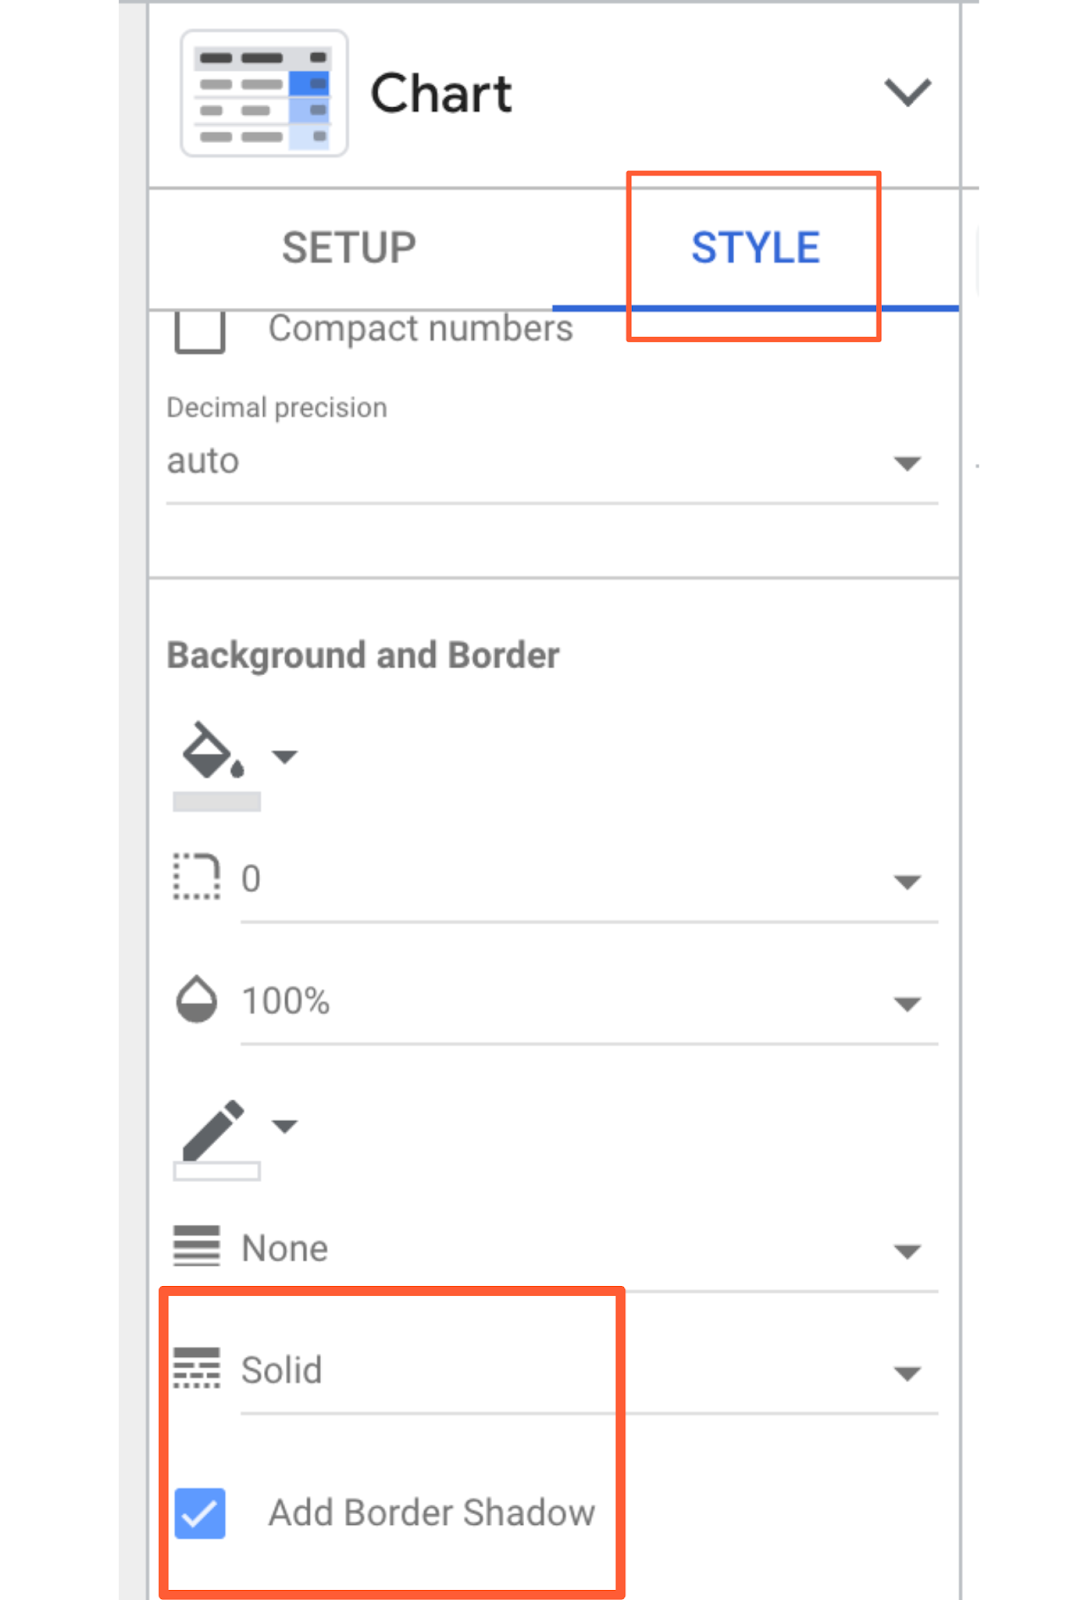
6. Finally, click “Style” to go to the style tab.
Scroll down and select “Add border shadow.” This is one of my favorite ways to make a data visualization pop off the page.
7. To see the finished product, click “View” in the top corner.
This transitions you from Editor to Viewer mode.
Voila!
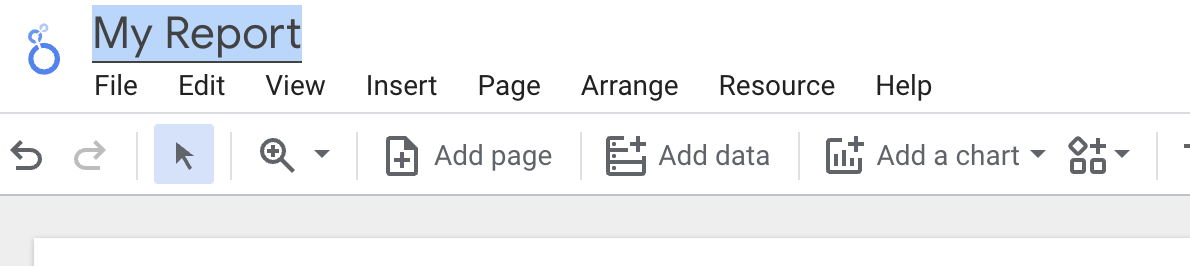
8. Click “Edit” to finish up and name the report.
Double-click the title (right now, it’s “Untitled Report”) to change it.
And with that, your first Google Looker Studio report is complete. Click that familiar icon above the Chart Editor and add some email addresses to share your report.
Okay, don’t share the report just yet—I’m about to reveal the secrets that’ll help you seriously upgrade it.
Beginner Google Looker Studio Tips
1. Use templates.
There’s no need to reinvent the wheel. If you’re not sure where to start with Looker Studio, I recommend browsing through their templates for inspiration.
Pay attention to the report’s creator. Many templates were built by the Looker Studio team; you can find them all in the “Marketing Templates” section. But there are also 45+ user submissions located in the “Community” section. A few of my favorite templates:
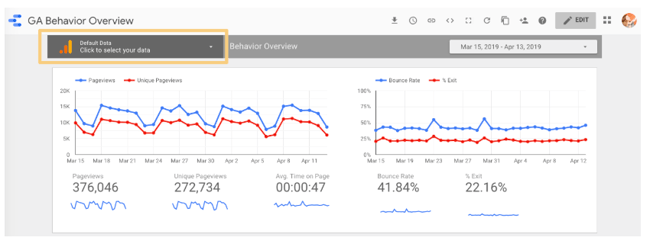
- GA Behavior Overview: This dashboard pulls out the most relevant information from the Behavior section of Google Analytics
- Paid Channels Mix Report: Use this template to understand how your ads are performing on Facebook, Twitter, LinkedIn, search, and more.
- Website Technical Performance Indicators: Get a quick overview of how your site is performing in real-time, including JavaScript and 404 errors and page load times.
There are also a bunch of fun, non-marketing templates in the gallery (found in the “Featured” section), like F1: How Important Is the First Race? and Star Wars: Data from a galaxy far, far away. Definitely take a look if you’re curious to see the full potential of GSD unleashed.
2. Publish your report.
Want to show off your superior analytics and data visualization skills to the world? Submit your report to this gallery using this Google form.
Read over the full instructions at this link, but here’s what I’d keep in mind:
- Don’t share sensitive information. I recommend creating a report with publicly accessible data, so there’s absolutely no chance you get in trouble for sharing data you don’t own. (Pro tip: recreate one of your existing company reports with dummy data from one of Google’s sample data sets!)
- Make it awesome. The public reports are impressive, so don’t hold back with design, features, and so on.
- Add context. Provide on-page explanations of what you’re measuring or monitoring with captions, instructions, maybe even a video of you walking through the report.
3. Connect to 760+ data sources.
As I mentioned, you can bring data from Google-owned sources into Looker Studio, including Search Console, Google Ads, YouTube, and Campaign Manager.
But that’s just the tip of the iceberg. There are also more than 120 partner connectors — essentially, third-party bridges between Looker Studio and platforms like Adobe Analytics, AdRoll, Asana, Amazon Ads, and AdStage (and that’s just the As).
Check out all the options here.

4. Create your own report theme.
Whether your report is meant for internal stakeholders, like the leadership team, or external ones, like clients, it’ll be more effective if it looks good.
To adjust the report’s style and formatting, click the Layout and theme option in the toolbar.
Any changes here will apply across the report—meaning you only need to pick fonts, colors, etc., once versus every time, you add a new module to the report.

Looker Studio comes with two built-in themes: simple and simple dark. But it’s easy to create your own — and the results are way more impressive.
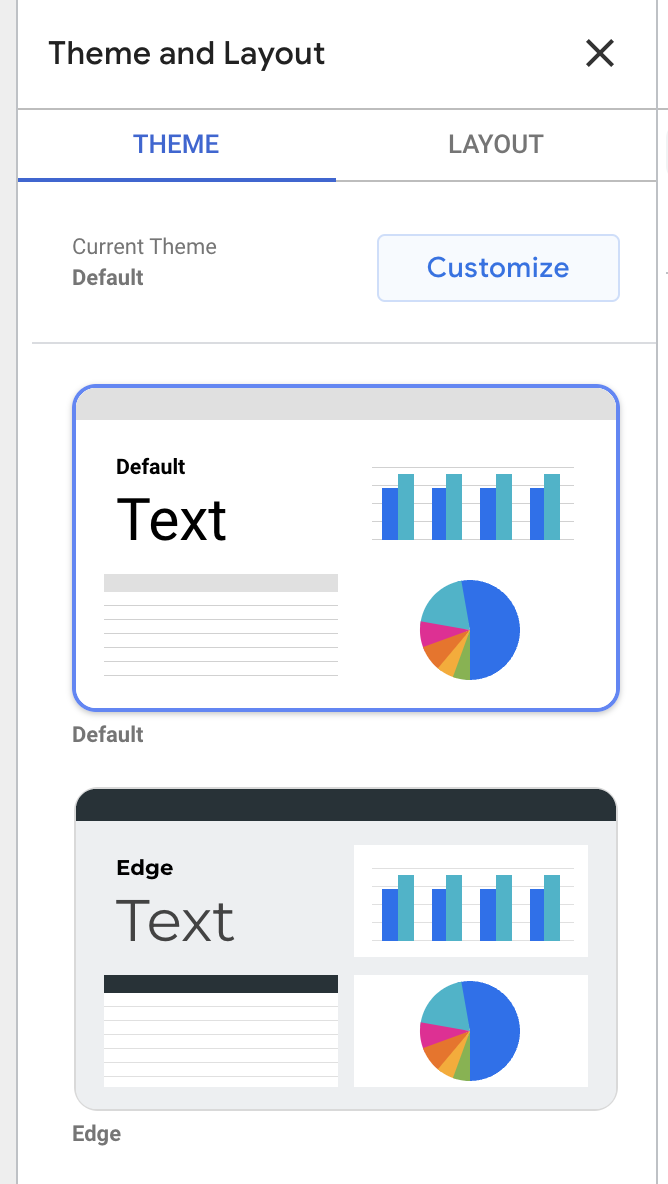
Click on “Customize.”
Use your brand style guide to choose primary and secondary colors, fonts, and text color. You might need to get creative here; HubSpot uses Avenir Next, which Looker Studio doesn’t offer, so I went with its cousin Raleway.
If you’re creating a report for a client and don’t know their hex codes, Seer Interactive’s Michelle Noonan has an excellent tip: use a free color picker tool to identify what they’re using on their website.
You can also create a custom chart palette in this tab and edit the border and background settings.
5. Embed external content.
Just like you can bring your report to the wider world, you can also bring the wider world to your report.
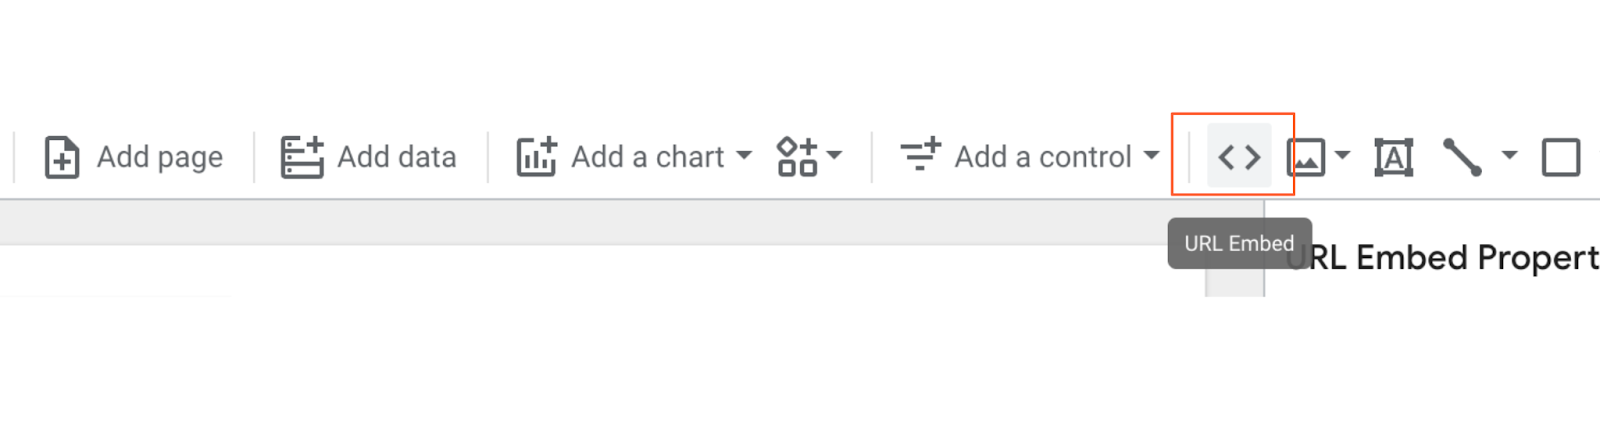
You can insert Google Docs, Google Sheets, YouTube videos, and even live webpages with the URL embed feature. Embedded content is interactive, so it’s far more powerful than a screenshot.
Click “URL embed.” in the navigation bar to add content.
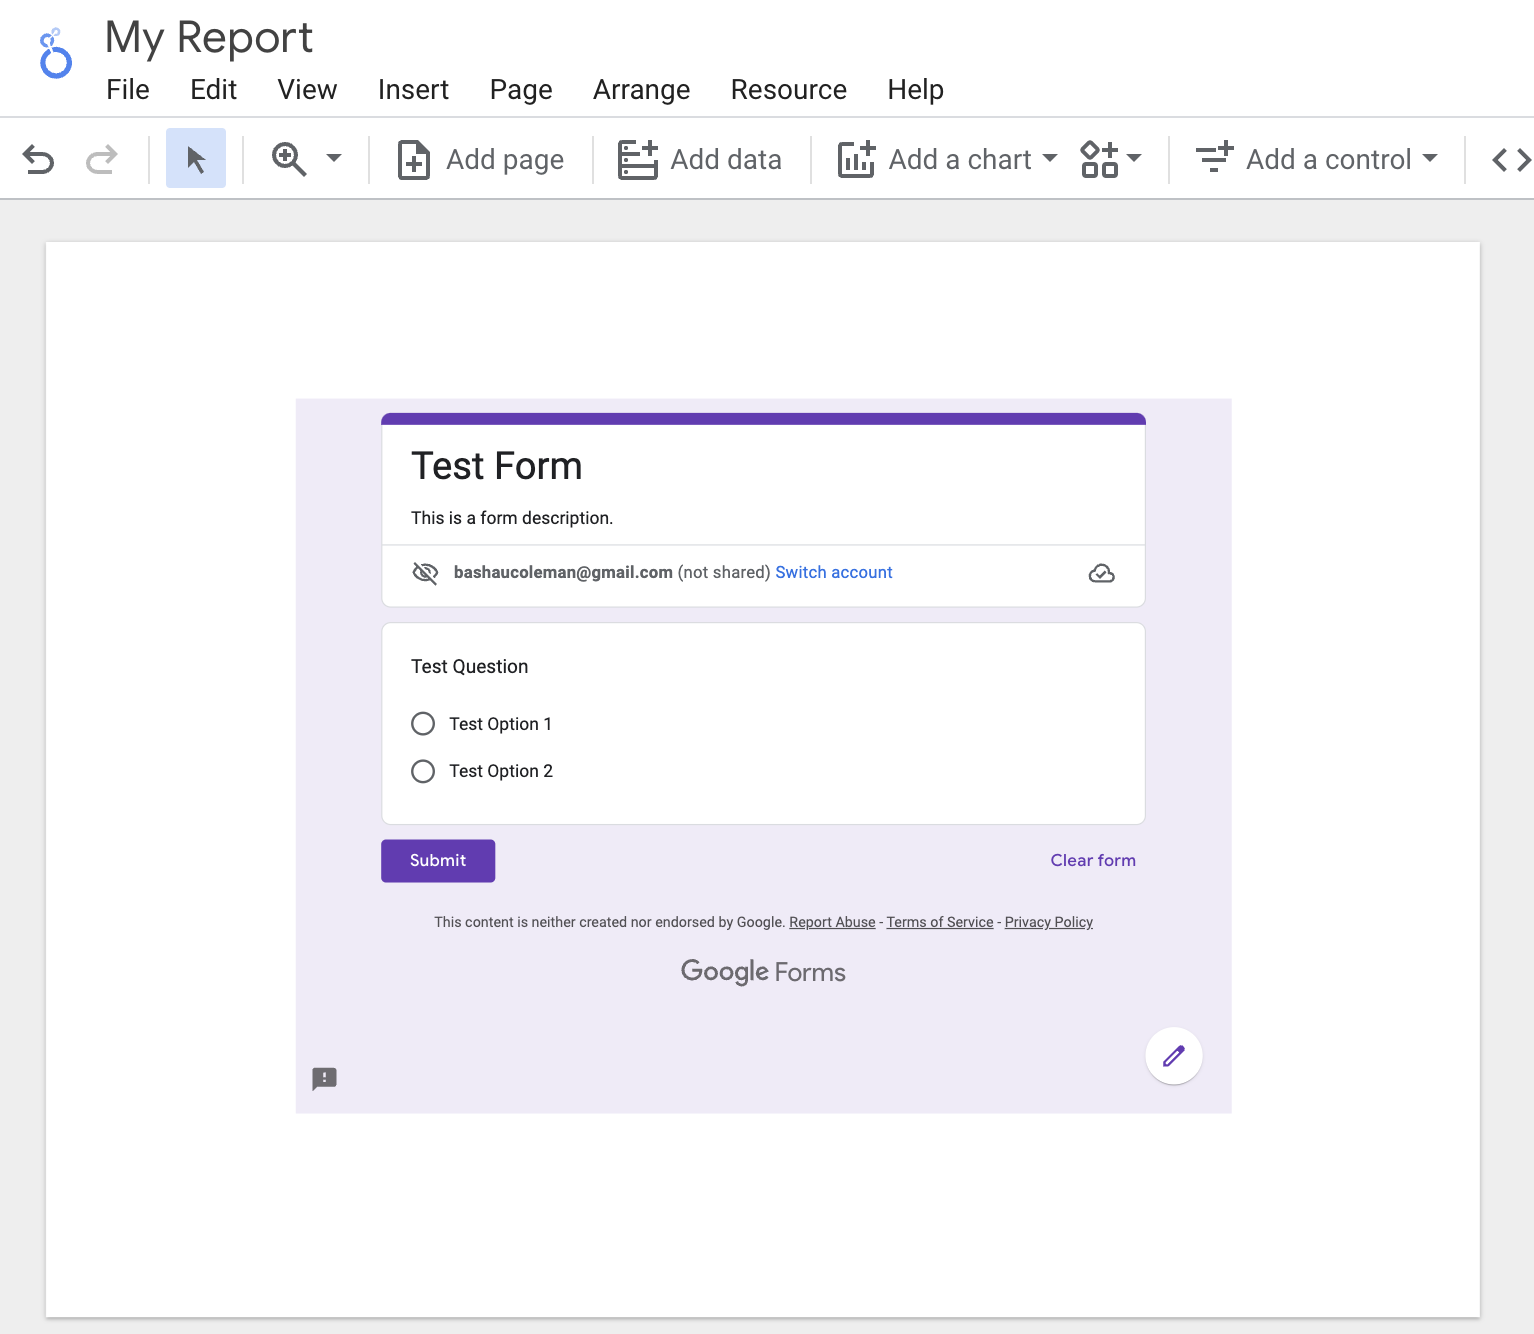
From there, simply paste the URL. Next, you may need to resize the box that appears to fit your content’s entire length and width.
The options here are pretty endless. One of my favorite ways to use this feature is to embed a Google Form gauging how helpful the report was for my audience:
If a section of the report needs extra context (or my viewers aren’t that technical), I’ll add a short video explaining what they’re looking at and how to interpret the results.
To personalize a report for a client, I’ll add the URL of their website, blog, and/or whatever pages they hired me to create or improve.
And for the HubSpot blogging team, I’ll add the latest version of the Search Insights Report so they can compare our progress to the results.
6. Send scheduled reports.
If you have a group of stakeholders that need to see your report regularly, consider using Looker Studio’s “scheduled report” feature.
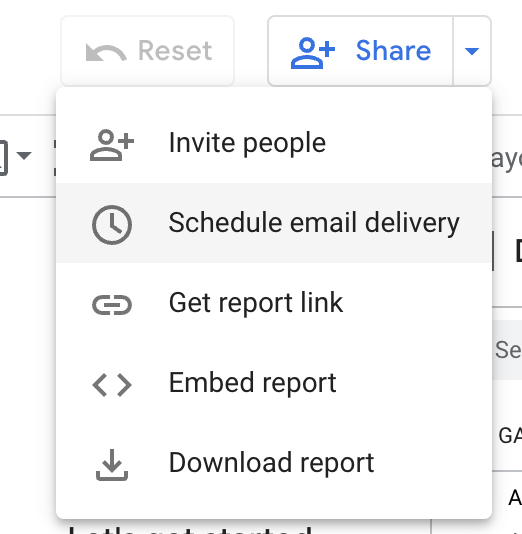
Click on the drop-down menu beside the “Share” button and select “Schedule email delivery.”
First, enter your recipients’ email addresses, then choose a schedule, whether daily, every Monday, or every month.
This is particularly handy when working with customers, since you may not want to give them access to the live report.
7. Download the report as a PDF.
Alternatively, you can download your report as a PDF. This is helpful for one-off situations, like if your boss asks for a status report or your client wants to know how an ad has performed so far this month.
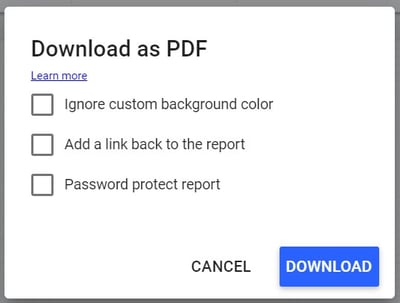
To download the file, click “download” on the drop-down menu.
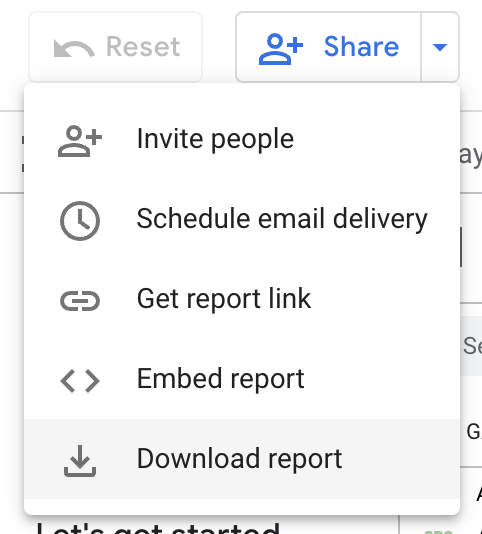
Looker Studio gives the option of downloading your current page or the entire report. You can even add a link back to the report so your audience can dig in deeper if they’d like and add password protection to ensure your data stays safe.
Intermediate Google Looker Studio Tips
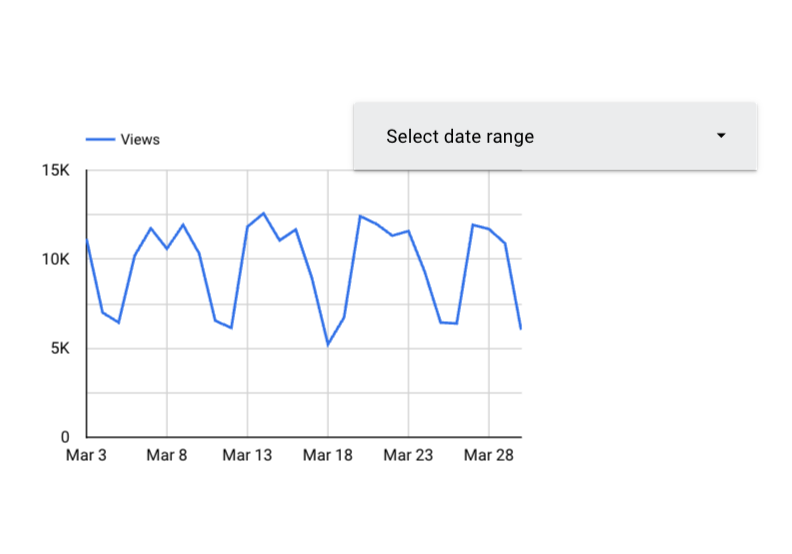
7. Add a date range.
Give your viewers more freedom by letting them select which dates they’d like to see information for.
For example, my reports always default to the last 30 days, but if one of HubSpot’s blog editors wants to see how their property performed in the previous calendar month, the date range controls let them adjust the report.
They can choose from predefined options, like “yesterday,” “last seven days,” “year to date,” etc., or pick a custom period.
To enable this, first navigate to the page you want to give users date control. Next, click on the drop-down menu by “Add a control.” Next, click “Date range” from the toolbar.

A box will appear on your report. Drag it into the position you want — I recommend somewhere in the upper right or left corner, so your audience sees it first — and adjust the size if necessary.
Clicking this module will bring up a panel on top of your report called Date Range Properties. Set the default date range to “Auto date range,” if it isn’t already.
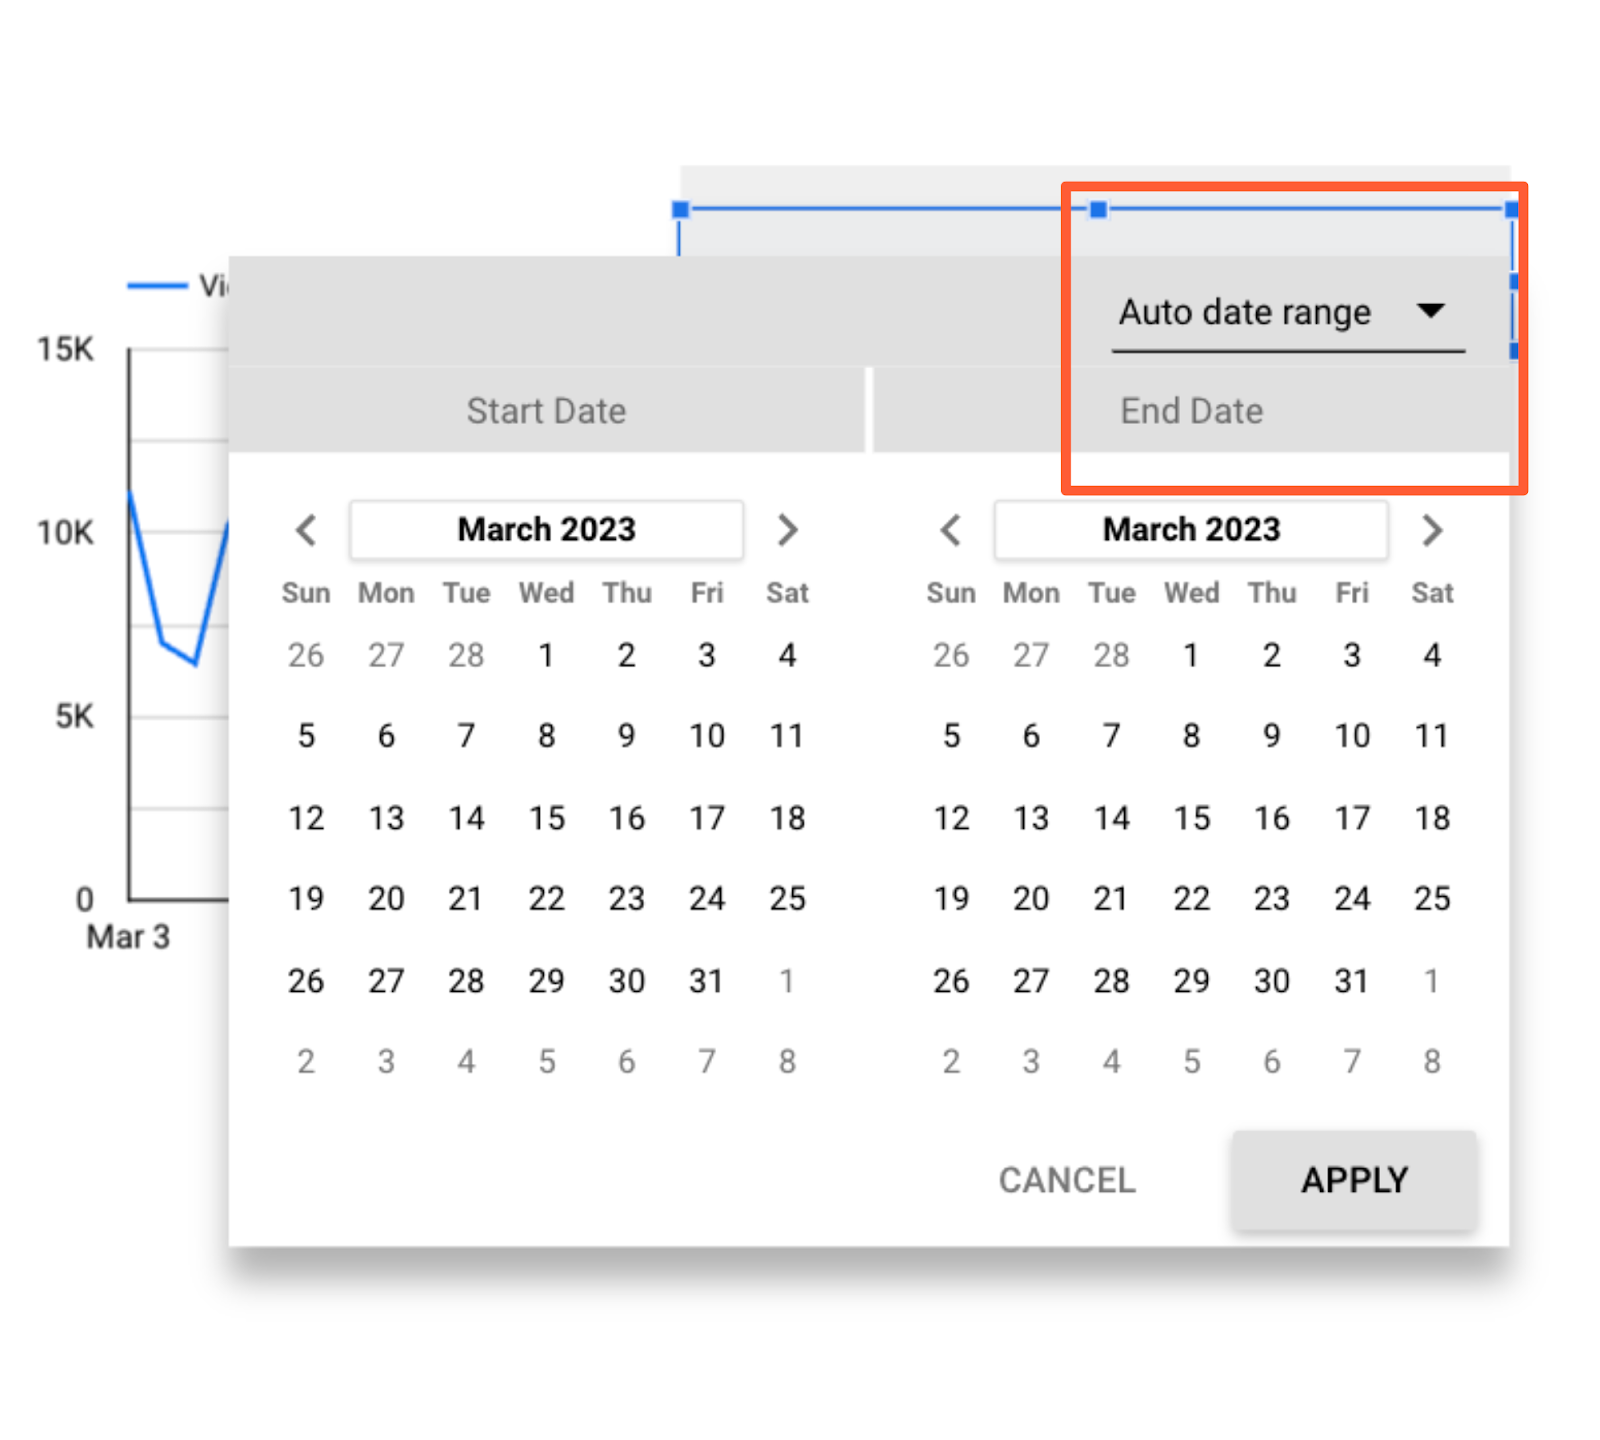
If your viewers select a date range using the date range widget, every report on the page will automatically update to that period.
There are two ways to override this:
- Set a time period within a specific chart. That time period will always supersede the date range control.
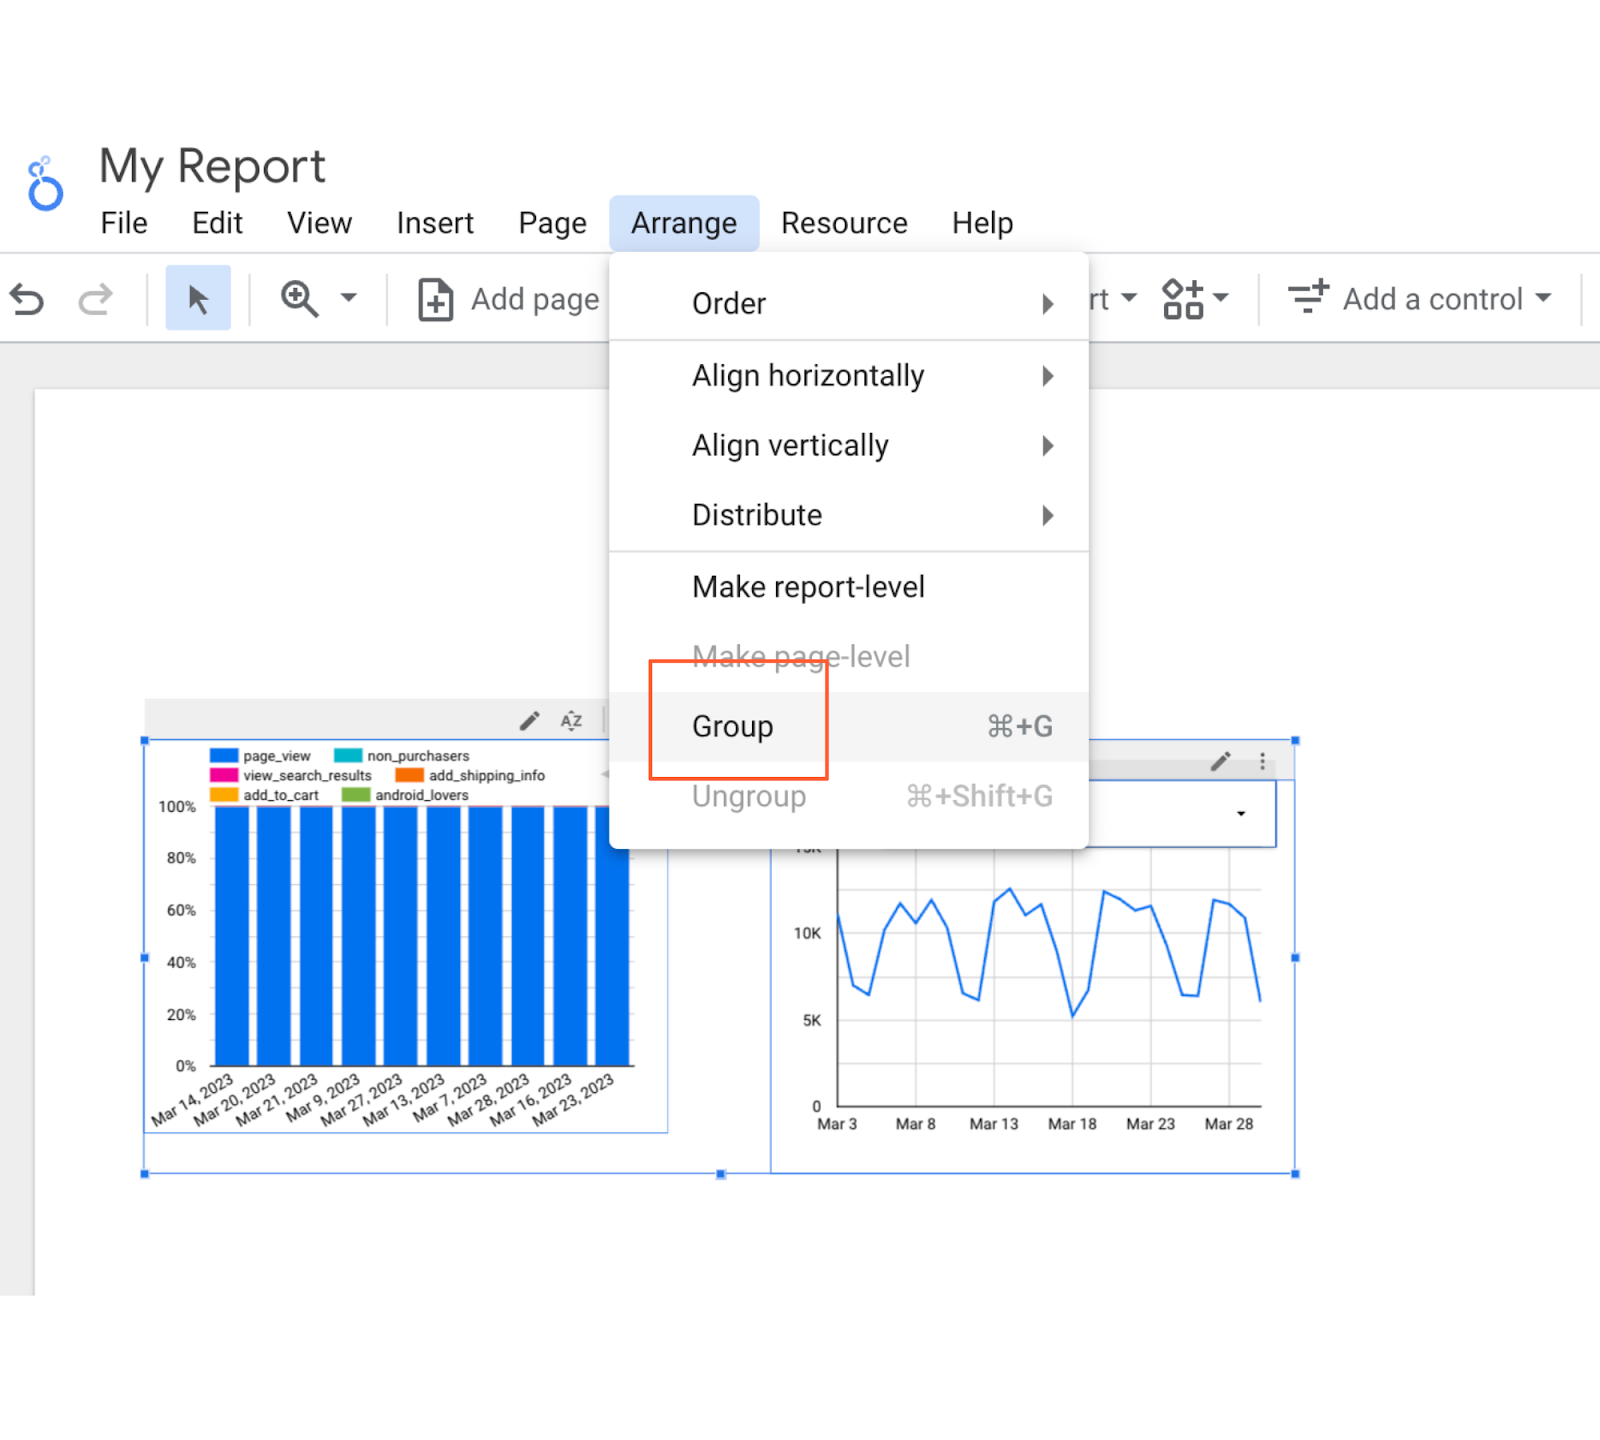
- Group the charts you want to be affected by the date range control with the module. Select the chart(s) and the box, then choose Arrange > Group.
Now, only the chart(s) in this group will update when someone adjusts the date range.
Make sure this setting is clear to your viewers — otherwise, they’ll probably assume all the charts they’re looking at on their current page are using the same time period.
8. Create interactive chart filters.
Want to make it even easier for your audience to filter the charts in your report? Create responsive chart filters.
This sounds fancy, but it simply means selecting a dimension in a chart will filter all the charts on that page for that dimension.
For instance, if you click on “organic” in this chart, the other charts on the page will update to show data for organic traffic only — just like you’d applied a traditional filter control.

You can also create chart controls for time, line, and area charts. For example, if a user highlights say, January through March on a time chart, the other charts on the page will show data for January through March as well — just like date range control.
And also, just like filter controls, you can group chart controls.
To enable chart control, select the appropriate chart. In the right-hand panel, scroll to the bottom and check the box labeled “Apply filter.”
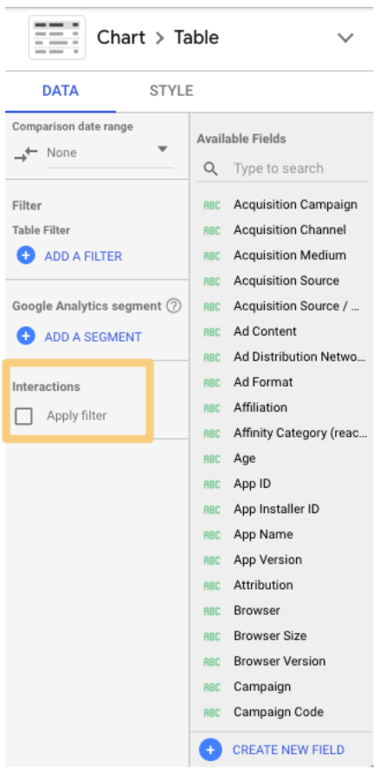
Add a caption next to charts that support interactive filtering, so your viewers know it’s an option:

9. Add a data control.
Data controls may just be one of the coolest Looker Studio features, full-stop. Place one of these bad boys on your report, and you’ll give viewers the ability to choose the source of the data being piped into your charts.
This is a game-changer for anyone managing a complex property or working with multiple stakeholders.
For instance, imagine you’re the admin of HubSpot’s Google Analytics account. You create a Looker Studio report monitoring key website performance indicators, like average page speed, number of non-200 response codes, number of redirect chains, and so on.
You share this report with the blogging team, who has access to the Google Analytics view for blog.hubspot.com. (Need a refresher on how views and permissions work? Check out our ultimate guide to Google Analytics.)
You also share the report with the Academy team, who has access to the GA view for academy.hubspot.com, and the Leads Optimization team, who has access to offers.hubspot.com.
To see this report populated with the relevant data, these teams simply need to select their view from the “data source” drop-down, and voila — all the charts will update automatically.
Pretty nifty, right?
Not only does this save you from rebuilding the same report for different groups, but it also means you don’t need to worry about accidentally sharing sensitive or confidential information. Each viewer can only select data sources they’ve been granted access to.
You can include multiple data controls in a single report.
Add the data control widget to your report by clicking this icon:

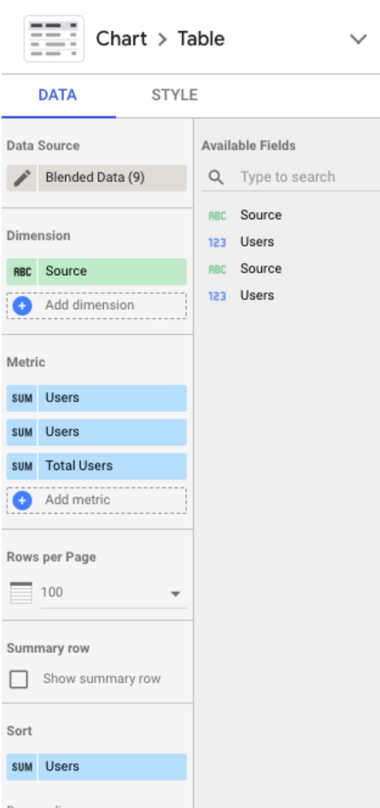
10. Add a dimension breakdown.
Instead of telling you what a dimension breakdown is, it’s easier to show you how it works.
Suppose we want to see users by source. To find out, we create a simple bar chart.
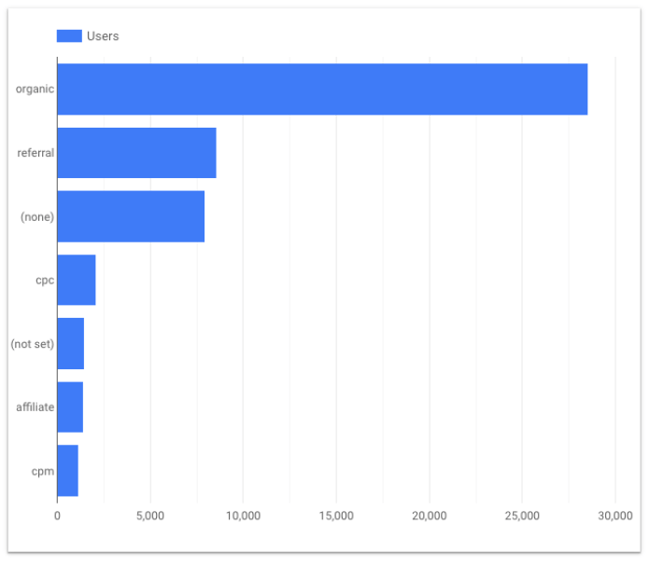
This is interesting — yet there’s some context missing. For example, is all of that organic traffic coming from Google? (Since this is U.S. data, probably, but imagine creating the same chart for China or Japan, where Baidu and Yahoo have a far greater presence.)
What about referral traffic? Clearly, we’re getting a significant number of users from referral links; is a single source driving most of them, or is it distributed fairly equally across a wide variety of sources?
We could create separate bar charts for each source — first filtering by medium and then making the dimension “Source” and the metric “Users.”
Or we could click a single button and have Looker Studio do it for us.
Under Breakdown Dimension, click “Add dimension.”
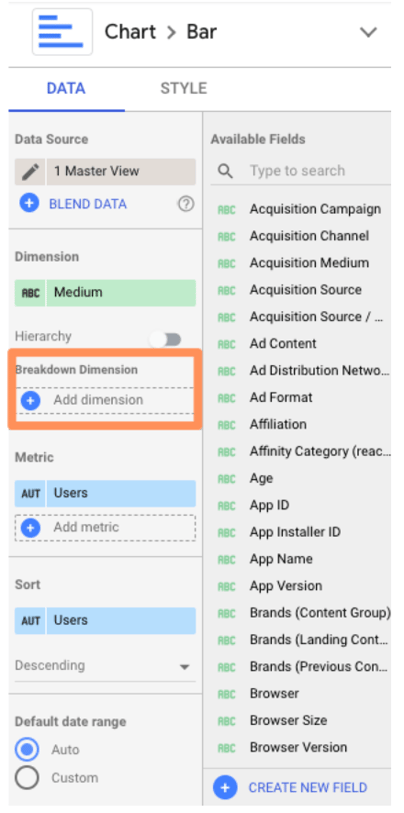
Add “Source.”
Here’s what you should see:

Pretty sure my former Data Analytics professor would cry if he saw this. But don’t worry, we’re not done yet.
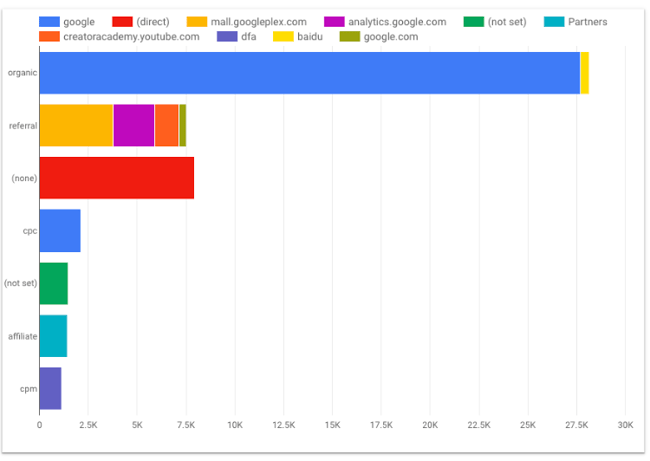
Jump over to the “Style” tab and check the box “Stacked bars” to turn your regular bar chart into a stacked bar chart (you should see the chart type update accordingly).
Looker Studio will automatically make your bar charts “100% stacking,” meaning that every bar will go to the top of the chart. However, this style is misleading — for example, here, it suggests every medium drove the same number of users.
Uncheck this box.

Now check it out:
11. Use Looker Studio Explorer.
To bring any chart into Explorer, mouse over the space next to its top-right corner. You’ll see three vertically-stacked dots appear; click them.
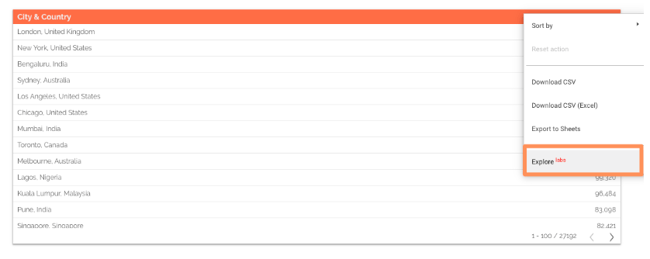
Select “Explore.”
You’ll see something like this:

You can toggle between different visualizations; add and remove dimensions and metrics; change the date range, and apply segments.
Note: Unlike every other Google tool out there, Explorer does not automatically save your work.
To preserve your chart, click the “Save” button on the top nav bar (to the left of your profile icon). Once you do that, your Explorer “report” will be saved in the Explorer section of your dashboard. In addition, every change you make will be saved by default.
Speaking of that dashboard, if you prefer, you can also start with Explorer (rather than a Looker Studio report). Go to your Looker Studio dashboard and select “Explorer” in the top menu.
Create a new Explorer view by clicking the “Create” button on the left side..
At first, Explorer confused me. It feels very similar to the core Looker Studio — what was the point of having both?
However, after spending some time in Explorer, I’ve come to appreciate its unique value.
Unlike Looker Studio, any modifications you make to a chart in Explorer are temporary. That means it’s a great place to dig into your data and try out different ways of visualizing it without making any permanent changes. Then, once you’re happy with your chart, simply export it back into Looker Studio.
To do this, click the small sharing icon in the top navigation bar.

Then choose whether to add your Explorer work on a new or existing Looker Studio report.
Advanced Google Looker Studio Tips
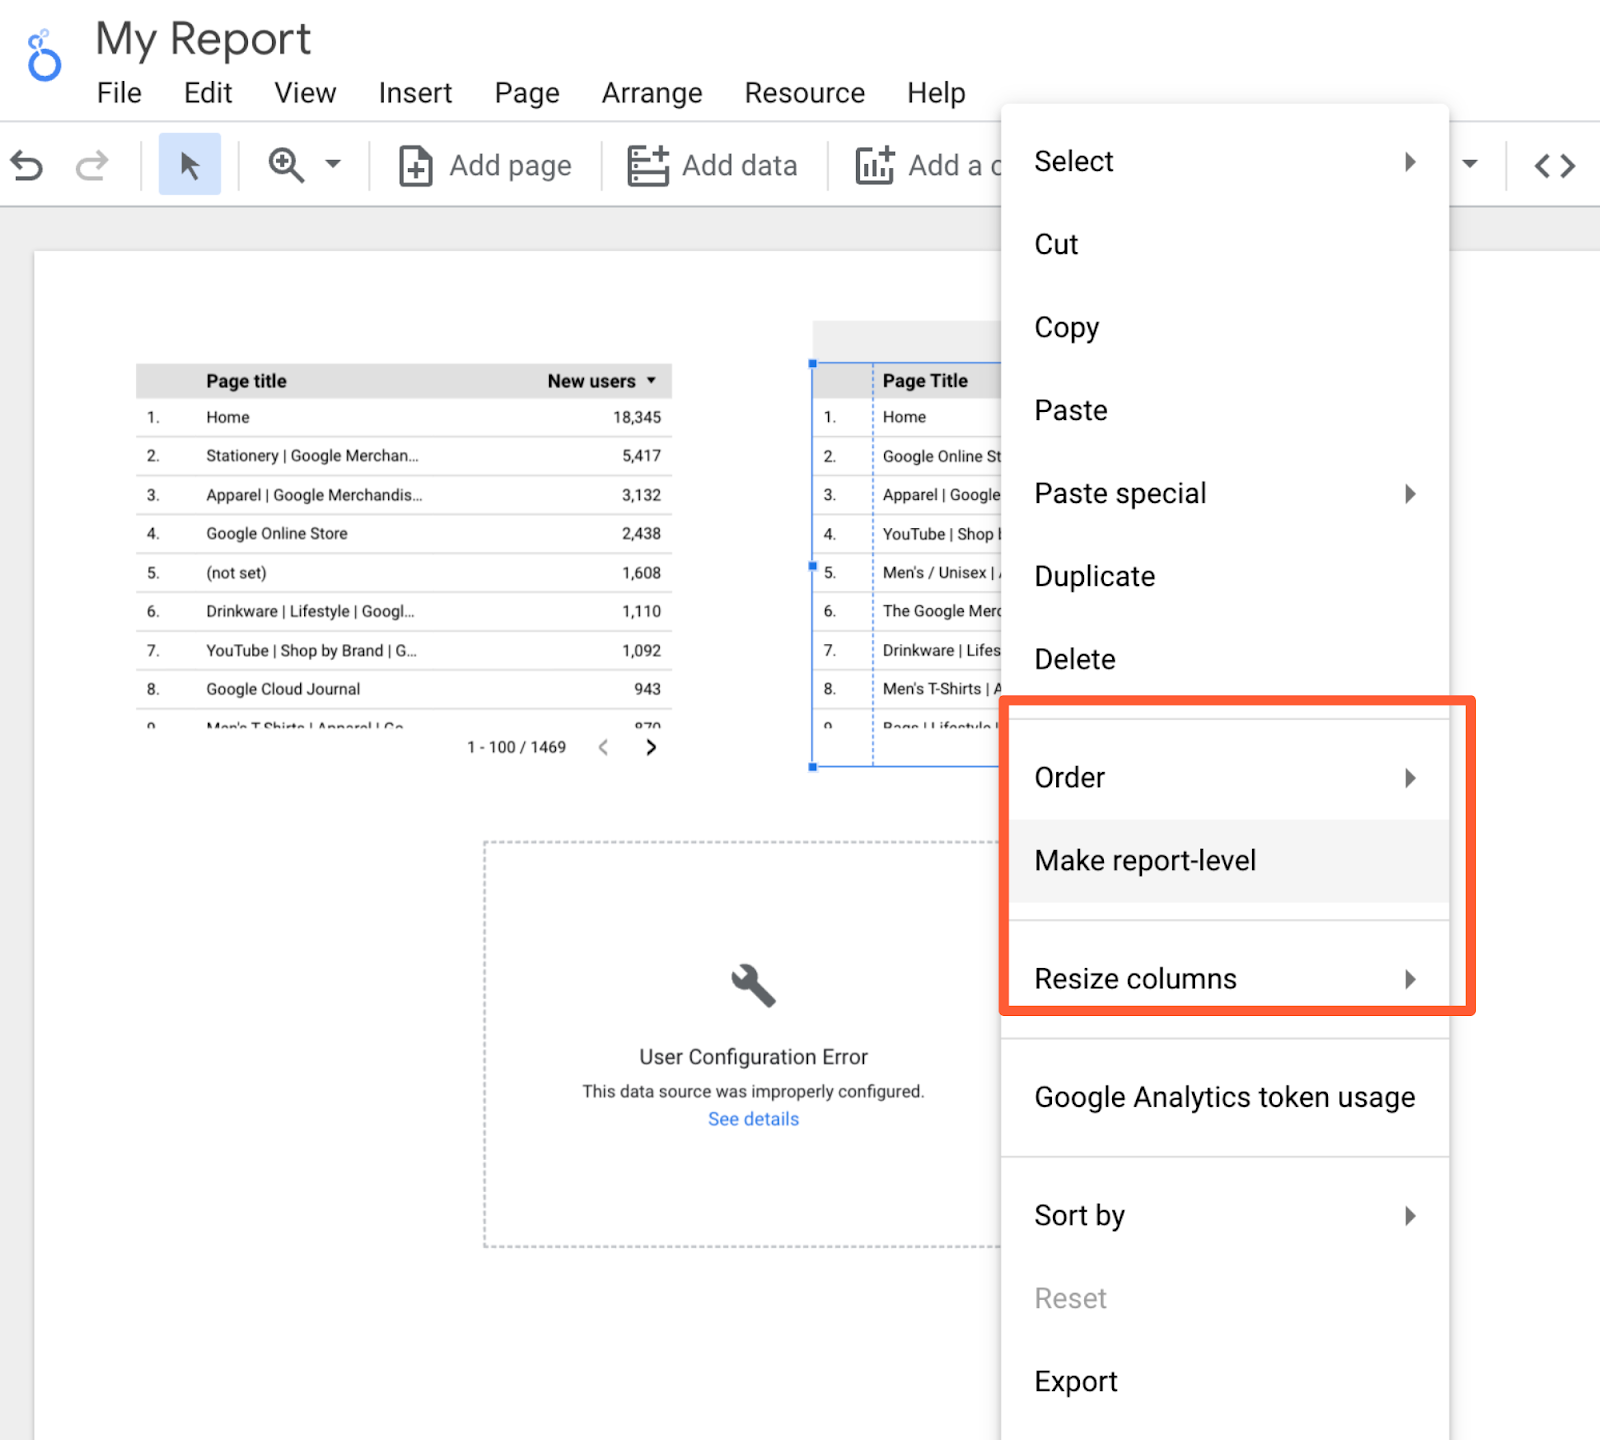
12. Create report-level filters.
By default, a filter applies to every chart on that page. But what if the viewer goes to the next page? The filter won’t go with them.
This is confusing for non-technical folks and inconvenient for data-savvy ones. To bring a filter up from page-level to report-level, simply right-click on it and select “Make report-level.”
13. Create blended fields.
Looker Studio is powerful because you can bring in 760+ sources of data into a single report. But, thanks to a new feature, blended sources, it just got even mightier.
Heads up: this will get a little technical. Stay with me, and I promise it’ll be worth it.
If you’re familiar with JOIN clauses in SQL, you’ll understand data blending right away. No idea what SQL is? Not a problem.
The best way to think about blending data is with a Venn Diagram. You have two data sets. Each data set has unique information — e.g., such as the data living in the green and blue areas.

But they have (at least) one data point in common: the information in the blue-green overlap section.
This shared data point is known as a key. If your data sets do not have a key, they’re not blendable.
For example, suppose you want to compare how users behave on your website versus your app. The key is the user ID, a custom dimension you’ve created in Google Analytics that your app analytics software also uses. (Note: The key doesn’t need to have the same name in both data sources; it just needs to have identical values.)
You blend your website behavior report from GA with your app usage report. This gives you all the records from the first report along with any matching ones from the second; in other words, if a user has visited the site and used the app, they’ll be included.
However, if they only used the app but didn’t visit the site, they will not be included in the new blended data.
This is known as a LEFT OUTER JOIN. (To learn more, check out this W3Schools primer.) Why do you care? Because the order of your data sources matters.
Put your primary data source first — e.g., the one where you want all the values, regardless of whether there’s a match in your second source.
Now that we’ve gotten all that out of the way, let’s set up a blended field.
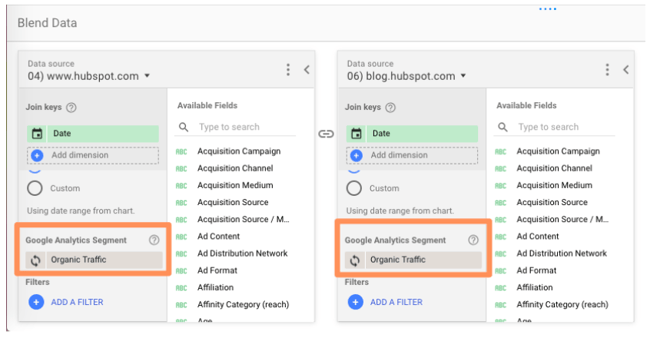
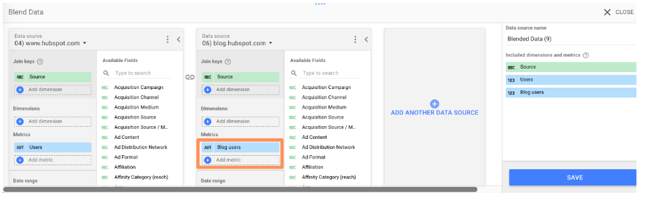
First, add a chart to your report, then click on “Blend Data.”

This panel will pop up:
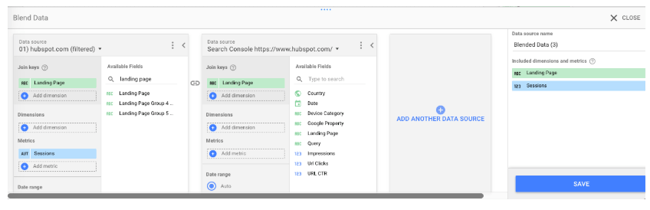
Select your first data source on the left. Remember, this is the primary data source. Then add your second data source. Looker Studio lets you add up to five data sources in a chart, but let’s stick to two for now.
Now pick your join key(s). If the field exists in both sources, it will turn green. If it doesn’t exist, you’ll see this:

Remember that the key acts as a filter for the second data source. So in this example, only records that match the landing page from the GA view for hubspot.com will be pulled from Google Search Console.
Choosing multiple keys will further limit the number of records pulled from the second data source.
Once you’ve picked your join key(s), pick the dimensions and metrics you want to see for your first data source. Then do the same for your second.
You can also limit the results by adding a filter or date range (or for GA sources, segments). Filters, date ranges, and segments applied to the left-most data source will carry over to the other data sources.
Once you’ve finished customizing the report, click “Save.” Congrats: you just created your first blended data chart!
If you find it easier to create two separate charts and then combine them, Looker Studio offers a great shortcut.
Just select both charts, right-click, and choose “Blend data.”

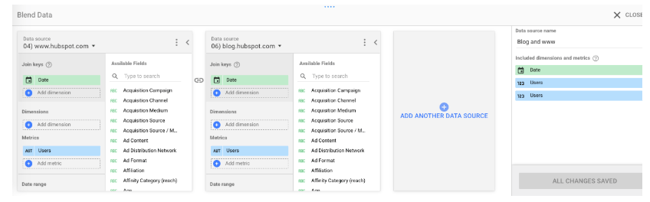
14. Blend your data source with itself.
Try this workaround if you’re bumping into limitations with your data source connectors: blend a data source with itself.
To give you an idea, the GA data connector only lets you add one “active user” metric to a chart, so there’s no way to see 1 Day Active Users, 7 Day Active Users, and 28 Day Active Users on the same chart… unless you blend your Google Analytics data source with itself.
Follow the same instructions as above, but instead of picking a new source for your second data source, just select the first one again.
And since all of the fields are identical, you can pick whichever join key you’d like.

This option is also perfect when comparing trends across two-plus subdomains or segments.
For instance, I wanted to look at organic users for the HubSpot Blog (blog.hubspot.com) and primary site (www.hubspot.com) at the same time.
This helps me figure out if we’re growing search traffic across the board. It’s also helpful when traffic decreases — have rankings dropped site-wide, or just for the blog (or the site)?
However, you can’t add two separate “user” metrics to a chart at once… unless, of course, you’re blending data.
Create a new blended data source (following the same process as above) to set this up.
Add your first view to the left-most column, your second view to the following column, and so on.
Note: Make sure you’re choosing views with mutually exclusive data. In other words, I wouldn’t want to use “blog.hubspot.com” as my first source and “blog.hubspot.com/marketing” as my second source because all the data for the blog.hubspot.com/marketing view is included in the blog.hubspot.com one.
Because of that overlap, we wouldn’t be able to spot trends clearly.
I added the organic traffic segment to both sources, but you can choose whichever segment you’re interested in (paid traffic, social traffic, etc.) Or leave it off entirely! Tons of possibilities here.
In fact, here are some additional ideas for blending a source with itself:
- Compare two-plus custom segments
- Compare two-plus landing pages
- Compare two-plus goal completions
15. Create a basic calculated field.
When your existing data doesn’t give you enough information, it’s time to create a calculated field.
Calculated fields take your data and, as their name suggests, and make calculations.
It’s probably easiest to explain with an example.
Let’s say you want to look at the average number of transactions per user. You can create a calculated field that takes the metric “Transactions” and divides it by the metric “Users.”
Once this field has been created, it’ll be updated automatically — so you can change the chart’s time range, dimensions, etc., and the average transactions per user data will update accordingly.
There are two ways to create a calculated field.
Create a data-source calculated field
This option makes the field available in any report that uses that data source.
It’ll also be available as a filter control or in new calculated fields (like calculated field inception).
Obviously, this is a good option if you plan on using this custom metric more than once. The only caveat — you must have edit rights to the original data source. You also can’t use a data source calculated field with blended data.
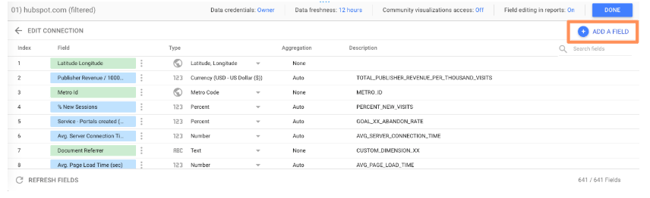
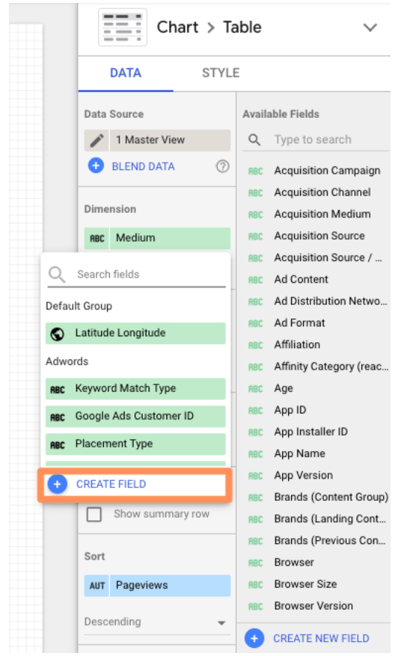
To create a data-source calculated field, add a chart to your Looker Studio dashboard, then choose the data source you want to derive your new field from.
Click “Add a new field” in the lower left-hand corner.

(You can also do this by clicking the pencil next to the data source and then selecting “Add a field” in the upper right corner of your field menu.)
Use the left menu to search for the metrics you need; click one to add it to the formula.
If the formula has an error, a notification will appear in red underneath the editor explaining where you went wrong.
If your formula works, you’ll get a green checkmark.
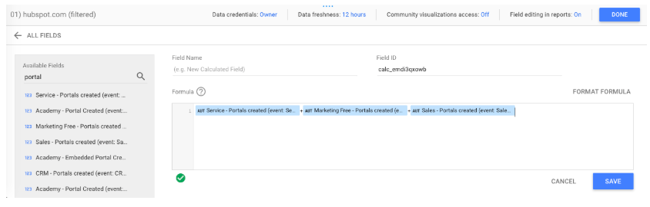
Click “Save” to add your new field to the data source.
And don’t forget to name yours — which I forgot to do. 🙂
Now you can add this calculated field to any chart just like a regular field.
Create a chart-level calculated field
For this option, you’ll only be able to use the field for that specific report.
This option is a little easier because all the limitations of the other type are reversed.
While you can’t use a chart-level calculated field in another chart, filter control, or additional calculated field, you don’t need edit rights to the original data.
You can also use a chart-specific calculated field for data blending, which we’ll cover in the next step.
To create a chart-level calculated field, simply click “Add a field” underneath the existing dimension(s) and metric(s) you’ve selected.
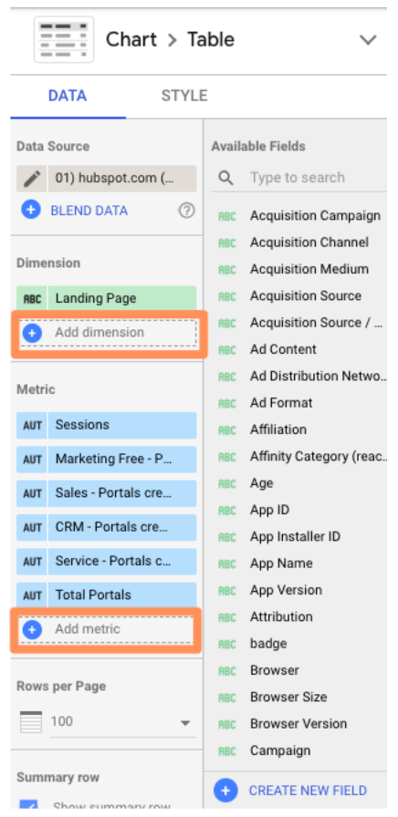
From here, enter the formula for your new field — simply typing in the name of your desired metric will trigger a menu of options — and click “Apply.”
Your new field will be added to the chart.
Loves Data’s Benjamin Mangold has an excellent round-up of sample calculated metrics, including:
- Average goal completions per user
- Non-bounce rate
- Pageviews per transaction
- Value per session
You can check it out for inspiration.
If you want a little practice before you start going to town on your own data, Google offers a handy sample exercise.
16. Create an advanced calculated field.
Okay, so there’s a lot you can do with simple algebraic calculated fields. But there’s even more you can do once you introduce functions and RegEx.
Don’t be scared off! We’ll walk through these step-by-step.
If you’re comfortable with Google Sheets and/or Excel functions, you already know how to use functions in Looker Studio.
For instance, let’s say that you majored in English, and it’s always bothered you that “Source” in Google Analytics is lower-case.
You can use the UPPER function to transform Source into all upper-case.
Simply click “Add dimension” > “Create new field.”
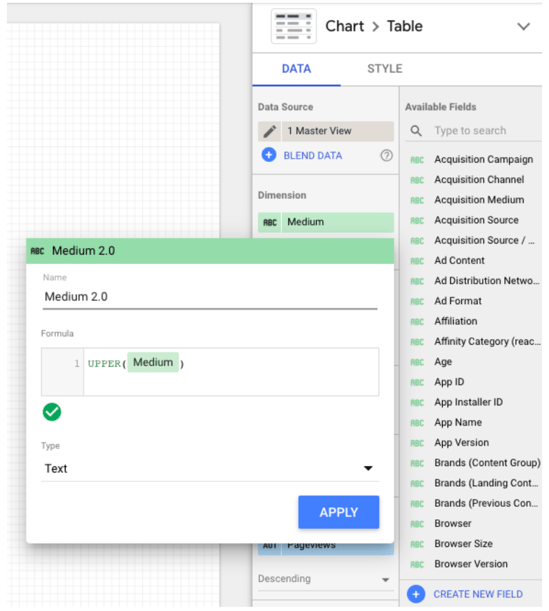
As Google Sheets expert Ben Collins points out, this trick will also standardize any custom naming; for example, if some people on your team used “chat” for a campaign, and others used “Chat,” the UPPER function will aggregate both together.
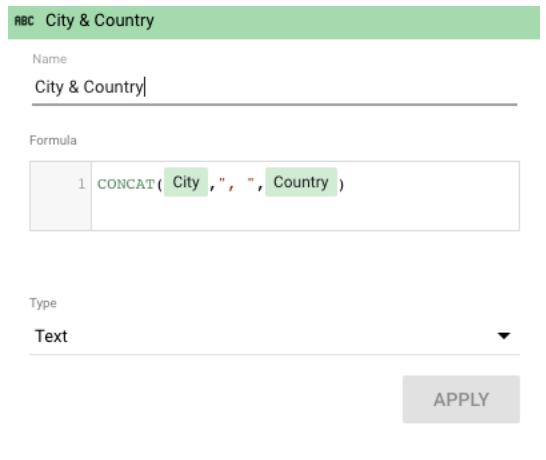
Perhaps you want to create a new field for city and country.
Just click “Add dimension” (since city and state are categorical, not quantitative, variables) > “Create field.”
Then use the CONCATENATE function to smush together the City and Country fields.
Check out the complete list of functions Looker Studio supports.
One of the niftiest is CASE. If you’re unfamiliar, it’s essentially an IF/THEN statement. This function lets you create custom groupings.
For example, let’s say you’re looking at the table we created in the last step:
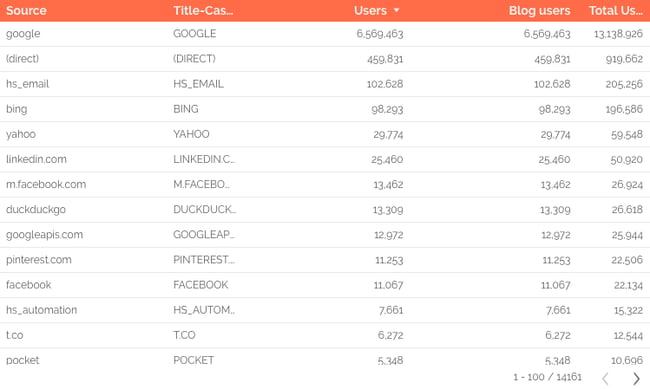
Here, Looker Studio is treating Facebook mobile traffic (m.facebook.com) and desktop traffic (Facebook) as two different sources. There’s also l.facebook.com — desktop traffic coming via a link shim, which Facebook implemented in 2008 to protect users from potential spam. What if you want to combine all Facebook traffic into a single source?
A CASE formula solves this issue neatly. Here’s the formula:
CASE
WHEN condition THEN result
WHEN condition THEN result
ELSE result
END
You can have one condition (like the example below) or several. The ELSE argument is optional, so feel free to leave it out if you don’t need it.
Here’s the formula we’ll use to group Facebook traffic:
CASE
WHEN REGEXP_MATCH(Source,”^(l.facebook.com|m.facebook.com|facebook.com)$”) THEN “Facebook”
END
This formula tells Looker Studio, “If the source matches l.facebook.com, m.facebook.com, or facebook.com, call it ‘Facebook.’”
To add a CASE formula, you must be able to edit the data source.
Click the pencil icon next to your source to bring up the data field editor.
Then click “Add a new field” in the upper right corner.
Enter your formula.

If the formula works, you’ll see a green checkmark. Give your new field a name and click “Save.” Now you can add this field to any chart or data viz that uses this data source.
You might be thinking, “Okay, great, but was that formula written in Klingon? How do I come up with my own?”
Don’t know RegEx? No problem! This blog post has five formulas to get you started.
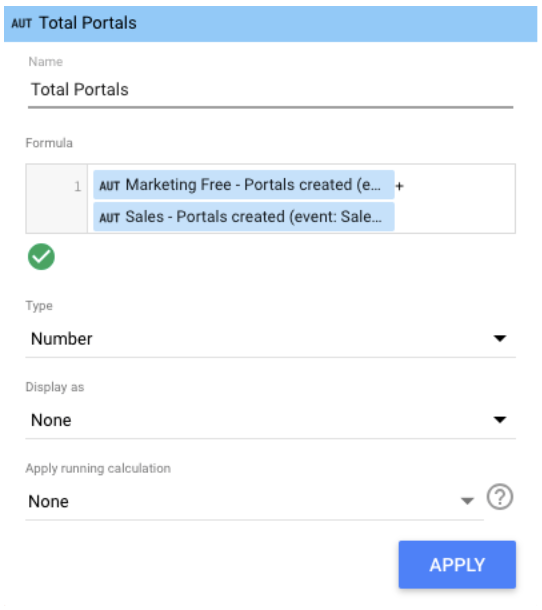
17. Create a calculated blended field.
This is the pinnacle of Looker Studio mastery, requiring all the skills you’ve already learned and a hefty dose of luck — just kidding, it’s super easy.
Create a blended data source per usual.
In this example, I blended together the GA views for www.hubspot.com and blog.hubspot.com.
Then click “Add metric” > “Create Field” as you would to create a normal calculated field.
Enter your formula.
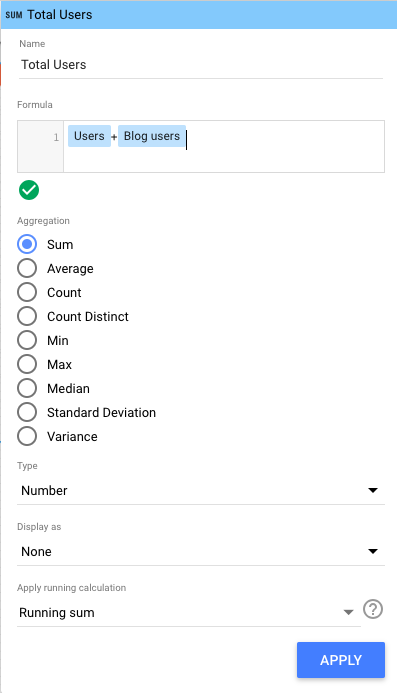
I wanted to see “Total Users” (i.e., users from www.hubspot.com plus users from blog.hubspot.com), which is a simple calculation:
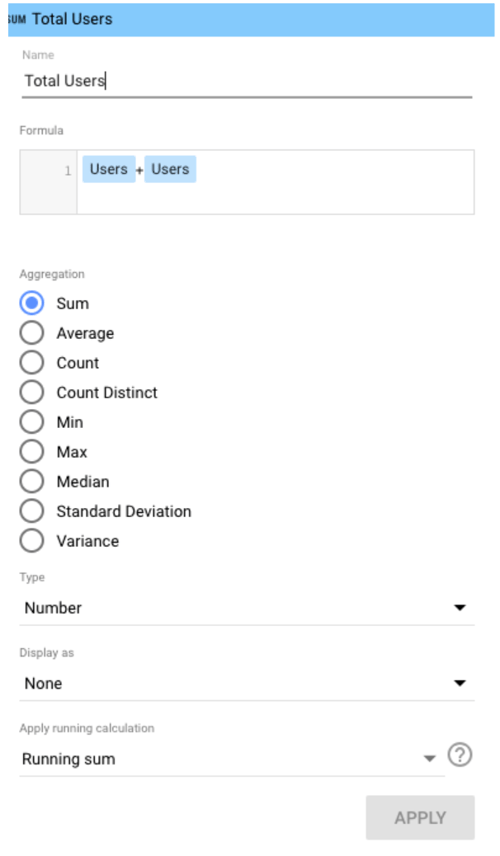
Note: It can get a bit hairy here if you’re using two different fields with the same name, as I’m doing here. Sometimes Looker Studio is smart enough to recognize the difference, and sometimes it’s not.
If you run into issues, I recommend editing the name of one or both fields in the original data source(s), which you can do at any time by clicking the pencil next to the blended data source.
Then click the pencil next to the field name you want to change.
Then click “Save” and go back to your calculated field to update the formula:
Done! I can now see both in my report.
Google Looker Studio is the Best Way to Visualize Your Data
Now that you know Looker Studio inside and out, you’re well-prepared to create stunning interactive reports for your coworkers, clients, and executives. Use the tips I shared above to make the most of it and successfully show the ROI of your marketing efforts.
Editor’s note: This post was originally published in October 2018 and has been updated for comprehensiveness.

![]()
Email Automation: How to Set Up Automated Workflows [Data]
Without email automation, your marketing team misses major opportunities to nurture and engage your target audience and contacts.
In this article, we’ll review common types of email marketing automation, the tools to help you establish and maintain an email marketing automation strategy, and different automation triggers you may implement at your company.
But first, let’s begin by answering the most crucial question: what is email automation?
What is email marketing automation?
Why You Should Use Email Marketing
Email Automation and Marketing Statistics Marketers Should Know
The Benefits of Email Automation
How to Automate Email Workflows
Email Marketing Automation Examples
Automate Your Email Marketing Campaigns

Another common example would be receiving an automated email reminding you to check out the items in your virtual cart after you left a website without making a purchase.
Email automation helps convert leads into customers, delight existing customers, and encourage activities like greater product adoption, upsells, evangelism, and additional purchases.
Top 7 Email Marketing Tools To Automate Emails & Get Clicks!
Why You Should Use Automated Email Marketing
Email marketing automation eliminates time-consuming tasks, such as preparing email lists, sending generic messages, or scheduling events manually. This gives marketers and salespeople more time to work on projects that require their attention (or cannot be fully automated).
Email marketing automation is centered around workflows, a predetermined, triggered set of actions you’re directing your automation software to take for you.
Email Automation and Marketing Statistics Marketers Should Know
- Email is the most frequently automated marketing channel with 65% of marketers leveraging email automation
- 71% of B2B marketers say they use automation in their email marketing efforts
- The number of email users worldwide is expected to 4.6 billion by 2025, more than half of the expected world population.
- In 2022 alone, 333.2 billion emails were sent per day.
.jpg?width=1200&height=628&name=Copy%20of%20Facebook%20Shared%20Link%20-%201200x628%20-%20Percentage%20+%20Copy%20-%20Dark%20(3).jpg)
The Benefits of Email Automation
Let’s take a deeper look into some of the ways email automation can benefit marketers.
1. More Seamless Workflow
Email automation allows marketers to send emails to all of their customers quickly and efficiently — allowing marketers to move on to other tasks while keeping customers satisfied.
In fact, 49% of sales and marketing professionals listed “time savings of repetitive tasks” as one of the top three advantages of automation. 45% listed improved efficiency/ROI as another advantage.
2. Better Customer Experience
43% of marketers say improving customer experience is the number one advantage of leveraging marketing automation.
Automated emails will help you deliver messages that delight customers, such as incentives, helpful reminders, and onboarding content.
Keeping regular contact with your customers will build a better relationship, boost retention, and generate more leads.
3. Improved Email Segmentation
Automated emails make it easier to segment your email recipients based on attributes, behavior patterns, and engagement levels. Doing so leads to an increased engagement rate, open rate, conversion rate, and click-through rate.
4. Fewer Errors
Even if you’re just copying and pasting or reusing templates for your emails, there is still room for error.
Fortunately, email automation has the ability to map individual user variables onto relevant portions of your templates — allowing you to send personalized emails right away.
Now, let’s look at how this process actually works.
1. Select email automation software.
There are several email automation software on the market today — the key is selecting the best option for your business and goals.
For the sake of this article, we’re will work through the following steps in this section by looking at HubSpot’s Marketing Automation tool.
But here are a few more tools for your consideration with their main features and benefits to give you an idea of what these tools are capable of.
Email Marketing Automation Tools
-
HubSpot Marketing Automation: Best email marketing automation software for automating and personalizing email campaigns with CRM integration.
Price: Free
 Get started with HubSpot’s email marketing for free
With HubSpot’s Email Marketing Software, you can create, personalize, and optimize your marketing emails on your own. Marketers can craft professional email campaigns that display perfectly on any device.
You can also send personalized emails based on the subscriber’s lifecycle stage, list membership, or any information in their contact record. This allows for relevant subject lines, links, attachments, and CTAs for all your customers.
Furthermore, the software allows A/B tests to learn which subject lines get the most opens and which content drives engagement and sales.
Pro Tip: Our email automation tools are powered by your HubSpot CRM database, so the data used to customize your marketing emails are accurate.
-
Versium Reach: Best email marketing automation software to visualize and segment customers.
Price: Contact for pricing

Versium Reach allows you to create target audiences that you can use across various marketing platforms (like HubSpot) and channels to help you effectively target and reach those groups through your email (and other digital) campaigns.
Versium Reach helps you visualize and segment your customers so you can tailor your email campaigns to them no matter which stage of the buyer’s journey.
The tool also helps you maintain a cost-effective lead generation strategy — Versium allows you to experiment with a single data source for better-performing customer segments.
-
Mailchimp: Best email marketing automation software for connecting e-commerce and email platforms.
Price: Free Basic Plan, Essentials Plan; $13/month, Standard Plan; $20/month, Premium Plan; $350/month
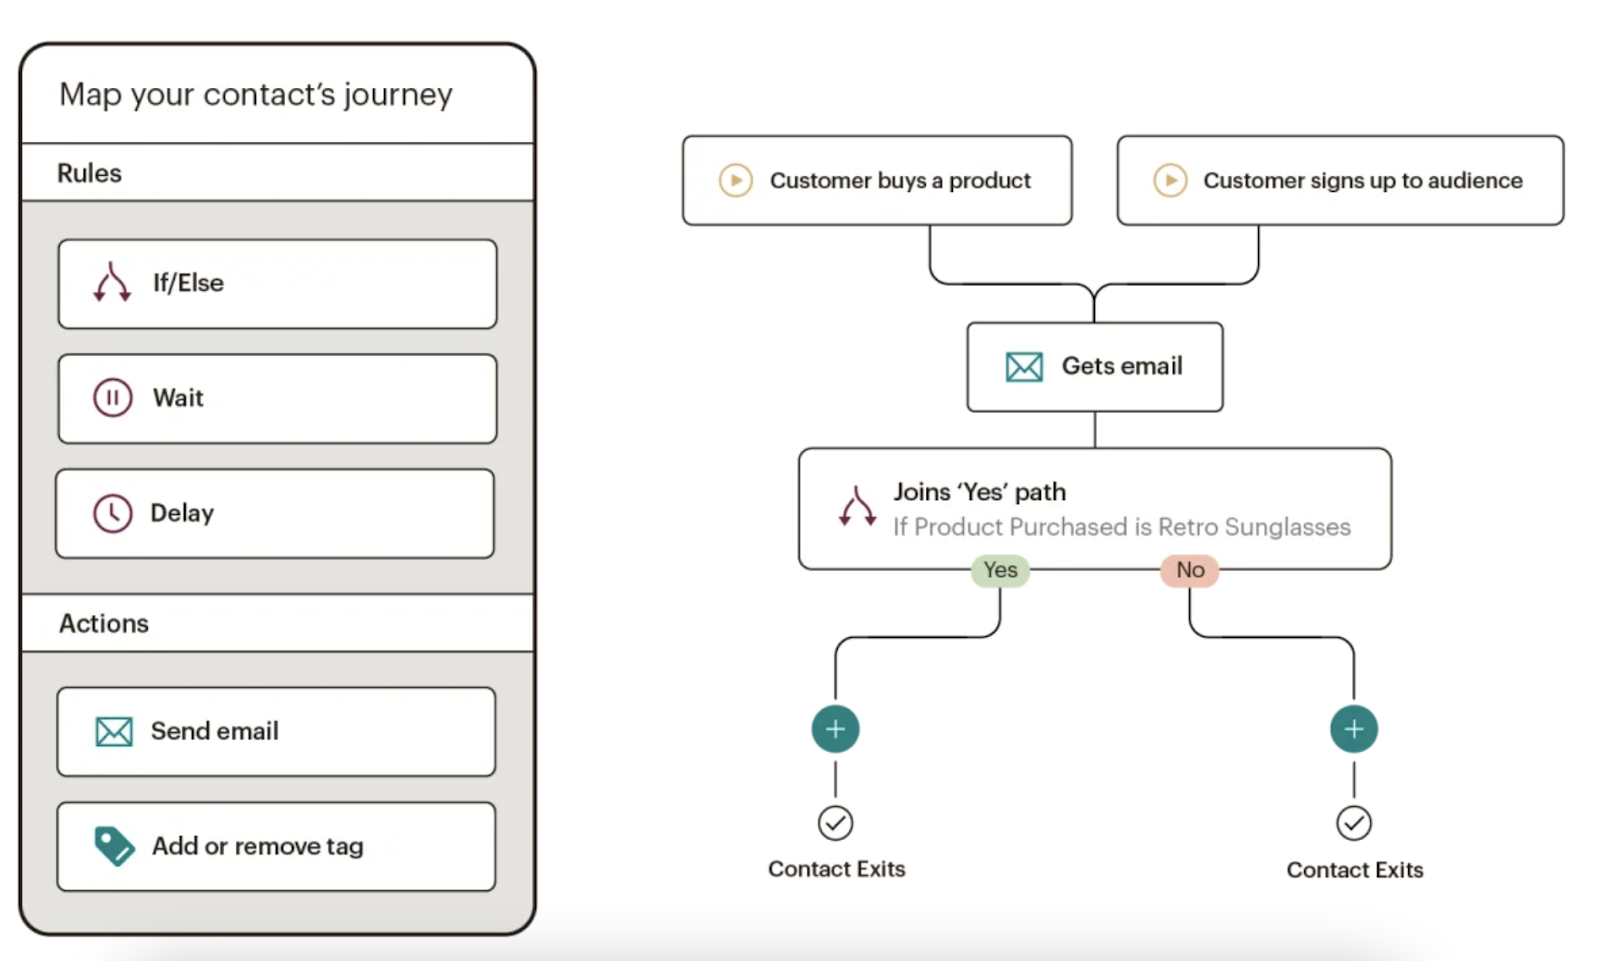
Mailchimp makes it easy to deliver personalized and relevant messages and purchase paths to individuals based on their contact information and how they interact with your company.
Send-time optimization then schedules your emails to be sent when your customers are most likely to engage with them.
Mailchimp offers many e-commerce integrations (e.g. WooCommerce, Shopify) so you can connect your online store to the email tool — this way, you can target customers based on their purchases.
Mailchimp offers six main types of email automation to make your team more productive and efficient. These types are:
- Customer journey automation
- Behavior automation
- Transactional email automation
- Postcard automation
- Date-based automation
- RSS-to-email automation
-
Moosend: Best email marketing automation software for managing several email campaigns and mailing lists.
Price: Contact for pricing
.png?width=624&name=How%20to%20Set%20Up%20Automated%20Email%20Marketing%20Workflows%20(+%20Examples).png)
Moosesend is an email marketing platform for managing several email campaigns and mailing lists. Design and A/B test responsive emails and newsletters to ensure they effectively target your audience.
Personalize your emails by creating condition combinations to segment your audience based on the specific behaviors you care about on your emails and your website.
Understand the success of your email marketing campaigns with Moosend’s analytics dashboard — track email opens, clicks, social shares, unsubscribed, and more.
2. Identify who you’re sharing your email campaigns with.
Determine to whom you want to send your emails. For example, you might use lifecycle stages to group your email recipients — for an upsell campaign, you send emails to existing customers who have not purchased a particular product yet.
Your email marketing tool should be able to help you efficiently segment your customers ahead of your campaign using the criteria you’ve decided upon.
Again, your contact data in your CRM should help with this — for instance, in HubSpot, segment your email recipients by lifecycle stage.
3. Determine your email campaign’s goal.
Your email marketing is only as good as your strategy — so ensure you know exactly why you’re contacting these individuals. Do you want them to buy something? Learn something? Do something?
Once you answer this question, you can figure out the messaging you need to take them from where contacts are currently to where you want them to go.
You also have to plan for what happens when you succeed.
For example, imagine a 10-email series to get prospects to request a consultation. Prospect A converts within the first email. If Prospect A continues to receive emails telling them to do what they’ve already done, they’ll get frustrated.
In HubSpot, if you define your goal, it will unenroll any contacts who meet the goal.

4. Set enrollment criteria.
Enrollment criteria refer to the qualifications that must be met for a contract to be entered into a workflow.
Suppose you’re using HubSpot Workflows. You can create personalized, automated email workflows that can get triggered in a number of different ways.
This can look like a contact added to a list, submitting a form on your website, clicking a link in an email, viewing a page on your blog, clicking on one of your ads, or becoming a marketing-qualified lead.
You can also set up email workflows based on any information you have about the contacts in your marketing database.
This information can include page views, email or social media clicks, content downloads, contact properties, or any combination of these and more.
5. Determine which processes you want to automate with Workflows.
If you were manually emailing these contacts, what would you do? Think of your email marketing workflows as blueprints outlining each action your tool will take.
For instance, specify which actions you want the software to take in HubSpot. Examples of automatable actions are:
- Sending an email.
- Scheduling an email (and/or delaying it).
- If/ then email branching.
- Updating and syncing all email and contact data to your CRM.
-Aug-03-2022-07-32-50-21-PM.png?width=624&name=How%20to%20Set%20Up%20Automated%20Email%20Marketing%20Workflows%20(+%20Examples)-Aug-03-2022-07-32-50-21-PM.png)
6. Create your email campaign assets.
By this point, you know how many emails you want to send, the general messaging you’ll include in the emails, and which groups of customers the emails are going to.
Now it’s time to ensure all of your email campaign assets are created and available in your email automation software so you can add them to campaigns.
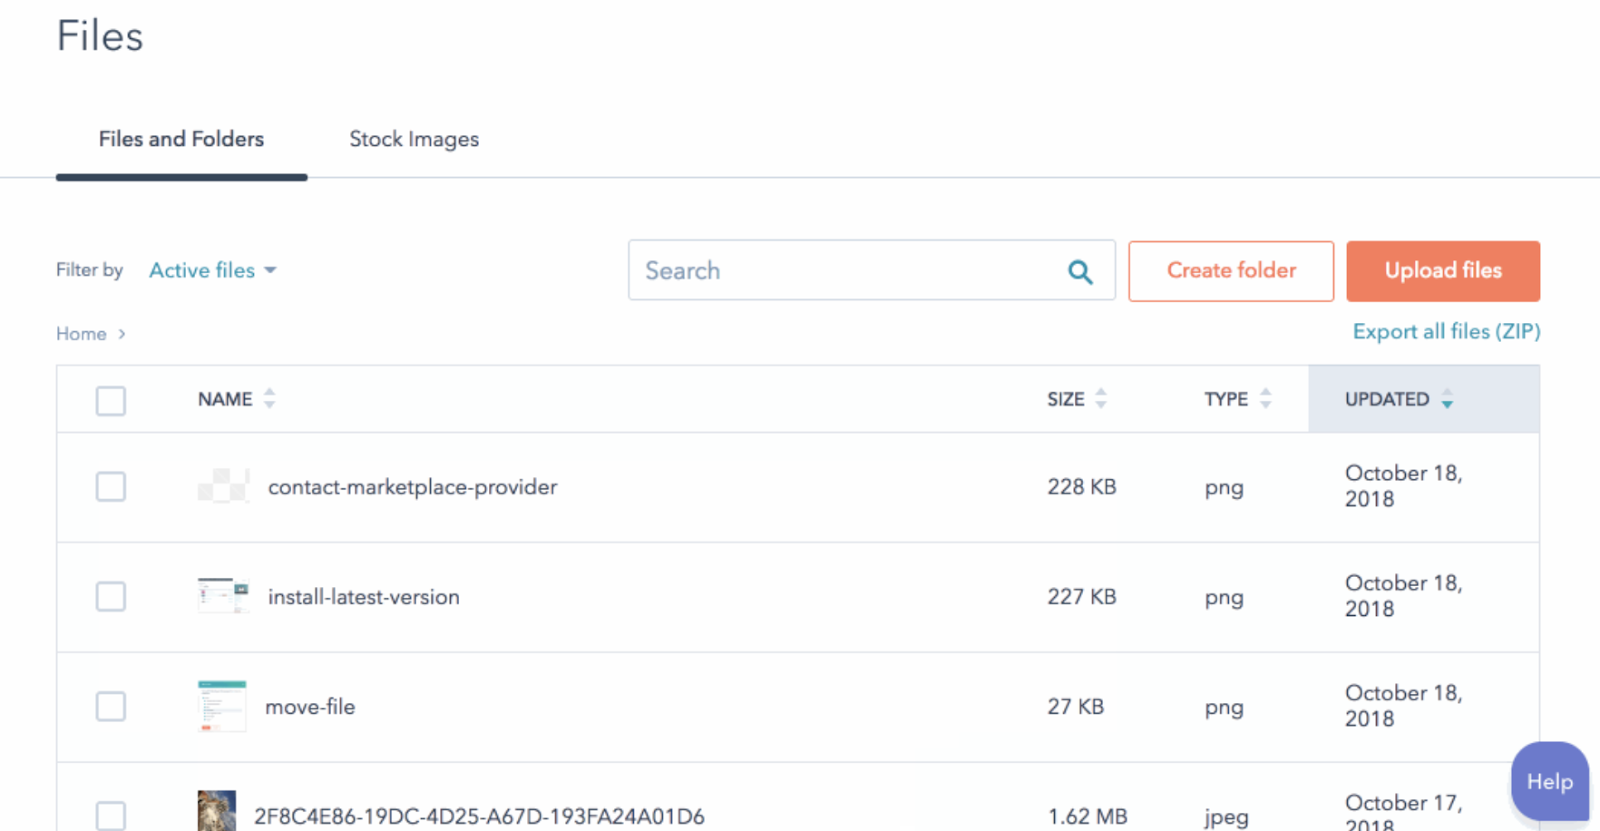
7. Check your email automation setup and run a test, if possible.
Some things to consider implementing into your workflow publishing process are:
- Looking at your list of enrolled contacts for errors.
- Ensuring the number of enrolled contacts is what you’d expect.
- Considering your workflow chart and use cases.
- Checking your “Send” settings.
In HubSpot, you can test your workflow to ensure the automation you plan to set live works as intended.
-3.png?width=624&height=744&name=How%20to%20Set%20Up%20Automated%20Email%20Marketing%20Workflows%20(+%20Examples)-3.png)
8. Make our email automation workflow live and monitor its progress.
Once you’re happy with the workflow, set it live.
Mistakes can happen, so monitor for anomalies. Don’t be afraid to adjust as needed to resolve issues or improve the performance of your email automation workflow.
Similar to your other marketing strategies, this is also an iterative process.
Additionally, you can continually expand upon your workflows to support other business goals. Use them to automate other actions, such as:
- Setting or clearing a contact property value
- Updating a contact’s lifecycle stage
- Adding/removing a contact from a list
other administrative tasks that allow for more targeted, effective marketing to your prospects and customers.
Email Marketing Automation Examples
Now, let’s walk through some examples of automated email workflows you can set up to start getting more out of your contacts database and marketing automation software.
1. Topic Workflows
Main triggers: Page views or content offer downloads.
-4.png?width=624&name=How%20to%20Set%20Up%20Automated%20Email%20Marketing%20Workflows%20(+%20Examples)-4.png)
Create a workflow for each of the industry-related topics you create content about.
Imagine you’re a unicorn breeder whose main content topics include unicorn diets, unicorn gear, and unicorn boarding. Then you could bucket your content marketing offers (e.g. ebooks, webinars, kits, etc.) and blog posts by these topics.
You could also create an email workflow for each topic and then trigger the appropriate workflow when one of your contacts views a page or downloads an offer centered around that topic.
Trigger a content download workflow based on a form submission from a tool conversion tool like HubSpot’s Free Marketing & Lead Generation Software.
To trigger an automated workflow in HubSpot, you can use the “Lead Flow Submission” option as the starting condition.
So if a contact downloaded your e-book called 10 Tips for a Balanced Unicorn Diet, your “unicorn diet” workflow would be triggered, sending that contact more helpful content, such as blog posts describing unicorn dietary tips.
2. Blog Subscriber Welcome Workflow
Main trigger: Subscription to your blog.
-Aug-03-2022-07-32-49-22-PM.png?width=624&name=How%20to%20Set%20Up%20Automated%20Email%20Marketing%20Workflows%20(+%20Examples)-Aug-03-2022-07-32-49-22-PM.png)
Give your brand new blog subscribers a warm welcome with a blog welcome email. Use this email to:
- thank contacts for subscribing
- remind them what they’ll get from reading your blog
- review their subscription settings (and allow them to make adjustments)
- promote your blog’s best-performing articles or other offers
Get tips for creating a successful blog welcome email here, and learn more about optimizing welcome emails here.
3. New Customer Welcome/ Training Workflow
Main trigger: Lifecycle stage.
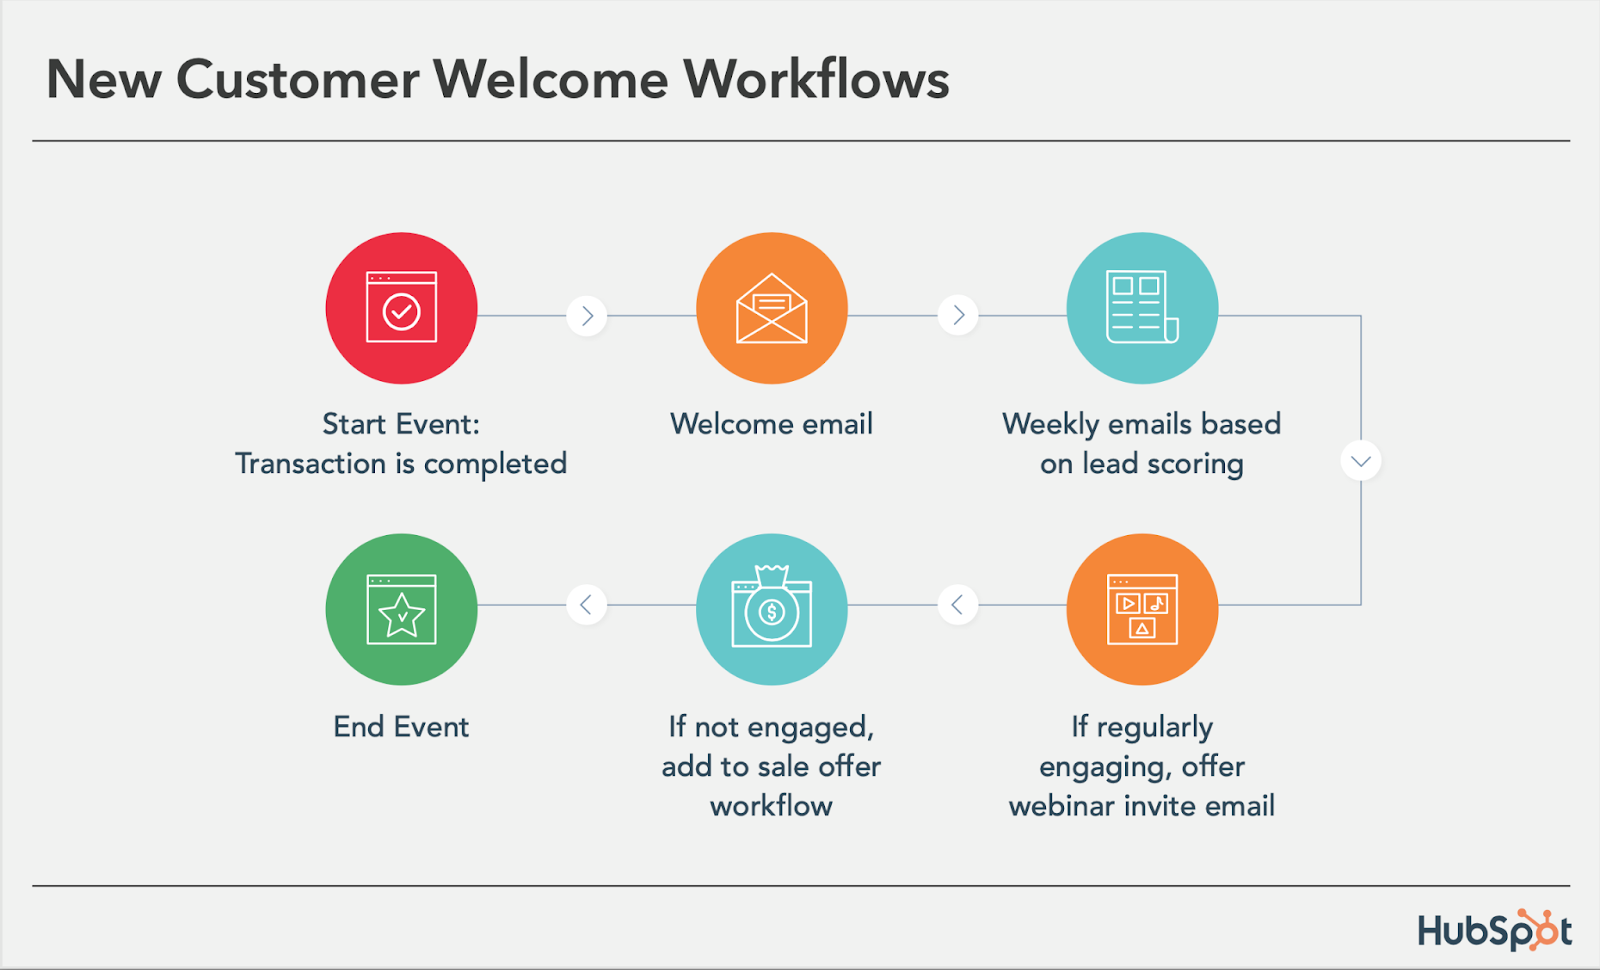
While we’re on the subject of warm welcomes, consider setting up a series of welcome emails when a contact converts into a paying customer, which you can trigger when a contact’s lifecycle stage gets updated to “customer.”
Not only is this a great way to kick off your new customer relationship on a positive note, but it can also keep your customers engaged after they buy.
And if your product or service requires a little training on your customers’ part, use this workflow as an opportunity to introduce helpful training materials on an incremental basis.
4. Engaged Contact/ Evangelist Workflow
Main triggers: Visits, clicks, or form submissions.
-Aug-03-2022-07-32-49-58-PM.png?width=624&name=How%20to%20Set%20Up%20Automated%20Email%20Marketing%20Workflows%20(+%20Examples)-Aug-03-2022-07-32-49-58-PM.png)
Create a smart/dynamic list that automatically updates to include contacts that you’ve really engaged.
To create this list, use trigger criteria such as a high threshold of visits to your website, clicks on your emails or social media posts, or form submissions.
Then create an email workflow to leverage this list to encourage evangelism of your top content on social media.
Because these contacts are highly engaged with you already, they’re more likely to share your top content.
You can also consider adding list criteria to pull in contacts with a certain number of Twitter followers to leverage the power of those social media influencers in your database.
5. Lead Nurturing Workflow
Main trigger: Multiple beginning-stage conversion events.
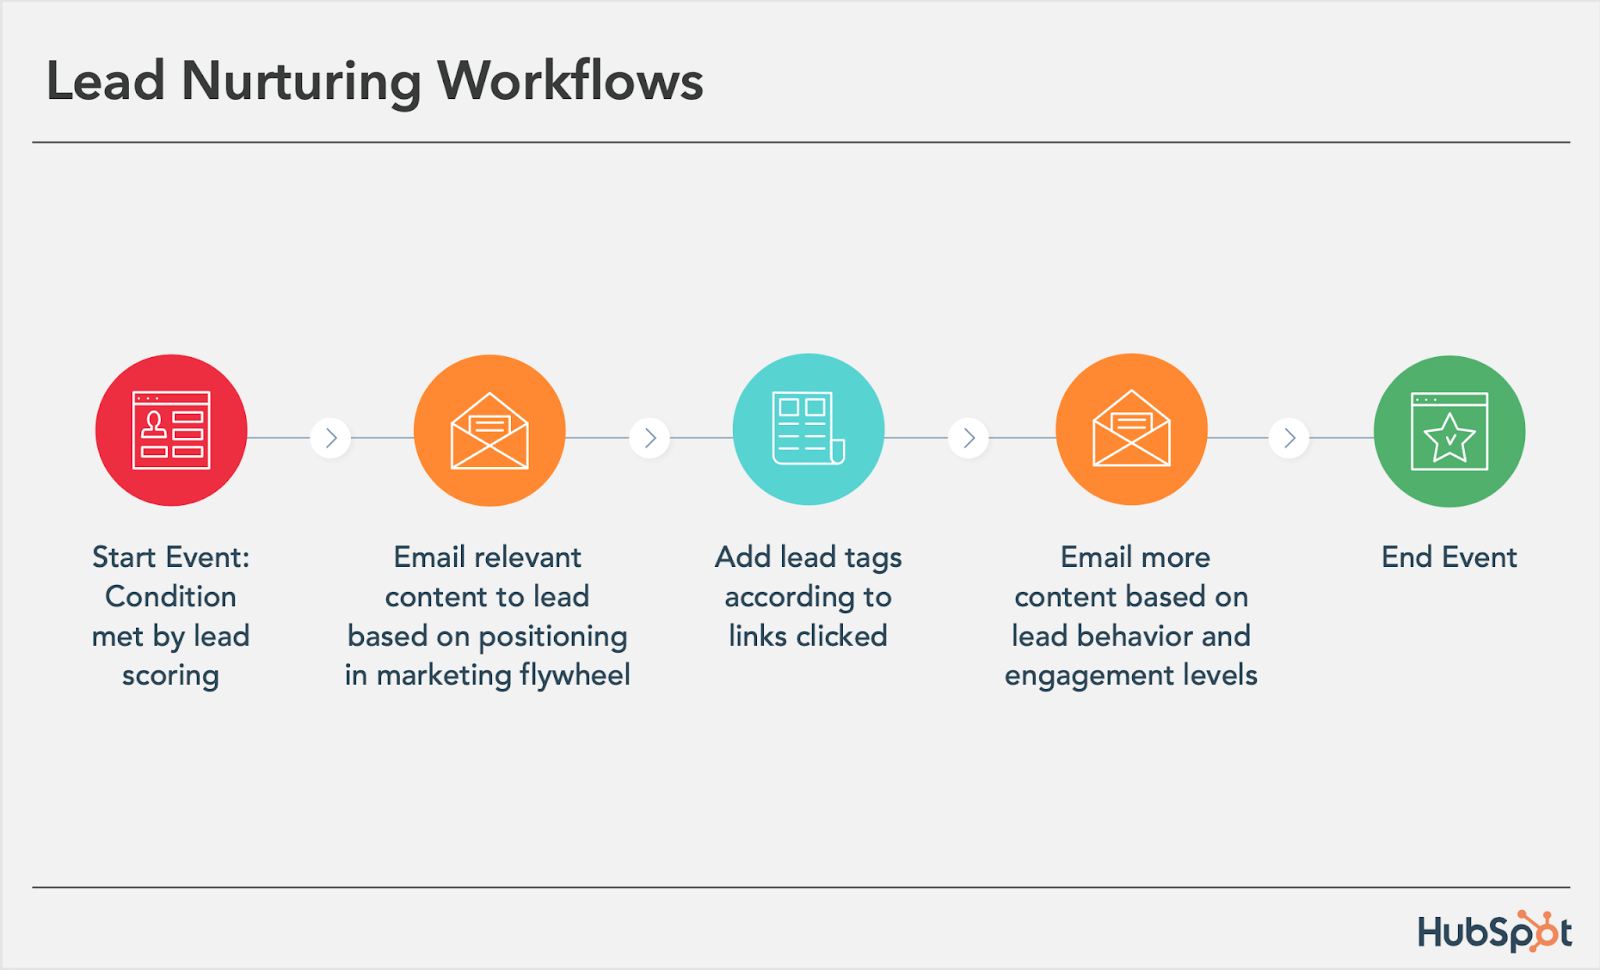
If a contact has downloaded several of your beginning stage marketing offers like ebooks and webinars, it might be a sign that they’re ready for a bit more. Set up workflows that help advance these contacts further through the flywheel.
If the contact is a lead, send them emails containing more content that can upgrade them to a marketing qualified lead (MQL) or an opportunity in your sales process.
This workflow may include content and web pages you’ve identified from an attribution report analysis as influential in converting leads into customers.
Content like customer success stories/case studies, free trial offers, or product demos could be considered.
6. Internal Sales Rep Notification Workflow
Main triggers: Late stage page views/conversion events.
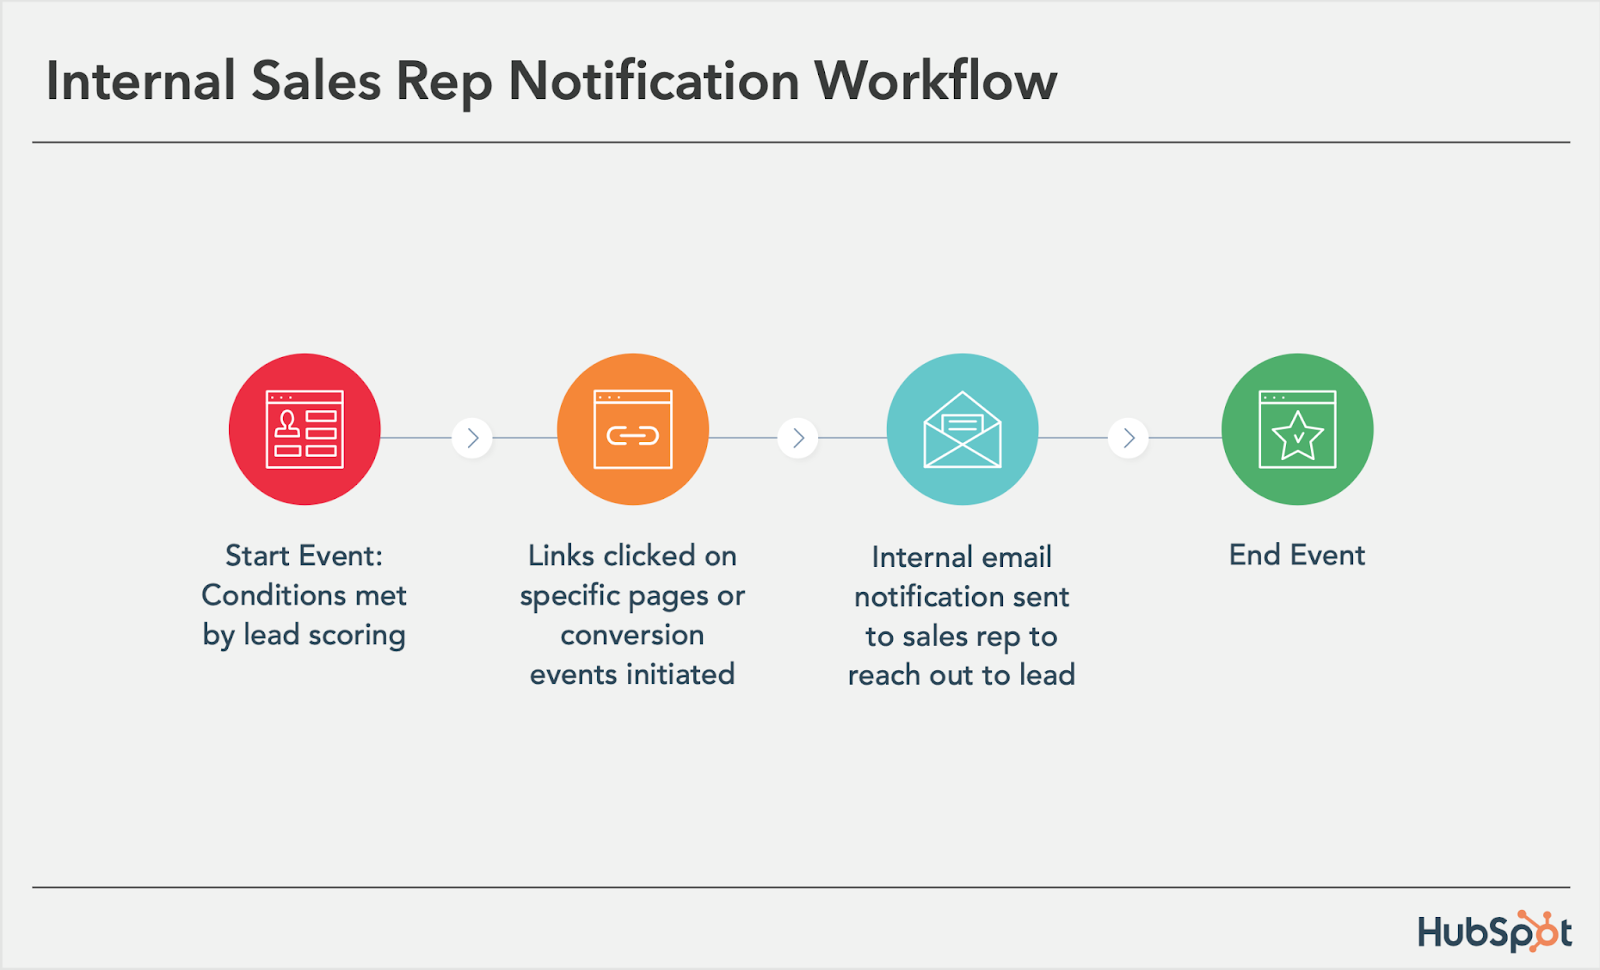
On any given website, there are certain page visits and conversion events that indicate more product interest than others.
First, identify these pages and conversion events using an attribution reporting tool like HubSpot.
You’ll notice that, more often than not, the pages you unearth will be your pricing page, product pages, etc. — the pages that your contacts view when they’re truly considering your products or services.
Use workflows here to trigger an internal email notification to your sales rep to inform them of these high-value activities.
Using personalization, give the rep all the information they need about the lead in question, including relevant mid- and late stage content that they can send to the lead in their outreach email.
This allows you to connect sales reps with the best possible leads at the right time.
7. Re-engagement Workflow
Main trigger: Inactive contacts.
-Aug-03-2022-07-32-48-85-PM.png?width=624&name=How%20to%20Set%20Up%20Automated%20Email%20Marketing%20Workflows%20(+%20Examples)-Aug-03-2022-07-32-48-85-PM.png)
Reawaken inactive contacts with a re-engagement workflow, enrolling contacts once they’ve met certain list criteria.
For example, you could set conditions such as the length of time since their last form submission, website visit, or email click, triggering the email once it’s been a while since a contact last engaged with you.
In your workflow, try sending them an exclusive offer or coupon to get them excited about your company again. For more tips about launching an effective email re-engagement campaign, check out this post.
8. Event Workflow
Main trigger: Registration or attendance.
-Aug-03-2022-07-32-48-49-PM.png?width=624&name=How%20to%20Set%20Up%20Automated%20Email%20Marketing%20Workflows%20(+%20Examples)-Aug-03-2022-07-32-48-49-PM.png)
Hosting a live, in-person, or virtual event? Use email workflows to automate your communication to event registrants and attendees before, during, and after the event.
For example, create a workflow that delivers important information registrants should know leading up to the event, such as hotel accommodations and agenda information for live events, or webinar log-in information for online events.
When the event ends, set up a workflow that gives attendees online access to session slides and continues to nurture them with additional content or promotion for future events.
9. Abandoned Shopping Cart Workflow
Main trigger: Shopping cart abandonment.

If you’re an ecommerce business, you’ll likely benefit from an abandoned shopping cart workflow.
The concept here is simple: When someone adds an item to their online shopping cart but leaves your site without completing the purchase, you can trigger an email workflow that reminds them of their forgotten purchase.
By offering a special discount code or incentive to buy, you motivate the individual to return to your website to complete the transaction.
10. Upsell Workflow
Main trigger: Past purchases.
-2.png?width=624&name=How%20to%20Set%20Up%20Automated%20Email%20Marketing%20Workflows%20(+%20Examples)-2.png)
Communication with your customers shouldn’t stop after they make a purchase. This is especially true if you sell various products and/or services. Use workflows to help you upsell or cross-sell existing customers.
Create dynamically updating lists of contacts who purchase a certain product — or combination of products — and create workflows aimed at recommending other products/ services or encouraging upsells or add-ons.
11. Customer Happiness Workflow
Main trigger: High or low NPS scores.
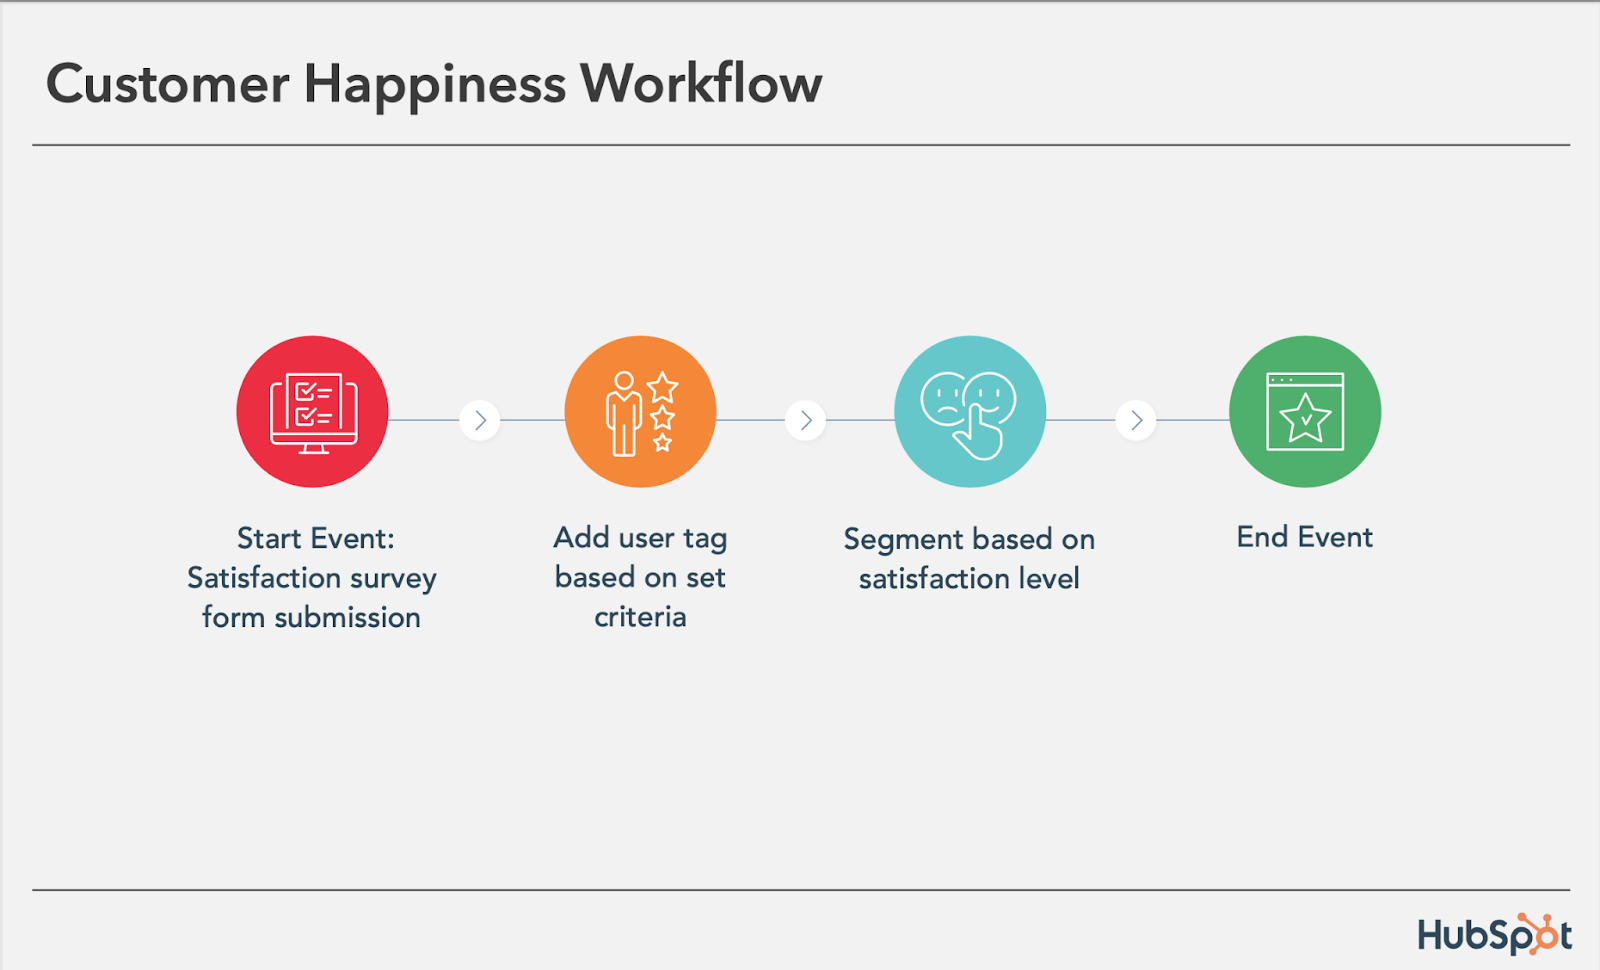
If you administer regular Net Promoter surveys of your customer base, you can use customers’ Net Promoter Scores as a property to trigger workflows.
Simply determine what your ideal customer happiness score is, and use that as the threshold for your dynamic list of happy customers.
Then trigger a workflow for customers with “happy” scores and reward them with exclusive content, offers, or discounts.
Trigger a different workflow for your “unhappy” customers that includes content/offers aimed at helping to improve their happiness.
You can even segment unhappy customers by the specific reasons they’re feeling unsatisfied — then send them even more targeted workflows to address their issues.
12. Customer Success/ Engagement Workflow
Main triggers: Success metrics or product usage.
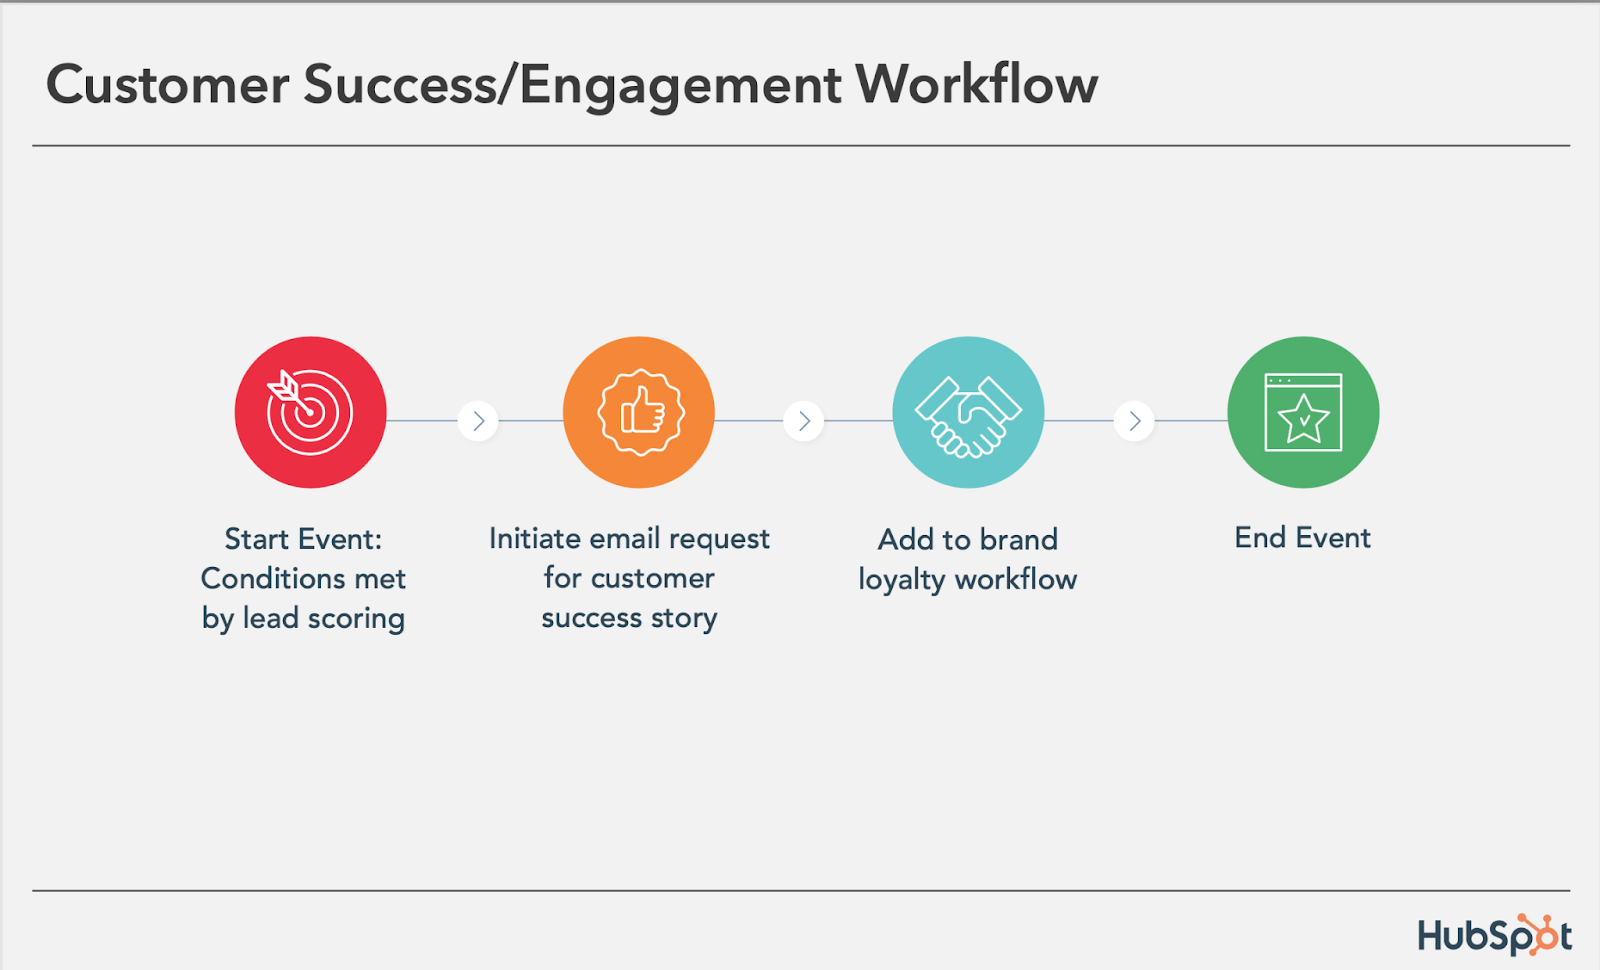
If you keep track of customer success metrics, you have a prime workflow opportunity on your hands.
For example, if you’re trying to build up your arsenal of customer case studies, automatically trigger an email that asks customers if they’d be interested in being featured as a success story once certain customer success metrics were met.
Furthermore, suppose you track customers’ product adoption or feature usage.
In that case, you could trigger a workflow for users exhibiting low product engagement, providing resources that educate and train them on using the product features they’re not taking advantage of.
13. Upcoming Purchase Reminder Workflow
Main trigger: Purchases made on a cycle.
-Aug-03-2022-07-32-48-03-PM.png?width=624&name=How%20to%20Set%20Up%20Automated%20Email%20Marketing%20Workflows%20(+%20Examples)-Aug-03-2022-07-32-48-03-PM.png)
Does your contacts database include customers who typically purchase on a cycle? Enter those people into a workflow that gets triggered when they make a purchase.
For instance, you sell eye care products, and a customer purchases a six-month supply of prescription contacts.
Enroll that customer into a workflow that sends them an automated email five months later as a reminder that their six-month supply is about to run out, and it might be time to order a new batch of contacts.
14. Customer Service or Ticket Workflow
Main Trigger: A customer or prospect contacts customer service via email or an online form.
Your customers or prospects might have trouble using your free or paid software. When this happens, fielding a bunch of customer service emails and messages can take tons of valuable time from your schedule.
One way to avoid this is to create a workflow that turns customer concerns into tickets that can be categorized, labeled, and assigned to customer service reps on your team.
These tickets can also help you track ongoing problems and when issues with a customer or prospect are resolved.
15. Deal-Based Workflows
Main Trigger: When someone e-signs a quote or contract.
Sealing the deal is key to successful marketing and sales. Automating small aspects of this process allows your sales reps more time to nurture the client over the phone, during demos, or via other messages.
With a deal-based workflow, you can trigger confirmation emails when a prospect becomes a client or qualified lead by signing a quote or contract.
With systems like HubSpot, you can also set the workflow to change the contact’s status to show where they are in the lifecycle.
Automate Your Email Marketing Campaigns
Email marketing automation increases efficiency and gives your team back valuable time that can be spent on customers and other work that requires their attention.
Additionally, the process helps optimize your email marketing strategy and personalize email content to increase its effectiveness among your target audience and customers.
Identify your ideal email marketing automation tool and begin setting up the workflows your team needs.
Editor’s Note: This post was originally published in September 2012 and has been updated for freshness, accuracy, and comprehensiveness.

![]()
Wendy’s Took #NationalRoastDay to TikTok — Did It Bring the Heat?
Welcome to HubSpot Marketing News! Tap in for campaign deep dives, the latest marketing industry news, and tried-and-true insights from HubSpot’s media team.
Wendy’s has been serving up sass on social media since 2017.
It all started on Twitter. After the official Twitter account of Mcdonald’s mistakenly shared a tweet with typos, Wendy’s quote tweeted the post saying, “When the tweets are as broken as the ice cream machine.”
The success of this tweet marked the beginning of a new social media strategy for the fast food chain — roasting other accounts.
Wendy’s first National Roast Day was in 2018. Twitter users could drop a Tweet asking to be roasted and the official Wendy’s account would counter with a ruthless response. No Twitter account was safe, and the made-up social media holiday became an annual affair that was a massive success.
In 2022, National Roast Day generated over 130 million impressions in a matter of hours and made Wendy’s an instant trending topic on Twitter.
This year, Wendy’s moved National Roast Day from Twitter to TikTok, turning it into a three-day event from April 12-14 (previously, it was limited to 24 hours). To participate, TikTok users posted videos asking Wendy’s to roast them. The official Wendy’s account then responded with stitched videos delivering roasts from an animated “Wendy.”
If the comment section was any indication, this year’s roast didn’t bring the heat.
Under the roast videos, comparisons to the company’s previous roasts on Twitter were frequently mentioned. Users left comments such as:
- “how is your roast colder than your fries”
- “the Twitter guy is on vacation”
- “Twitter Wendy’s needs to roast TikTok Wendy’s”
- “This person AIN’T the same as Wendy’s Twitter”
Here are a few reasons why the latest roast felt lukewarm compared to previous years.
TikTok’s Strict Community Guidelines
Compared to Twitter, TikTok has more strict community guidelines around what is considered bullying or harassment. Content that is deemed too harsh can quickly be taken down from the video platform, adding limitations to what Wendy’s could say during the roast.
Video Delivery
Sharing roasts via text on Twitter allows a bit more room for interpretation. Users can read the tweets sarcastically or imagine a specific voice delivering the roast. With an animated character delivering the roast, there’s less room for interpretation and the jokes are more difficult to land.
It’s worth noting there were a few gems shared on National Roast Day, like this video directed at AdAge that marketers can appreciate.
Though video presents unique challenges to delivering the type of humor Wendy’s is known for, moving National Roast Day to TikTok was likely a valuable experiment that will help Wendy’s social team hone in on its short-form video strategy.
While the roasts may not have been hot, the stats around National Roast Day 2023 were still impressive. During the three-day roast, Wendy’s shared 111 videos garnering over 109 million views and counting.
Elsewhere in Marketing
The latest marketing news and strategy insights.
Digital ad revenue grew in 2022. However, the growth was noticeably slower than 2021.
Can YouTube Shorts help creators grow on YouTube? Check out this study analyzing over 5,400 videos.
Meta rolled out a Reels hub on Instagram to help creators identify trending audio and hashtags. The Reels editing tool has also received enhancements.
TikTok ban: lawmakers in Montana voted to ban TikTok on personal devices within the state.
Instagram isn’t dead: why marketers are continuing to prioritize the platform.
Case study: how MrBeast has garnered millions of views, and what marketers can learn from him.
![]()
12 Incredible Answers to “What Is Your Greatest Weakness?” — That Aren’t “Perfectionism”
So, you’ve finally got your foot in the door at your dream company. You’ve submitted the perfect resume and made a lasting impression during the phone screen. All there’s left to do now is to win over the hiring manager in the face-to-face interview.
![Free Guide: 50 Common Interview Questions [Download Now]](https://no-cache.hubspot.com/cta/default/53/aac5dac8-7420-4881-a73f-ee611981ae3a.png)
As a well-informed candidate, you’re doing your research on the company and preparing your answers to the most important interview questions you can think of — the most notorious of them all being: “What is your greatest weakness?”
You don’t want to respond, “I tend to work too hard,” or “I am too much of a perfectionist.” That can easily come across as scripted and insincere at best and lacking in self-awareness at worst.
Alternatively, you don’t want to respond with weaknesses that will prevent you from succeeding in the role. For instance, if you’re applying to be a project manager, you don’t want to admit that you’re “not very good with time management.”
Fortunately, there are ways to answer this question that will help you demonstrate your value as a candidate. Here, we’ve cultivated some incredible answers to the mainstay, “What is your greatest weakness” question — and don’t worry, these answers aren’t “perfectionism.”
Best Answer for What is your weakness?
Interviewers who ask “What is your greatest weakness?” want to know how honest and self-aware you are. They are also looking for evidence that you have a drive to improve upon your weaknesses. The best answers to this question sincerely explain a weakness and provide an example of how you are actively working on being better.
1. Choose a weakness that will not prevent you from succeeding in the role.
When an interviewer asks, “What is your greatest weakness?” they want to find out:
- Whether you have a healthy level of self-awareness
- Whether you can be open and honest, particularly about shortcomings
- Whether you pursue self-improvement and growth opportunities to combat these issues, as opposed to letting these weaknesses hold you back
Ultimately, you’ll want to use this question to demonstrate how you’ve used a weakness as motivation to learn a new skill or grow professionally. Everyone has weaknesses — your interviewer doesn’t expect you to be perfect.
If you’re applying for a copywriting position with little necessity for math skills, you might admit, “I struggle with numbers, and don’t have much experience with data analytics. While math is not directly tied to my role as a writer, I believe it’s important to have a rudimentary understanding of Google Analytics to ensure my work is performing well. To tackle this weakness, I’ve been taking online courses in data analytics.”
An answer like this shows the hiring manager that you recognize your areas for growth and are able to act on them without being told to do so. This kind of self-starter attitude is a plus for virtually any team.
2. Be honest and choose a real weakness.
The answer “perfectionism” won’t cut it when talking about your biggest weakness because it’s not a real weakness. Perfectionism can never be attained — it’s a fear-based pattern that leads to short-term rewards like getting the job done early and exceeding expectations. However, in the long-term, trying to attain perfectionism leads to burnout, low-quality work, and missed deadlines. Burnout is one of the biggest contributors to decreased productivity, turnover, and low employee engagement — all of which cost a company money, time, and talent.
Instead, choose a real weakness. Underneath the desire to do perfect work may lie a weakness of trust. Perhaps you don’t trust that you’ll be able to make mistakes on the team, so you strive to do everything perfectly. That’s a real weakness that you can definitely overcome.
3. Provide an example of how you’ve worked to improve upon your weakness or learn a new skill to combat the issue.
Hiring managers don’t expect you to overcome your weaknesses completely overnight. Everyone has areas they must constantly work on to keep them sharp. Think of it this way — if you’ve dedicated six months to working out, you won’t be able to stop one day and maintain your progress. It’s an ongoing process that you have to work at.
4. Think about weaknesses in your own personal life.
If you humanize yourself in the interview, it’ll allow your interviewer to connect and visualize working with you in the future. It’s not just about weaknesses that pertain to the job. For example, if you are an introvert and you notice your preference for quiet time stops you from taking risks, this is a relatable weakness. When you demonstrate your self-awareness this way, it shows you understand that self-improvement correlates to work performance.
5. Think of where you’d like to be and what support you need to get there.
Overall, growth is a part of life. Think about people you look up to that may be related to the field that you’re in. Ask yourself what character traits those people have and what work you might need to do in order to get there. By providing an example of how you’re working to improve your area of weakness, you’ll give the interviewer a glimpse into a few positive attributes about your awareness, including that:
- You know how to identify and mitigate issues that come up.
- You’ve found a helpful solution to a problem that you and perhaps others on the team face, which means you can be an immediate resource to the team.
- You demonstrate self-awareness and an ability to take feedback from others.
More often than not, you’re going to need to look outside of yourself to overcome a weakness. Whether you look to your supervisor, the HubSpot Blog, or a mentor for help, the simple act of seeking help demonstrates self-awareness and resourcefulness — two skills that are hard to teach, but valuable to learn. Tapping into your resources shows the interviewers that you can solve problems when the answer is not yet clear. That’s a character trait that has a place on any team.
Briefly share an example of a time when you asked someone for help in an area that you’ve identified as a weakness. This gives the hiring team a clear picture of how you’ll work with the team to balance out that weakness.
6. Don’t be arrogant and don’t underestimate yourself.
The most important thing you can do when responding to the question “What is your greatest weakness?” is exhibit confidence in your answer. (If lack of confidence is your weakness, keep reading.) Even if you’re not the most confident person, I’m going to assume you’re at least honest with yourself. If you’ve identified an area of weakness and you’re sure about it, let that assurance shine through in your answer. There’s no need to feel embarrassed about something you’re genuinely not good at as long as you’re working to get better.
Before you start expressing a genuine weakness to your interviewer, get comfortable with the types of answers that make hiring managers want to work with you. Take a look at the following examples and find a few that fit your personality and work style. Then, practice reciting them aloud so they come naturally to you.
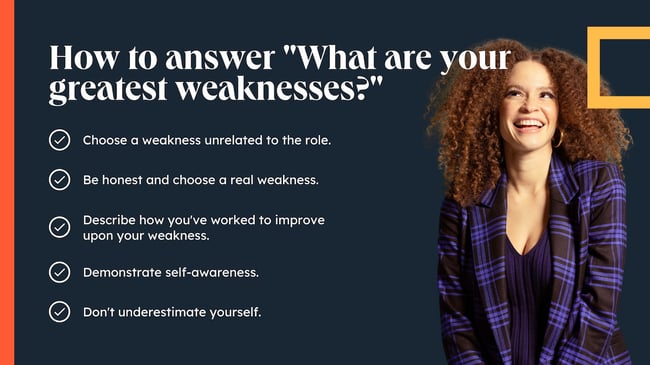
How to Identify Your Greatest Weakness
As we already mentioned, your answer must be honest while also not jeopardizing your chance at getting the job. So, how exactly do you figure out which weakness to talk about? Here are some tips:
1. Rule out any skills that are listed in the job description.
Scan through every detail of the job listing and make sure weakness isn’t included in the required skills and responsibilities.
For example, say you’re applying to be a senior product marketing manager. The job description says that the company is looking for someone who is a skilled storyteller, can interpret data and market research, and is self-driven and adaptable to change.
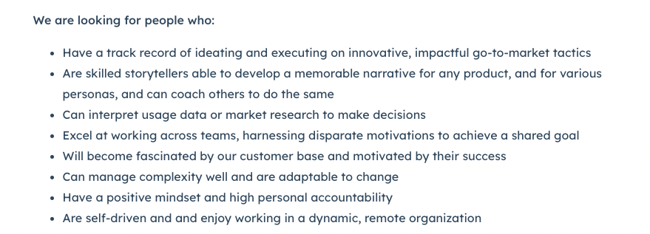
Because these are essential skills for the role, you wouldn’t want to mention them as your weakness. Doing so would make you seem less competent and risk your chances at getting the job.
2. Consider weaknesses that you have overcome.
While preparing your answer, reflect on what you’ve learned and improved while working in your current role.
Talk about your early struggles in learning or improving upon a skill and explain to the interviewer what you did to overcome it.
For example, early on in my career I struggled with analyzing and interpreting marketing data. In order to improve these skills, my manager mentored me and gave me weekly assignments that allowed me to practice data interpretation.
Within a few months, I went from being a content marketer who was averse to data to one who embraced it.
3. Find inspiration by looking through old performance reviews.
If you’re having trouble thinking of a specific weakness example, read through old self-assessments and performance reviews. These documents provide examples of your strengths as well as the areas you can improve upon, making them a great source of inspiration.
Depending on how long you have worked at your current company, you may be reminded of old weaknesses that you now consider strengths. This can help you craft an answer that shows your willingness to work on yourself.
Ready? Here are examples of how you might answer “What is your greatest weakness?” and why they work.
1. Lack of Patience
Sample Answer:
“I don’t have much patience when working with a team — I am incredibly self-sufficient, so it’s difficult when I need to rely on others to complete my work. That’s why I’ve pursued roles that require someone to work independently. However, I’ve also worked to improve this weakness by enrolling in team-building workshops. While I typically work independently, it’s important I learn how to trust my coworkers and ask for outside help when necessary.”
This answer works because the weakness — the inability to be patient when working with a team — doesn’t hinder your ability to perform well in the role, since it’s a job that doesn’t rely on teamwork to succeed. Additionally, you display an eagerness to develop strategies to combat your weakness, which is a critical skill in the workplace.
2. Lack of Organization
Sample Answer:
“I struggle with organization. While it hasn’t ever impacted my performance, I’ve noticed my messy desk and cluttered inbox nonetheless interfere with my efficiency. Over time, I’ve learned to set aside time to organize my physical and digital space, and I’ve seen it improve my efficiency levels throughout the week.”
Plenty of people have messy desks. This answer works because it’s a relatable and fixable weakness. You note that disorganization doesn’t interfere with your ability to do your job, which is critical, but you also acknowledge it might make you less efficient. To ensure you’re performing at 100%, you mention personal steps you’ve taken to improve your organization skills for the sake of self-improvement alone, which suggests a level of maturity and self-awareness.
3. Trouble with Delegation
Sample Answer:
“I sometimes find it difficult to delegate responsibility when I feel I can finish the task well myself. However, when I became manager in my last role, it became critical I learn to delegate tasks. To maintain a sense of control when delegating tasks, I implemented a project management system to oversee the progress of a project. This system enabled me to improve my ability to delegate efficiently.”
This answer allows you to demonstrate an ability to pursue a new skill when a role calls for it and suggests you’re capable of flexibility, which is critical for long-term growth. Additionally, you are able to showcase a level of initiative and leadership when you mention the successful implementation of a new process that enabled you to succeed in your past role, despite your weakness.
4. Timidity
Sample Answer:
“Oftentimes, I can be timid when providing constructive feedback to coworkers or managers, out of fear of hurting someone’s feelings. However, in my last role, my coworker asked me to edit some of his pieces and provide feedback for areas of improvement. Through my experience with him, I realized feedback can be both helpful and kind when delivered the right way. Since then, I’ve become better at offering feedback, and I’ve realized that I can use empathy to provide thoughtful, productive feedback.”
This answer works because you’ve explained how you were able to turn a weakness into a strength through real-world experience. Typically, timidity can be seen as a flaw in the workplace, particularly if a role requires someone to provide feedback to others. In this case, you’re able to demonstrate how timidity can be used as a strength, through thoughtful reflection and practice.
5. Lack of Tactfulness
Sample Answer:
“My blunt, straightforward nature has allowed me to succeed over the years as a team manager, because I’m able to get things done efficiently, and people often appreciate my honesty. However, I’ve recognized my bluntness doesn’t always serve my employees well when I’m delivering feedback. To combat this, I’ve worked to develop empathy and deeper relationships with those I manage. Additionally, I took an online leadership management course, and worked with the professor to develop my ability to deliver feedback.”
Oftentimes, facets of our personalities can help us in certain areas of our work, while hindering us in others. That’s natural. However, you must demonstrate an ability to recognize when your personality interferes with the functions of your role, and how you can solve for that.
In this example, you first explain how your blunt nature allows you to be successful in certain situations. Then, you mention that you understand your bluntness can be seen as a lack of empathy and provide examples of how you’ve attempted to solve this issue. Ultimately, your awareness of how you might be perceived by others shows a level of emotional intelligence, which is a critical asset for a team leader.
6. Fear of Public Speaking
Sample Answer:
“Public speaking makes me nervous. While I don’t need to do much public speaking in my role as a web designer, I still feel that it’s an important skill — especially when I want to offer my opinion during a meeting. To combat this, I spoke with my manager and she recommended I speak at each team meeting for a few minutes about our project timeline, deadlines, and goals when developing a website for a client. This practice has enabled me to relax and see public speaking as an opportunity to help my team members do their jobs effectively.”
In this example, you mention a skill that isn’t applicable to the role, but one which you nonetheless have been working to improve. This shows your desire to meet more business needs than necessary in your current role, which is admirable. Additionally, it’s impressive if you can show you’re willing to reach out to your manager with areas in which you want to improve, instead of waiting for your manager to suggest those areas of improvement to you. It demonstrates a level of ambition and professional maturity.
7. Weak Data Analysis Skills
Sample Answer:
“I’m not great at analyzing data or numbers. However, I recognize this flaw can prevent me from understanding how my content is performing online. In my last role, I set up monthly meetings with the SEO manager to discuss analytics and how our posts were performing. Additionally, I received my Google Analytics certificate, and I make it a point to analyze data related to our blog regularly. I’ve become much more comfortable analyzing data through these efforts.”
In this example, you’re able to show your desire to go above and beyond a job description and actively seek out skills that could be helpful to the success of your company as a whole. This type of company-first mentality shows the interviewer you’re dedicated to making yourself a valuable asset, and try your best to understand the needs of the whole department, rather than just your role.
8. Indecisiveness
Sample Answer:
“Sometimes I struggle with ambiguity and making decisions when directions aren’t clear. I come from a work environment that always gave clear and direct instructions. I had such a strong team and leadership that I haven’t had much practice making decisions in the heat of the moment. I’m working on this by leaning more into my experience and practicing listening to my gut.”
This answer works because you’re demonstrating that you can both follow a leader and sharpen your leadership skills. It’s alright to not know what to do in the moment. Admitting that you relied on strong leadership shows that you can be a follower when needed, but knowing when to step up is important, too. With this answer, you’re showing that you’ll step up if a situation calls for decisiveness.
9. Harsh Self-Criticism
Sample Answer:
“My inner critic can be debilitating at times. I take pride in producing good work, but I feel like I struggle feeling satisfied with it, which has led to burnout in the past. However, I’ve started to push back against this inner voice by taking care of myself before and after work. I’m also learning to recognize when my inner critic is right and when I need to dismiss it.”
This answer works because your interviewer may relate; we all have harsh inner critics. It’s also effective because 1) It shows that you’re willing to work on your weaknesses outside of work, not just during business hours, and 2) It demonstrates your inner critic may have valid points. Discerning when to dismiss it is key to prevent burnout and increase productivity. Realizing how the inner critic may inhibit good work ethic demonstrates your willingness to grow and be an effective worker.
10. Micromanaging
Sample Answer:
“I used to work in industries where I had to cultivate a solid work ethic in my employees. This style of training has been so ingrained in me that I’ve forgotten to discern who may need that coaching and who does not. I’ve been reading books on effective delegation and team building to work on this shortcoming. One technique that works for me is assuring myself that if I establish clear expectations, then my team will follow. I’ve also learned to trust my team members.”
This answer works best if you’ve been in a leadership position before and are applying to a managerial role. However, you can still apply it to past experiences where you did have to show leadership. This answer shows that while you may be used to running your crew or team a specific way, you’re willing to admit when your method isn’t the most effective. Showing your flexibility demonstrates your ability to grow.
11. Talkative
Sample Answer:
“I enjoy developing a relationship with my coworkers by engaging in conversation, and that’s a great team-building skill. However, I have a habit of carrying on a conversation to a point where it may distract other coworkers. I have learned since then that there are other ways to connect with my coworkers, and that if I’m asking about their day, I need to keep it brief and redirect myself back to my work.”
This answer works because it shows you’re aware of how your talkative tendencies may be distracting in the workplace. It takes a lot of courage to admit that. It also shows you are willing to develop a relationship with coworkers but not at the cost of productivity.
12. Trouble Maintaining a Work-Life Balance
Sample Answer:
“I’ve struggled with work-life balance, especially after I started working remotely during the pandemic. This increased my stress levels to the point where my productivity was at an all-time low and I didn’t bring my best self to work. Because I want to continue working remotely, I’ve started adding more structure to my day and instituted a sharp start and end time. I’ve already seen improvements in my levels of focus during work hours.”
At first, this might seem like a “strength” weakness — pouring yourself into work is great, right? That means you love your job. But if it impacts your productivity and your relationships with coworkers, that is not so great. This answer works because it doesn’t just say, “I work a lot, so my home life suffers.” It says, “I work a lot to the point of burnout, and I’ve realized that I need to structure my day.” If you’ve struggled with work-life balance issues in the past, it’s important to state how you’re restoring that balance and how it has impacted your work.
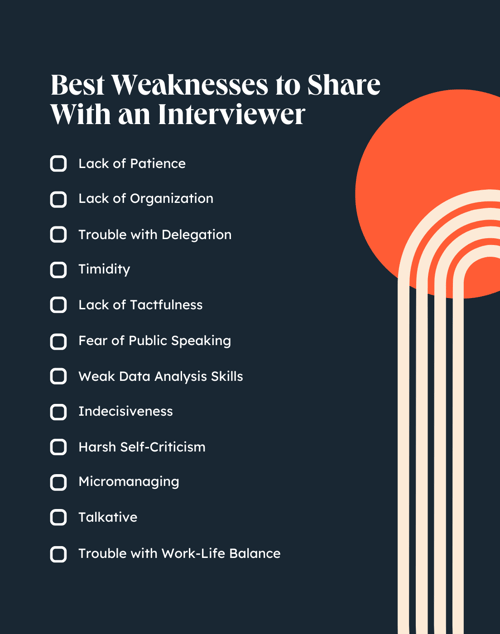
Tips for Talking About Weaknesses in Job Interviews
Now that you know the most effective answers and best practices for choosing a weakness, it’s time for the hard part: Actually delivering the answer to the interviewer. Let’s go over some tips for answering “What is your greatest weakness?” live.
1. Practice your answer beforehand.
Practice does not make perfect, but it certainly makes better. While it’s not guaranteed that an interviewer will ask you about weaknesses, there’s a high possibility that they will. You want to be prepared for that moment by practicing the tone and delivery of your answer with a friend or in the mirror.
There’s nothing worse than stumbling over an interview answer, especially for this question about weaknesses. It’s totally okay to stutter a bit — we all get nervous — but you want your answer to be as coherent and brief as possible. If you ramble, stumble too much, or go back on your words, you’ll seem unprepared or, worse, like you’re lying.
Once you’ve written up your answer, be sure to read it out loud to yourself several times, then retrieve it from memory. Change your wording here and there, and know that it’s okay to improvise so long as the bones of your answer remain the same.
2. Look the interviewer in the eye and project confidence.
Since you’ve hopefully practiced several times, this should come naturally, but we can’t overemphasize it: When answering “What is your weakness?,” try to maintain eye contact with your interviewer during most of the answer, and project confidence while you speak.
“Project confidence while talking about my weakness?” you may ask. Yes! You want to own up to your most urgent opportunities of growth — not seem like you’re cowed or intimidated by your own shortcomings, or like your self-esteem has suffered dramatically. (Hint: It totally may have, and that’s okay, but your interviewer shouldn’t know that tidbit). You can take solace in that you’re not alone. All of us have weaknesses to work on.
You can increase your level of confidence during your answer by identifying how you’ve been working on this weakness. In fact, by focusing the core of your answer on how you’ve already improved in this area, you’ll seem more self-assured and actualized by default.
3. Be brief and to-the-point.
We don’t want to linger too much on weaknesses; try to keep your answer short, between the length of thirty seconds and one minute. Even still, only the first statement should directly state your weakness, and the rest of the answer should be dedicated to the tools and strategies you’re using to overcome it.
Alternatively, you may give a brief anecdote on what you learned from dealing with that weakness in your personal life or at work.
Don’t think you have to over-elaborate, either. State, in as simple terms as possible, the steps you’ve taken to improve. Your interviewer likely has much more pressing questions to ask about your direct experience, and the answer to this question is not as critical in the overall process as we all may think.
4. Understand the interviewer’s goal.
Your interviewer’s goal is not to intimidate you, scare you, or create a “gotcha!” moment. They’re also not looking to disqualify you based on your answer. The “What is your greatest weakness?” question is simply another way for interviewers to get to know your soft personal and professional attributes.
They’re not looking to find out that you “totally suck” at the job you applied for — if you applied, you’re likely qualified. They’re also not looking to find out about your hard professional skills and attributes; other questions are better suited for that. Rather, they want to know if you have enough self-awareness to identify your opportunities for growth. Do you have poise when speaking about your weakness? Do you gracefully accept feedback?
Including anecdotes about previous feedback you’ve received, projecting confidence, and making it clear that you’re taking steps to improve will be enough to fly with high marks during this question.
5. Don’t stress too much over your answer.
Good news: Hiring decisions don’t come down to your answer to “What is your weakness?” Shocking, I know! Sometimes it seems like it, because it can feel like such a loaded question.
Not to worry: You can rest easy. As long as you’re honest and state how you’re trying to improve, this question will likely be low in your interviewer’s notes, unless you lie about your weakness, use a “fake” weakness such as “I’m too organized,” or simply evade the question entirely.
Even if you stutter a little bit, you’ll be okay. So, relax, be certain in your answer, stay self-aware, and simply take it as part of the conversation between you and the interviewer. The other questions regarding your skills and how you can help their company are much, much more critical to their hiring decision.
6. Showcase your personality while keeping it professional.
Is humor your style? How about dry wit? You can introduce some of that during this question, but only lightly, and only after you’ve gauged the company’s culture and examined the interviewer’s personality. If you’re interviewing for a highly corporate job, we recommend keeping humor to a minimum. But no matter what, you can always show your personality in your inflection, tone, and delivery.
Take, for instance:
“You know, I’ve had such a hard time with [X] in the past, but I’m grateful to my previous managers, who gave me useful feedback when I began my career. Now, I’m ‘thriving.’ Every single day, I do [Y] to improve upon that skill. It was such a pain point for me, but I’ve improved tremendously and have been lucky enough to have a strong support system every step of the way.”
Compare that with:
“I won’t lie. I struggle with [X] sometimes. Fortunately, I’ve picked up [Y] to work on it, and like any new learning experience, it’s been eye-opening and humbling. I’ve improved in [Z] areas — not so much that it would be first on my list of skills, but maybe second or third. Either way, I’m happy to report I’m getting there and look forward to improving even more in the future.”
Neither of these is better over the other, but they both show different personality types, and you can do the same.
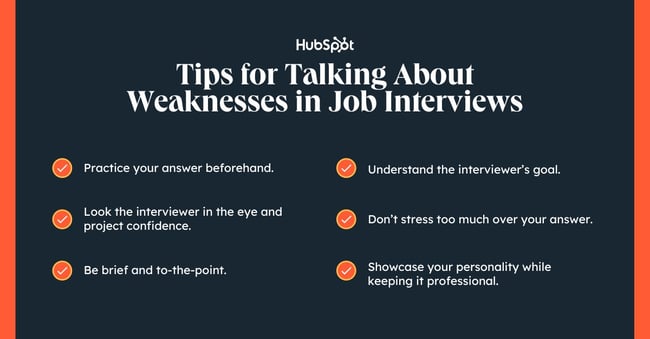
There’s Strength In Every Weakness
Regardless of whether you’re bad with numbers or you tend not to speak up in group settings, there’s a strength behind every weakness. The strength is in how you work to overcome it. Leaning on your teammates who excel in those areas is a great way to show that you’ll work well on the team and that you know how to use your resources to solve problems. Taking professional development courses shows that you’re willing to work toward improvement. No matter which of these answers you share with the hiring team, they’ll be more than happy to help you grow and exceed the expectations of the role.
Editor’s note: This post was originally published in December 2018 and has been updated for comprehensiveness.
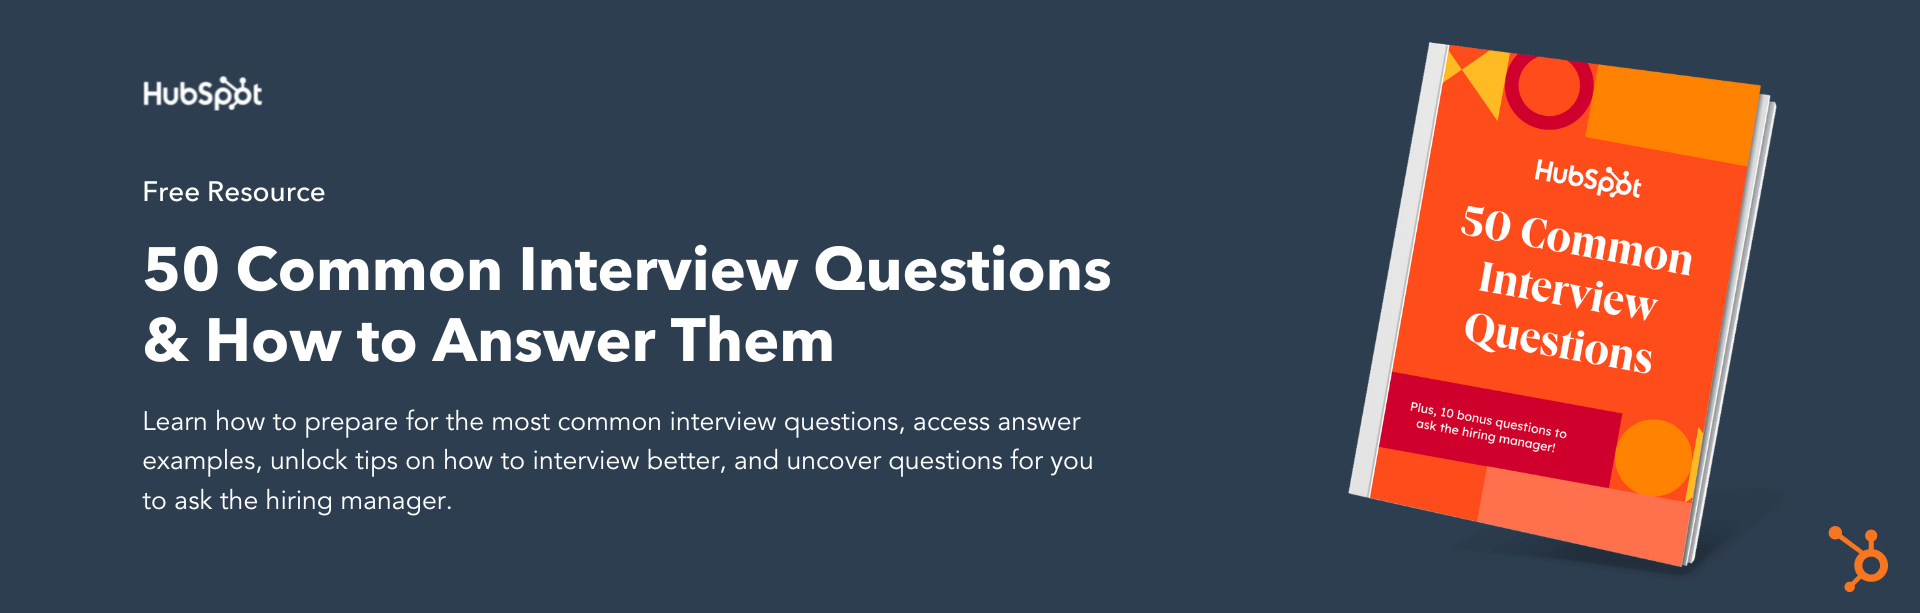
![]()
The Two Psychological Biases MrBeast Uses to Garner Millions of Views, and What Marketers Can Learn From Them
MrBeast is a young YouTuber who has amassed an incredible following through non-traditional means.
If you combine the subscribers of all his channels, they would rank as the 7th most populated country in the world. His videos have been viewed more than 26 billion times.
MrBeast is not just a storyteller — he also translates this attention into revenue. He earned $54 million last year, launched a range of chocolate bars, an apparel brand, and even a fast-food business. He is one of the world’s best marketers, capturing the attention of billions and turning many of them into customers.
Let’s explore the psychology behind MrBeast’s success, and how you can use it as a marketer to help grow your own business.

The Two Psychological Biases MrBeast Uses to Garner Millions of Views
1. He uses input bias to create hyper-engaging videos that amass millions of views.
How did MrBeast, who started his channel at 13-years-old, create a multi-million dollar business empire in less than a decade?
The first psychological bias MrBeast uses is known as the input bias. It means that the more time, effort, and money you sink into something, the more you’ll value it.
Studies show that you’ll enjoy food more when you see the effort that’s gone into creating it. Even when you haven’t made the food yourself, seeing the effort that went into cooking it can actually make you enjoy it more.
Additionally, house buyers who are given a list of properties and told the real estate agent stayed up all night preparing that list will rank the properties as better-suited to their needs than the exact same list created in seconds by a computer.
How MrBeast Leverages Input Bias
MrBeast has used input bias consistently to make people value his videos. One of his first viral videos was him cutting a table in half with a plastic knife. It takes him hours, and the content is undeniably dull — yet it has 3.5 million views. This was one of MrBeast’s first viral videos, and it propelled his fame. He sunk an extraordinary amount of time into creating the video, and people valued it, even though the activity was fairly worthless.
The time and effort it took also meant that no one else had done something like that before, which made the video unique. This video demonstrated MrBeast’s commitment to spending enormous amounts of time and effort into creating his content.
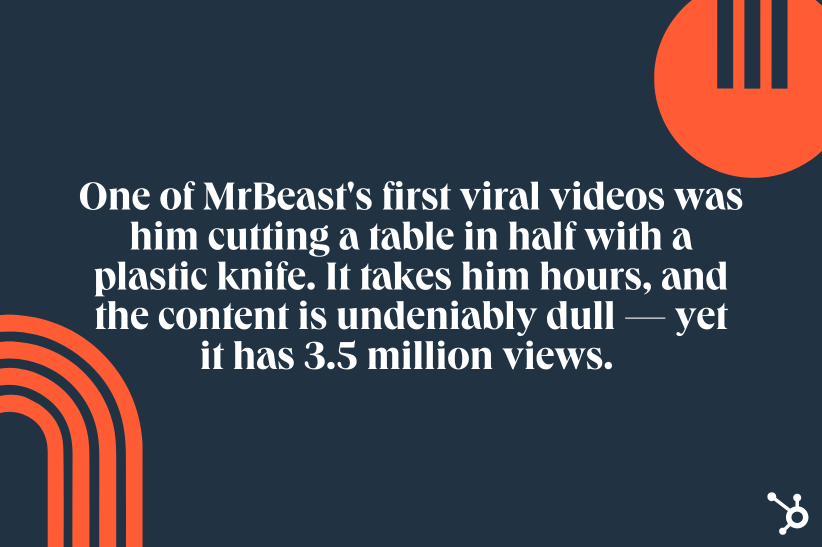
MrBeast quickly saw the success of this video, and created more just like it. Some examples: He read the longest word in the English language, said “Logan Paul” 100,000 times in 17 hours, and counted to 100,000. These videos have millions of views.
Showcasing the effort MrBeast sinks into his videos make people value it more, even if that effort is fairly unexciting. The video is boring, but it’s leveraging our cognitive biases to capture attention. MrBeast is a master of using behavioral science nudges to garner attention.
2. He leverages costly signalling to engage his audience.
Another one of the psychological principles MrBeast uses is costly signalling — which essentially states that the more money or resources someone spends to market their products or services, the more trust someone will have in the brand.
For instance, if you see a new brand on TV that has paid for an advertisement with a costly celebrity like Selena Gomez, you’ll assume the brand is relatively successful — due to the costs of television advertisements, as well as the cost of working with a major celebrity – and have more trust in buying their product.
Additionally, major brands like Patagonia use costly signalling to showcase their values. For instance, Patagonia declined to sell corporate vests to employees of firms that do damage to the environment, including oil companies, mining companies, and finance firms. This decision was a costly signal, and ultimately changed how people perceived the brand, making some value it more.
How MrBeast Leverages Costly Signalling
In the case of MrBeast, he gives away extraordinary amounts of money in almost all his videos, which makes them more engaging and makes him more trustworthy. His video in which he was offered his first brand deal is an excellent example of how he applied the principle of costly signalling.
The advertisers offered him $5,000 to promote their brand during one of his videos, but MrBeast wanted to give away all the money from the brand deal to a homeless person and film their reaction. He thought $5,000 wasn’t enough and pleaded with the advertisers to double their payment to $10,000 so that he could give away the full amount to a homeless person.
The brand agreed, and MrBeast went and gave away $10,000, which made the video even more engaging. This video was a turning point in MrBeast’s career, driving much higher numbers of views and propelling his subscribers to an even greater level.
MrBeast’s success as a content creator and businessman is not just due to luck or chance. He employs various tactics and strategies to grow his brand and engage his audience. In this post, we discussed two psychological tactics he’s used: input bias, and costly signalling.
However, there’s one more tactic that MrBeast uses that I haven’t covered yet. If you want to discover what it is, then you’ll have to listen to Nudge Podcast, where MrBeast reveals his secret weapon for building a successful brand.
So go ahead and give it a listen, you might just learn something new!
![]()
19 Best Free Microsoft Excel Templates for Marketing & Sales
If you’d like to expedite data analysis and reporting, then using a sales or marketing Excel template is an excellent option.
![Download 10 Excel Templates for Marketers [Free Kit]](https://no-cache.hubspot.com/cta/default/53/9ff7a4fe-5293-496c-acca-566bc6e73f42.png)
Whether you’re looking for a sales dashboard or a marketing planner, Microsoft Excel will easily allow you to create one with your company’s data — all you need is the right template.
To help those of you looking for a way to sharpen your Microsoft Excel skills, we’ve put together a detailed list of templates you can start using in Excel to simplify your sales and marketing tasks. These templates will have you making strides in no time. Know what’s even better? You can download a kit of Excel templates in one fell swoop.
Why use sales and marketing Excel templates?
Many of us can recall a time in high school when we were sitting in math class and thinking, “When am I ever going to use this stuff in the real world?” And then we suddenly find ourselves in the real world, only to realize that numbers do play a pivotal role in what we do — especially in digital marketing and sales.
The trouble is, many Excel templates and spreadsheets are riddled with numbers and formulas that aren’t all that inviting. Making them from scratch can be especially intimidating. While we won’t argue with that, we will say that the advantages of leveraging Excel’s functionality to organize information and streamline tasks are unparalleled.
Microsoft Excel has many capabilities, formulas, and shortcuts. It stores data and has tools for data analysis. It performs calculations and allows you to use code for automation. And while many recognize it as a tool for calculating numbers and figures, it’s more than that.
There is a learning curve when using Excel, and it takes time to master its many uses. Outside of calculations, the spreadsheet allows you to create social media schedules, editorial calendars, campaign trackers, and more. And instead of subjecting yourself to trial-and-error processes that would certainly waste time, you can use the following marketing templates to expedite your company’s success in marketing, sales, and project management.
Marketing Excel Templates
Most marketing activities can benefit from consistent tracking and data analysis. Whether you need a source-of-truth for stakeholders to look at, an Excel budget planner, or a way to track the progress on a specific marketing plan or campaign, you can always benefit from using Microsoft Excel.
1. Marketing Planner Excel Template
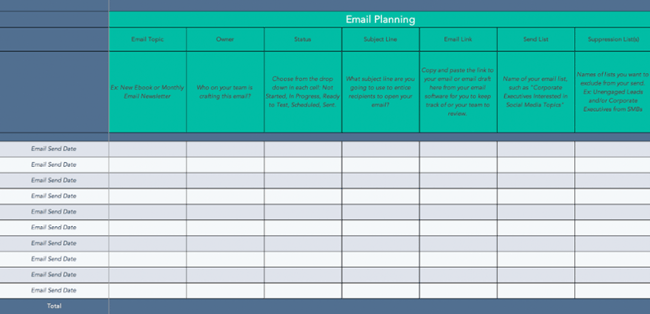
Download Your Free Excel Marketing Planner Template
This marketing planner template for Excel contains everything you need to plan a wide variety of email marketing campaigns and beyond. It contains specific columns for the emails’ topic, owner, status, subject line, and more.
But you can easily use this template to plan any other progressive marketing effort, such as blogging, content writing, or social media marketing. Simply change the titles of the columns to fit your specific marketing plan, and use the column to the left to track the dates of implementation.
That said, HubSpot offers specific Excel templates for each of those tasks, which you can find under “Project Management” later on in this post.
You can supplement this template with a full-on marketing plan, written in Word or Google Docs format. That way, you have a high-level overview of your organization’s marketing team, your goals, your target audience, and your preferred marketing channels.
Featured Resource: Microsoft Word Marketing Plan Template

The above marketing plan template is an excellent complement and precursor to your Excel marketing plan. If you’d like, you can then take the information from the Microsoft Word version and adapt it to the Excel template.
2. Excel Marketing Budget Templates
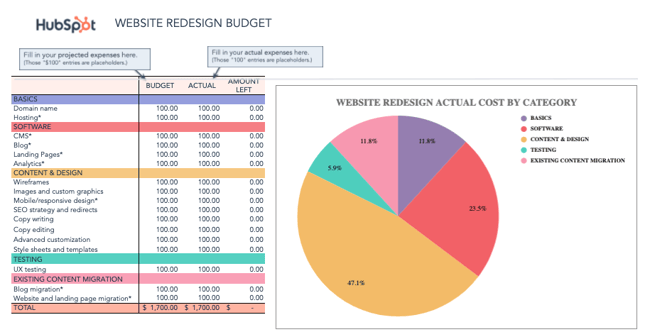
Download Free Marketing Budget Templates for Excel
While marketing budgets vary from business to business, the need for structure and a clear sense of alignment between your goals and your spending is critical across the board. To ensure your preparedness for unanticipated costs, you must allocate your budget thoughtfully and correctly. You will also need to keep tabs on how closely you’re sticking to your projected expenses.
If you want to avoid a mess at the end of the month or quarter, take a look at this collection of marketing budget templates designed to help you better organize your marketing spend. From product marketing and website redesign to content marketing and events, these templates serve as a guide for marketers to visualize and track their expenses to avoid overspending.
The collection also contains a master marketing budget template that will help you generate a high-level visualization of your marketing budget on a month-by-month and quarterly basis.
3. Marketing Dashboard for Excel
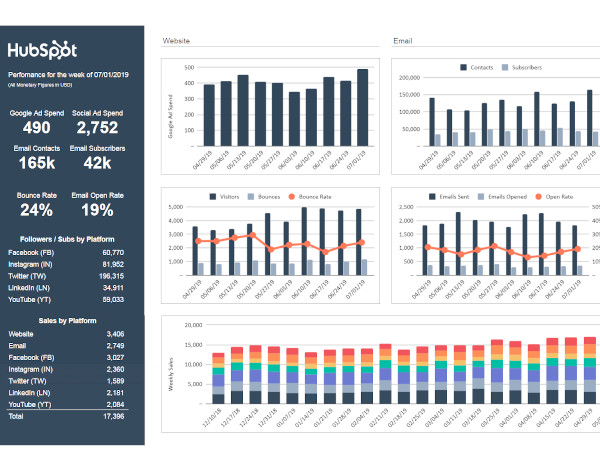
Download Your Free Excel Marketing Dashboard
There is no shortage of data to monitor when it comes to marketing, and if it feels like you’re getting too far in the weeds or missing essential details when it gets too granular, a marketing tracker like the above dashboard can help.
This particular tool allows you to enter metrics by campaign to auto-populate visual and easy-to-read charts. As a result, you can visualize the effectiveness of spending and activity across multiple initiatives.
You can also track the progress of different campaigns and marketing efforts, such as website content and email marketing, as well as ad spend and sales by platform. This makes it easy to understand your marketing ROI and prove the effectiveness of your campaigns to stakeholders and leaders at your company.
4. Excel Monthly Marketing Reporting Template
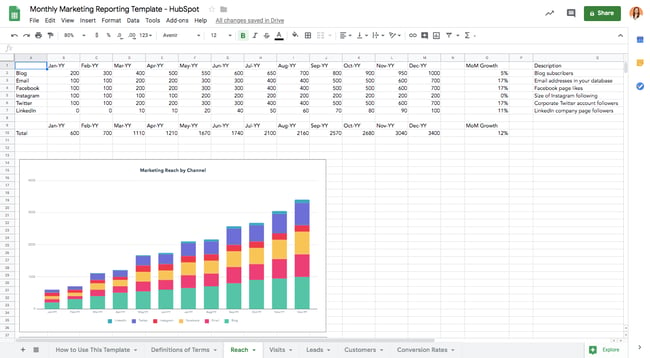
Download Free Excel Marketing Reporting Templates
Is there a feeling sweeter than hitting all of your goals for the month? How about communicating your success to your boss? Excel spreadsheets can prepare comprehensive reports of your marketing metrics to send to your boss. There’s no need to work from scratch. (After all, you’ve already worked so hard this month.)
To simplify your reporting, check out these monthly marketing metrics templates and the corresponding PowerPoint template. Each month, you can update them quickly and easily to reflect your monthly visits, leads, customers, and conversion rates. From there, you’ll have everything you need to track and report on which channels are performing best. Every boss loves to see ROI, so you can’t go wrong with these templates.
5. SMART Goal Excel Marketing Template
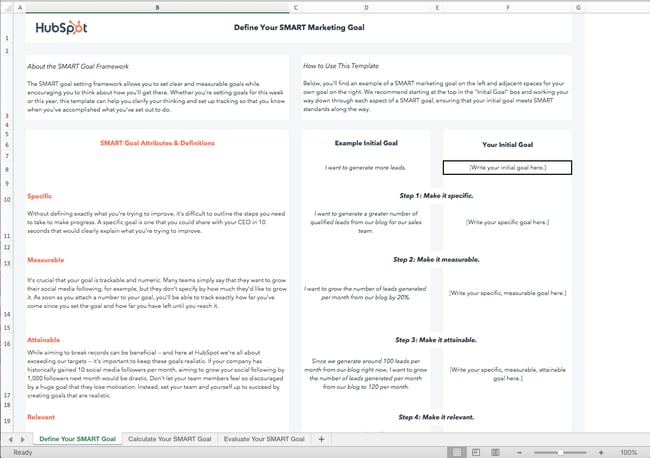
Download Your Free Excel SMART Goal Template
Whether you’re planning for a new year, quarter, or month, defining a clear set of goals is critical for driving the direction of your marketing efforts and priorities.
Sometimes, you might need help not only setting marketing objectives but achieving them. Start with these SMART goal planning templates. Rooted in specificity, measurability, attainability, relevancy, and timeliness, these templates will help you set your team up for success. They will also provide you with a tool for identifying your most prominent marketing needs.
You’ll first be able to define your SMART goal, then calculate your goal metrics, and then evaluate its success. Its user-friendly and readable format makes it one of the most shareable options on this list. You can easily send it over to your stakeholders without worrying about formatting. Simply fill it out, and it’s ready to share.
6. Excel On-Page SEO Template
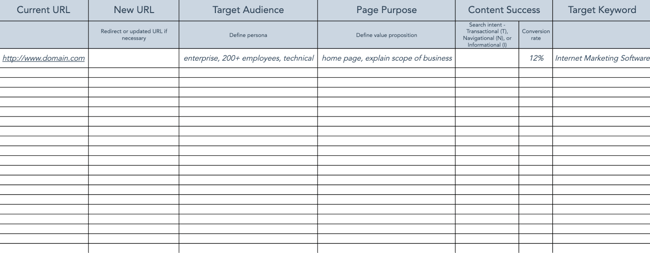
Download Your Free Excel SEO Marketing Template
When it comes to SEO, there’s a lot for marketers to remember to see results. In other words, there is a lot for marketers to forget. With search engines evolving and algorithm changes turning your existing strategy on its head, it’s easy to feel overwhelmed and push off revamping your SEO strategy. However, SEO should never be an afterthought.
If you’re looking for the light at the end of the tunnel, pull up this handy SEO template created in Excel. Designed to make the process of managing your SEO efforts a whole lot easier, marketers can use this template to guide their strategy step-by-step or pass it off to their webmaster to serve as a helpful guide. It focuses on keywords and SEO best practices, while providing tips and tricks to identify nuances and increase productivity.
7. Google Ads Campaign Excel Tracker
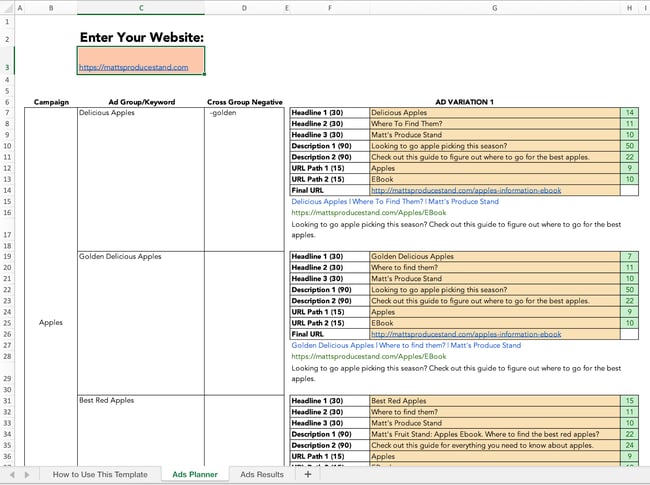
Download Your Free Excel PPC Campaign Tracker
If you’re doing your Google Ads campaigns right, they probably aren’t “walks in the park.” That’s because, to get the most bang for your buck, you set up multiple campaigns with multiple ad groups. You also have variations of your campaigns — all with different content. Not only that, but you’re (hopefully) also keeping track of those campaigns to determine which ones to shut off, add more money to, or tweak.
Sounds like a lot to keep track of, right? But take a deep breath. This Google Ads tracking template is a marketing campaign template that can keep you on top of your Google Ads game. It’ll help you catch mistakes and implement best practices across all the different campaigns and ad groups you’re running — for the top, middle, and bottom of the funnel. It’s a perfect complement to that SEO template you’ve started using.
8. Excel Lead Tracker Template
Download Your Free Excel Marketing Template for Lead Tracking
It’s no secret that sales and marketing have a pretty rocky relationship history. Sales might think marketing isn’t generating enough leads, while marketing might think their sales representatives aren’t capitalizing on the leads they’re sending over. When it comes down to it, finger-pointing doesn’t grow a business.
With this customizable lead tracking template in your toolbox, you’ll have the information you need to reduce tension and define a concrete monthly lead generation goal. You’ll also be able to track and measure the success of specific lead generation channels and keep close tabs on your current sales close rates.
You might also want to supplement this lead tracker with a marketing-sales SLA template, available for Microsoft Word.
Featured Resource: Microsoft Word SLA Template for Marketing & Sales
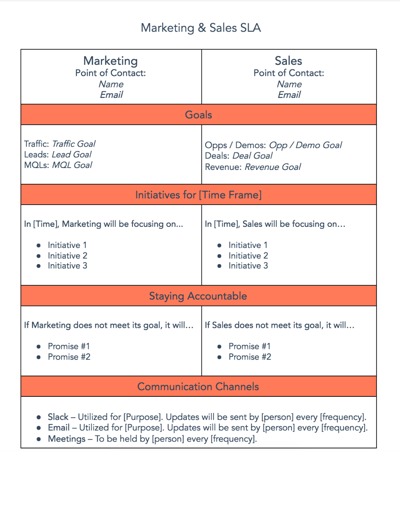
To better align your sales and marketing teams, turn to this template for creating a service-level agreement (SLA). Generally speaking, an SLA is a contract that defines the sales department’s expectations for marketing leads (both quantity and quality), and the expectations marketing has for how sales will act on qualified leads.
9. Excel Sales Conversion and Close Rate Calculator
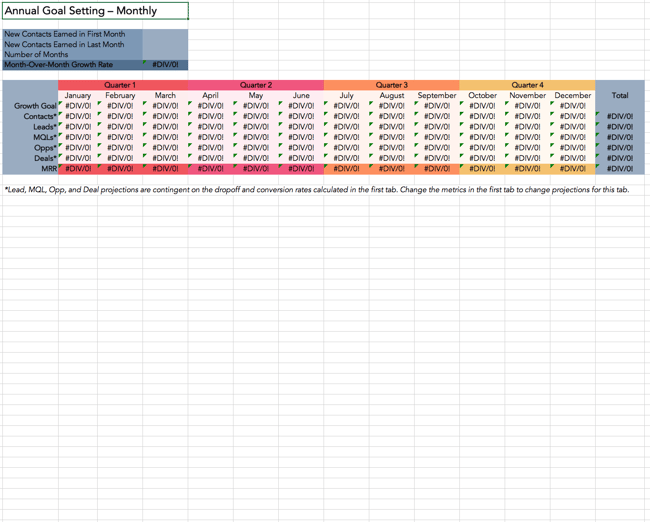
Download Your Free Excel Conversion Calculator
You have to set a conversion goal, but you don’t know where to start. Once you finally figure that out, you have to determine how much traffic you need to hit that goal, but you’re not sure what approach to take there, either.
It sounds like you could use a hand in calculating your leads and traffic goals. Luckily, there’s an Excel template for that. You won’t have to sort through these numbers on your own. This template will take care of the math and give you a clear picture of what you need to accomplish to achieve your conversion goals. It will also help you align more closely with sales to ensure your team is driving more qualified leads over to them.
10. Excel KPI Dashboard Template
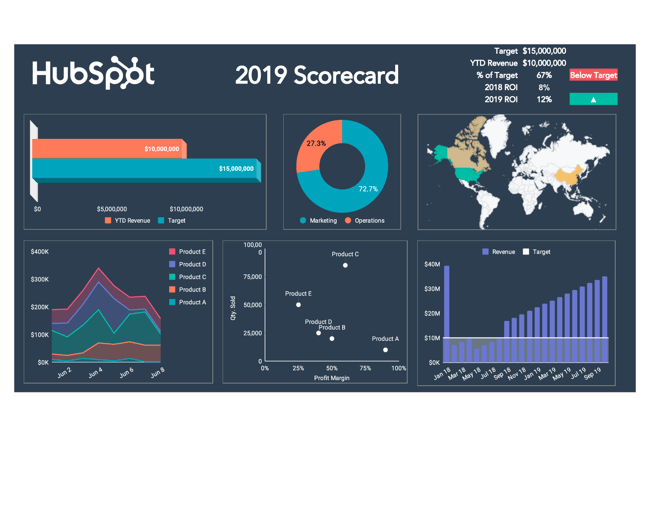
Download Your Free Excel KPI Dashboard
If you’re a fan of the monthly metrics template, you might want to grab a copy of this template as well. The essential KPI tracker, shown above, takes the metrics your marketing team has agreed to track and describes them in more detail.
KPI stands for “key performance indicator.” They’re your most important metrics, each with a unique purpose and place in your marketing strategy. Using this template, you can assign specific employees to each KPI, define the frequency at which you’ll monitor each KPI’s performance, and assign each KPI a color that reflects the quality of that KPI’s performance.
If one of your KPIs is organic traffic, for example, you can set up your template such that 100 page views per month are red (poor performance), 500 page views per month are yellow (stable performance), and 1000 page views per month are green (great performance).
Sales Excel Templates
Sales is a number-heavy field. Whether we’re talking about sales goals, quota, or closed-won ratios, there’s always something to calculate. Use the following templates to expedite the process.
1. Excel Ecommerce Planning Template
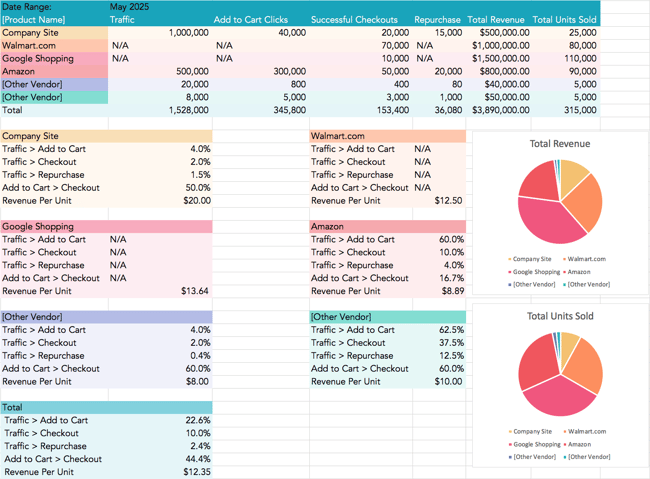
Download Your Free Excel Ecommerce Planner Template
Ecommerce stores come with many moving parts. Planning ahead can save you time and heartache later.
This template, which also includes an ecommerce sales plan and go-to-market template, includes dedicated space for each of your ecommerce vendors. The kit also includes a marketing plan that guides you through market research, target market, channels and vendors, and more. Once your ecommerce store is live and running, you can use the conversion template to track performance across vendors and platforms where products are listed to give you a holistic view of your efforts.
2. Excel Contact List Template
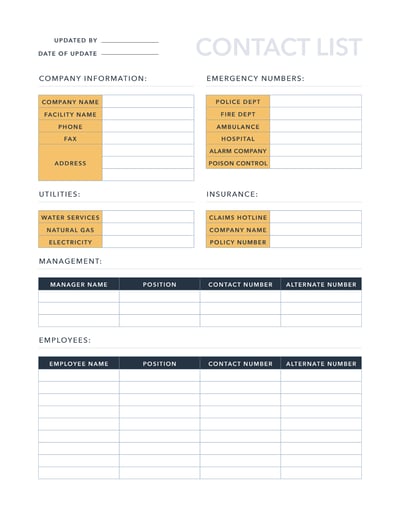
Download Your Free Excel Contact List Template
In a business, the most important people are your customer or client base. Although your current customers constantly need to be nurtured, focusing on your contact or prospect list is also essential.
A contact is a person, business, or organization that might be interested in your products or services. It could be someone who has shown interest or someone who could benefit from your company. A contact list allows you to focus on the potential customers that you should nurture similarly to your current customers.
The information needed to build a prospect list is elementary. Start building this list with the person’s name, title and company, location, and contact information. Additional information could include their industry, employee size, company description, and pain points.
Once you’ve used a template like this one, you’re ready to upgrade to a CRM, which stores the same information in a more user-friendly format.
3. Excel Sales Forecasting Template
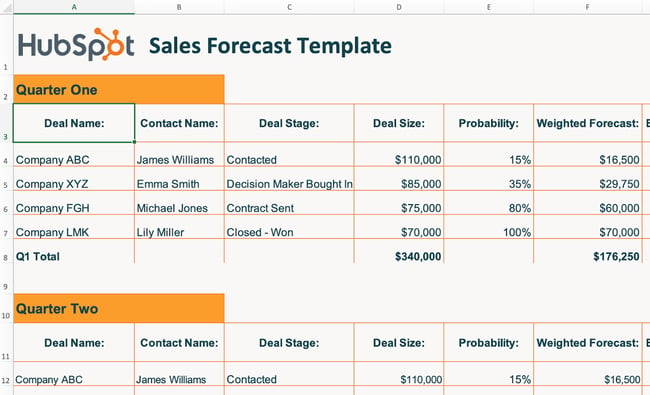
Download Your Free Excel Template for Sales Forecasting
Sales forecasting is similar to weather forecasting. Without the proper tools, it’s impossible to get an accurate idea of what’s ahead. While a meteorologist might use Doppler radars and satellite data for their predictions, your business can use the above sales forecasting template.
Excel sales forecasting helps with business planning, budgeting, and risk management. Overall, it helps strengthen the strategy that you build for your company. Using this template will help you track business sales, accurately predict your sales revenue, and plan for future growth.
Sales forecasting is challenging, but this spreadsheet formula makes the process easier.
3. Excel Sales Metrics Calculator Template
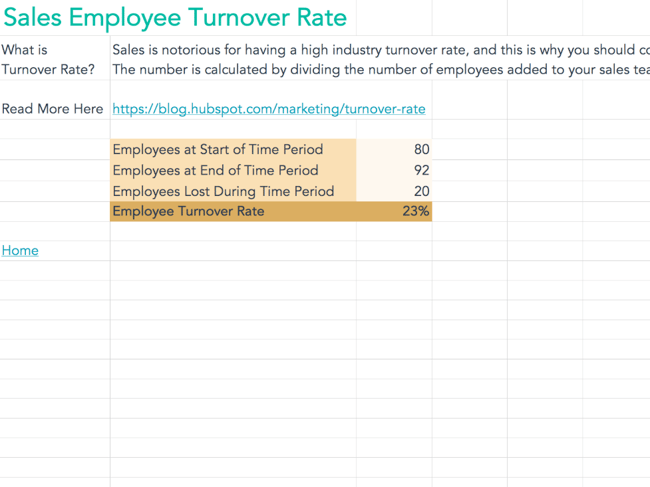
Download Your Free Excel Sales Metrics Calculator
Sales are complex. Once you add sales metrics into the picture, the complications increase. There are many numbers and figures to calculate, track, record, and document. This interactive Excel spreadsheet will help you get the job done.
Not only does this template help you keep track of sales, but it keeps track of your salespeople as well. With the sales metrics calculator template, you can calculate customer retention rate, win rates, product revenue, employee turnover rate, and more.
Project Management Excel Templates
Specific projects require a specific setup, but sometimes, the setup itself can be the most exhausting part. Use the following templates to both manage general projects and track your progress for specific tasks, such as social media planning.
1. Excel Social Media Planning Template
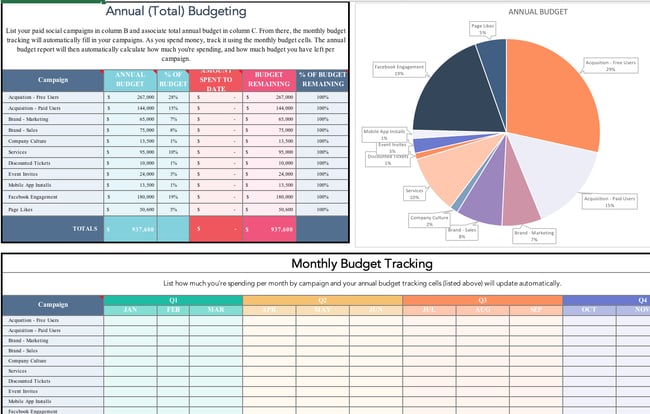
Download Your Free Excel Social Media Planner
You might already use a social media scheduler to manage and publish your posts every week, but you still need a place to draft your social copy and decide which posts will go to which social networks.
And because most social media schedulers allow you to upload social post copy in bulk from a spreadsheet, it’s best if you have an Excel template designed for this purpose. With that in mind, we created the Excel template shown above.
This social media posting schedule allows you to draft each social post — the time it will post, the message you want to publish, and any link you want to accompany your message (blog post, registration page, an ebook landing page, etc).
Once you’ve drafted all of your social posts for the week, month, or quarter, you can sort them by social network and upload your Excel file into your social media platform of choice.
2. Excel Blog Editorial Calendar Template
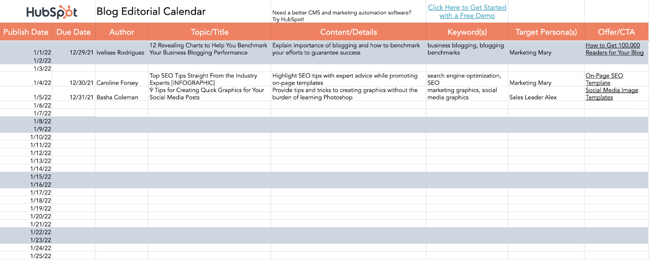
Download Your Free Excel Editorial Calendar Template
Blogging plays a significant role in your ability to attract visitors and leads to your website. But managing a blog is one of those responsibilities that’s easier said than done.
Whether you’re struggling with ideation, consistency, or simply just lacking organization, an editorial calendar can often serve as the solution you need to refocus your blogging efforts and generate even more traffic and leads from your content. Visualizing the blog posts you plan to publish in a given week or month makes it easier to define overarching themes, keep track of ideas, manage contributions, and prioritize strategic distribution.
Use this editorial calendar template as the starting point for keeping track of all of your business’ content. It’ll help you be more mindful of topic selection, buyer personas, keyword inclusions, and CTA alignment.
3. Excel Work Log Template
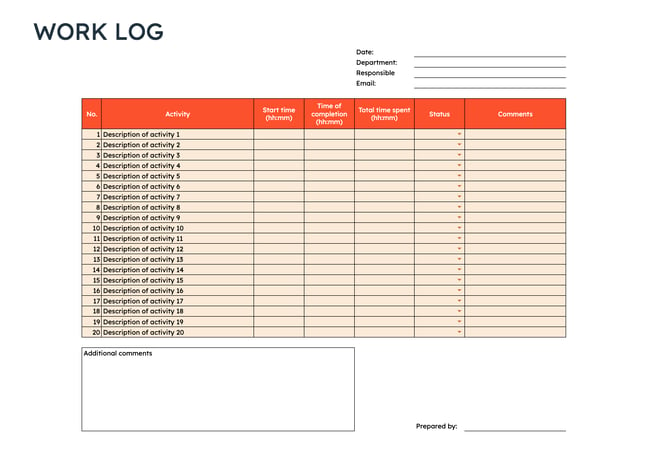
Download Your Free Excel Work Log Template
How do you keep track of the day-to-day progress of your company, especially when there are people, tasks, and timelines to monitor? A work log template is essential to keeping track. If you’re not ready to commit to a project management software, you can still manage your projects and processes with a spreadsheet.
This template provides you with a project overview that makes tracking easier than ever. The work log template tracks tasks, time, status, and comments. With this template, you get all the data you need to monitor the life cycle and progress of your projects.
4. Excel Social Media Content Calendar Template
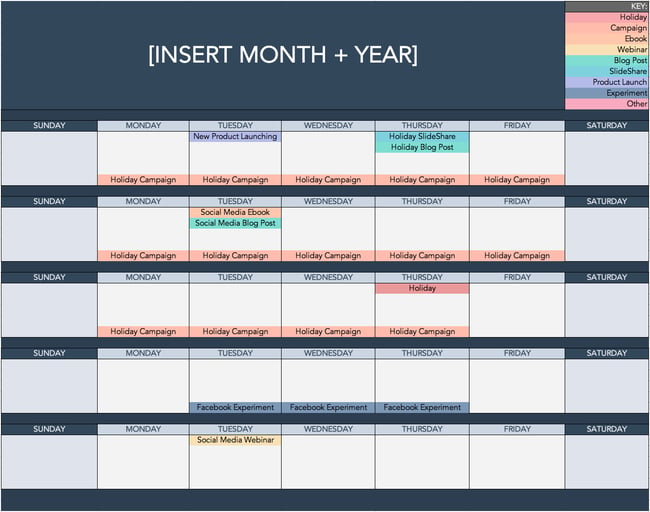
Download Your Free Excel Social Media Calendar
Since you’re probably generating tons of clicks from your Google Ads campaigns and writing amazing content thanks to your blogging editorial calendar, you’ll need some help figuring out how to spread the love on social media. We’ve got just the thing.
The social media calendar template is the perfect resource for helping you scale and streamline your social media marketing. When you use Excel to break out separate worksheets for each social network you’re using, you’ll be able to keep a repository of content ideas, so you’re never struck by writer’s block and always have something to post.
It’s also worth mentioning that marketing calendar Excel templates come in handy when using Twitter, as it can count your characters to help you write tweets that stay within the 280-character limit.
5. Excel Product Launch Plan Template
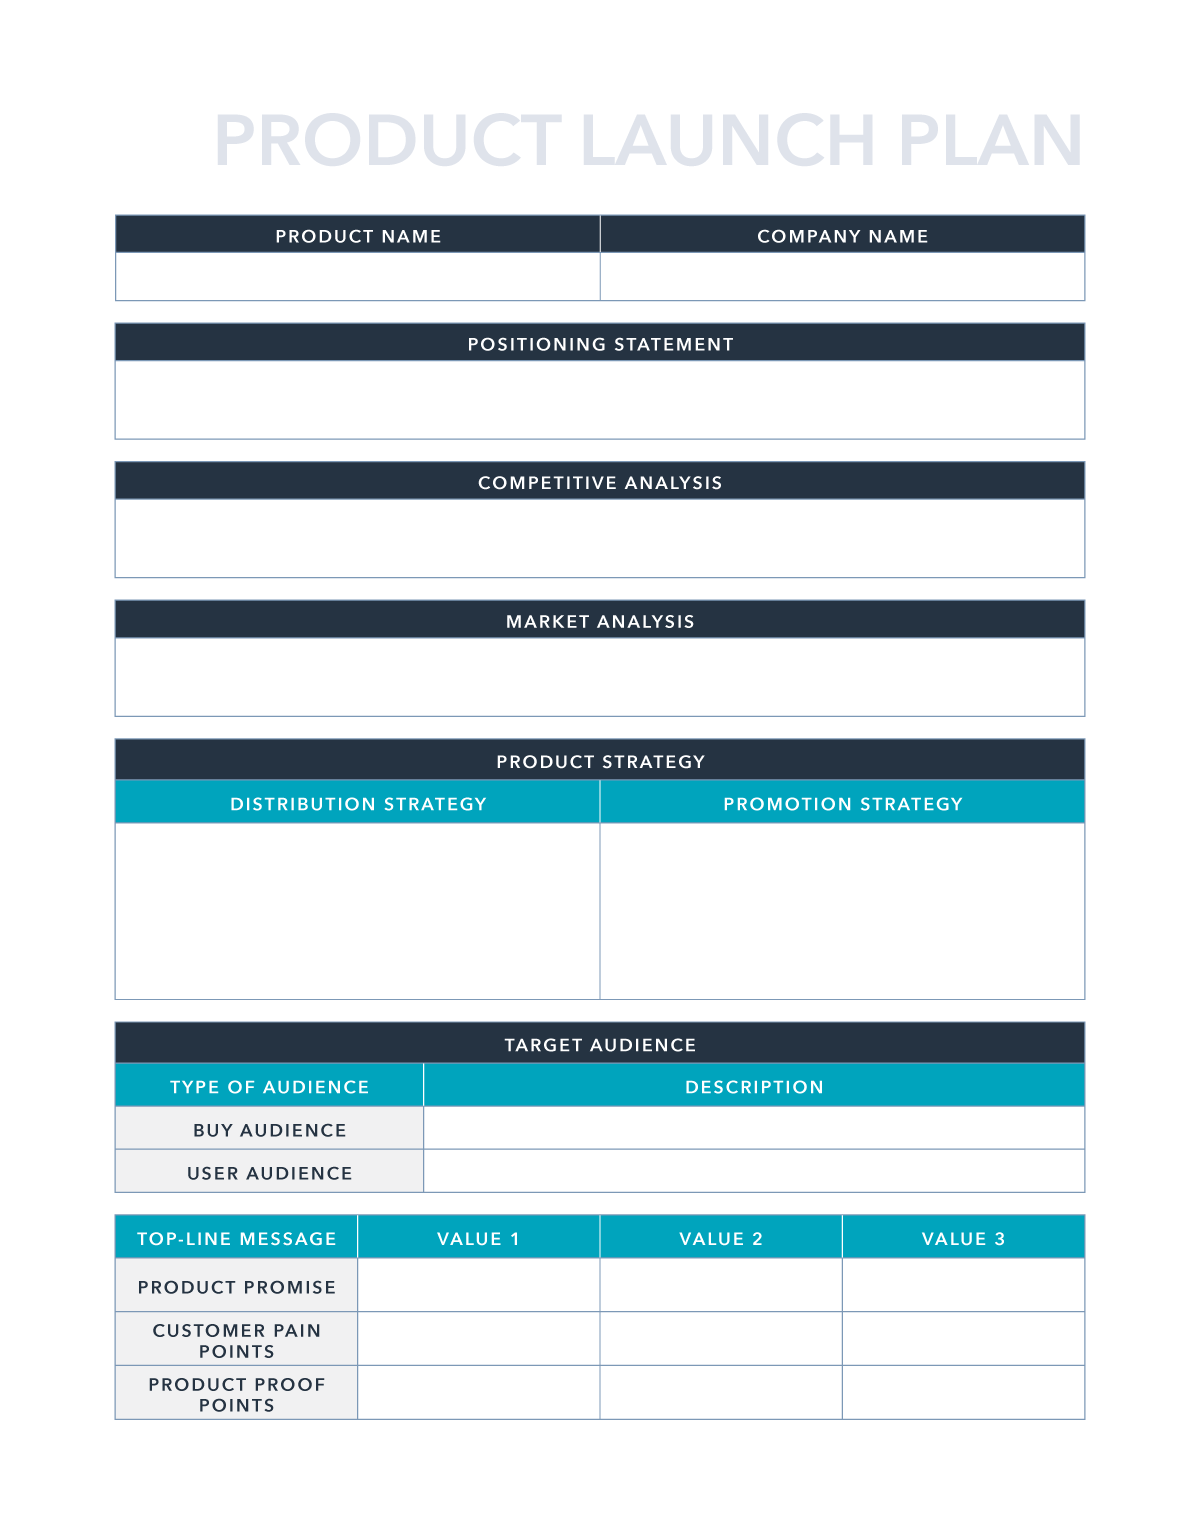
Download Your Free Excel Product Launch Plan Template
A well-executed product launch can be a key differentiator for successful marketing and early adoption. The right plan can give you clarity and purpose as you move forward and announce the new product’s existence to your customers and prospects.
This product launch plan can help you organize your thoughts around competitive analysis, positioning, and product strategy. It even goes so far as to help you brainstorm pains, proof points, and key messaging for campaigns.
Excel your marketing process.
Data is any marketer’s friend. Even though spreadsheets seem like they’ve been around forever, Microsoft Excel has so many capabilities that still make it an amazing resource for displaying, organizing, analyzing, and parsing data. With a little bit of Excel magic, you can streamline your workflow and arrive at some a-ha moments from data insights.
Editor’s note: This post was originally published in March 2019 and has been updated for comprehensiveness.

![]()