
Would You Pay for an Ad-Free Facebook Subscription? 64% of Consumers Say “No”
When Bloomberg reported that Facebook was conducting market research to gauge interest in an ad-free, paid subscription model — we decided to do a bit of our own research.
Facebook — to most consumers, at least — has long-served as a free product. Advertisers, content creators, and publishers have enlisted the platform’s various services for a fee, accounting for roughly 98% of its annual revenue in 2017.
But for those of us who use the network to consume content — whether it’s from friends and family, or publishers — it’s essentially been a monetarily “free” product. That is, until revelations of personal user data being improperly obtained and used by analytics firm Cambridge Analytica came to the surface in March.
The company has faced a high degree of scrutiny and fallout since then — even more than it experienced after it was revealed that the network was weaponized to spread divisive and false information by foreign actors seeking to influence the 2016 U.S. presidential election.
So maybe the network wasn’t really “free,” after all. Maybe, to certain parties and Facebook itself, what we shared and engaged with on the site had a dollar amount attached to it. That’s been the case for a while in the vein of the company’s ad revenue: marketers and advertisers can target promoted content to users based on the data Facebook has about them — criteria like age, location, gender, interests — without attaching personally identifiable information to it.
But is it worth paying to opt out of those ads?
Measuring Public Interest in an Ad-Free Facebook Subscription
How Many Would Pay?
According to Bloomberg‘s report, any plans for an ad-free subscription model at Facebook are currently speculative — and may not come to fruition at all. And, writes reporter Sarah Frier, these plans are not new, though the recent fallout over data and how it’s used to shape ads has re-ignited the internal conversation.
We surveyed a panel of 893 consumers — almost evenly divided among the U.S., UK, and Canada — to find out how many people would pay for a subscription to an ad-free version of Facebook.
The response indicated a fairly widespread disinterest in such a subscription, with an average 64% of participants saying that they would not pay for one.
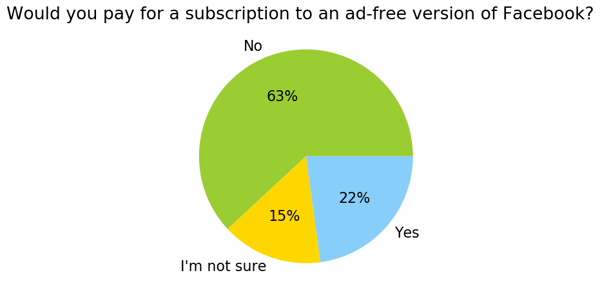
U.S. results — 304 responses
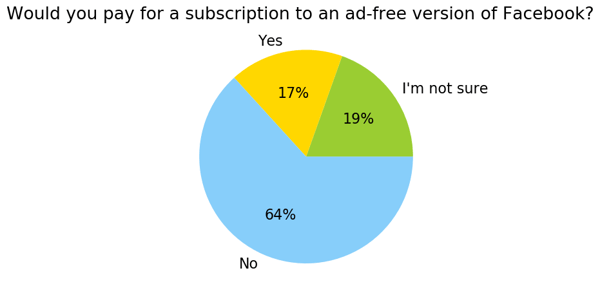
UK results — 302 responses
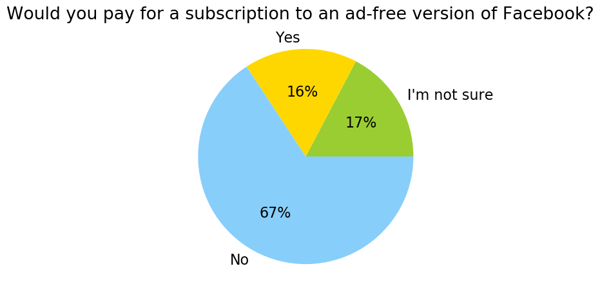
Canada results — 287 responses
What is interesting to note is that, within the U.S., 22% of consumers would be willing to pay for an ad-free Facebook subscription, versus just 17% and 16% in the UK and Canada, respectively.
That could be due to a lack of strict, formalized data privacy laws in the U.S., which could cause a greater perceived value of paid protections. The UK will be subject to the General Data Privacy Regulation (GDPR) when it comes into force on May 25th, and Canada
But here’s a crucial discrepancy: Even if users paid for an ad-free subscription service, it’s not clear if the data used to personalize ads would still be collected and stored.
At F8 — Facebook’s annual developer conference, CEO Mark Zuckerberg did announce a “Clear History” feature to be rolled out in the next several months that would allow users to see which websites and apps send Facebook information on when they’re used, and delete that information from their accounts.
And while the announcement indicated that users will also be able to turn off Facebook’s access to and storage of that information in their accounts moving forward, it’s not clear the nature of what data will be accessed and stored.
It’s also important to note that even if users delete their Facebook accounts entirely, your online behavior can still be tracked via the Facebook Audience Network, which equips advertisers on the network with various tools and pieces of code to “extend their campaigns beyond Facebook.”
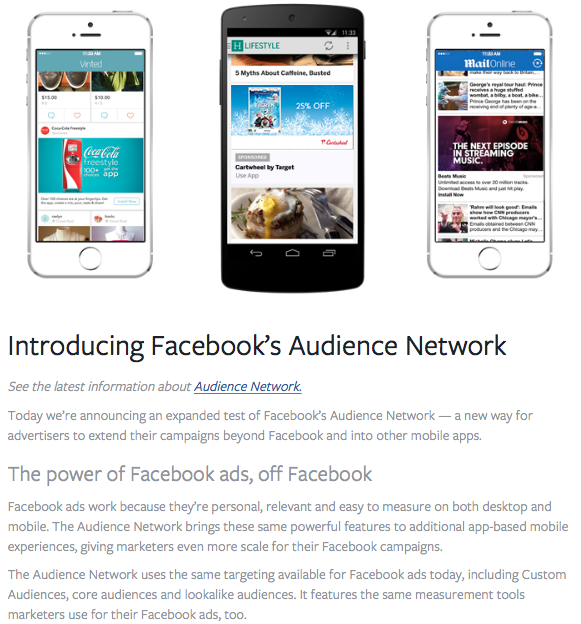
Source: Facebook
It was something that Representative Joe Kennedy asked during Zuckerberg’s testimony before the U.S. House of Representatives last month — in what The Atlantic called “the most important exchange” of the hearing — when he called the Facebook CEO repeated claims of users having complete control over their data into question.
“One of the challenges with trust here is that there is an awful lot of information that’s generated that people don’t think that they’re generating and that advertisers are being able to target because Facebook collects it,” Kennedy said. “I don’t understand how users then own that data.”
It’s unclear, therefore, if a paid, ad-free subscription would resolve that.
How Much Would They Pay?
For those who are willing to pay, however, what cost are they willing to assign to an ad-free experience?
We posed that question to 907 consumers — again, almost equally divided among the U.S., UK, and Canada — and found that, once again, most people (an average of 71%) would not be willing to pay for an ad-free Facebook subscription.
But out of those, most — an average of 15% — would be willing to pay up to $10 a month (or £10 in the UK) for such a service.
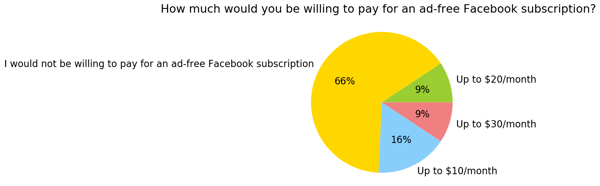
U.S. results — 299 responses
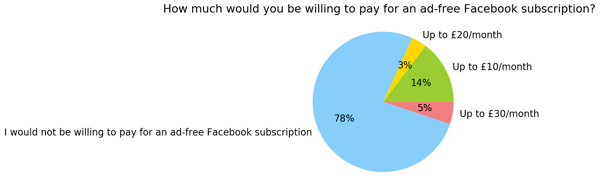
UK results — 312 responses
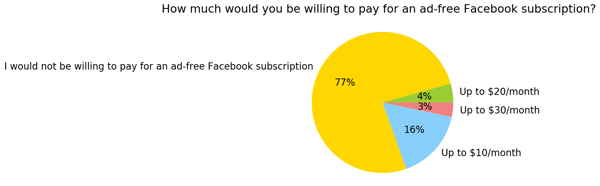
Canada results — 296 responses
That aligns with the ad-free subscription models with many other players within the tech realm. Music streaming service Spotify offers an ad-free premium membership for $9.99 per month, while Pandora, one of its chief competitors, offers ad-free plans ranging between $4.99 and $9.99 per month.
Hulu, a TV-streaming service, offers a limited commercial plan for $7.99 per month, and a commercial-free subscription for $11.99 per month. And Netflix, another TV- and movie-streaming service, offers subscriptions for up to $13.99 per month.
Where We Go From Here
Even if Facebook does introduce a paid subscription model, its executives have repeatedly emphasized that there will always be a free version of it. COO Sheryl Sandberg previously told Bloomberg as much, and Zuckerberg did the same in his Congressional testimony.
ZUCKERBERG: “There will always be A VERSION of Facebook that will be free.”
— Amanda Zantal-Wiener (@Amanda_ZW)
April 10, 2018
“I wouldn’t be surprised if some users would be interested in this experience — it’s the same experience we have with Netflix, Spotify, Amazon, and other modern tech companies that offer ad-free options,” says Henry Franco, HubSpot’s social campaign strategy associate. “The question is how much of a value people put on their data. Would the average person be willing to pay $10 per month if it meant advertisers couldn’t use their data?”
If so, at that price point, Facebook could stand to earn a fair amount. With an estimated 214 million users in the U.S., for example, if 16% of them (34.24 million) are willing to pay $10 per month for an ad-free subscription, it adds up to $342.4 million in revenue each month, or $1.0272 billion per quarter.
However, that number still somewhat pales in comparison to the $11.795 billion in ad revenue that Facebook reported in its Q1 2018 earnings call.
And even with all these factors, the question of how user data would be leveraged, if at all, still lingers in Franco’s mind.
“Would Facebook still collect data on these users even if they didn’t use it for advertising?” he asks. “Your data might be worth $100 each year to Facebook, but you have to wonder if the average user would be willing to pay $100/year for Facebook not to get it.”

Variable Cost Explained in 200 Words (& How to Calculate It)
There’s a frustrating truth every business deals with early into its growth. To reveal that truth, I’ll start with a song title by hip-hop legend, The Notorious B.I.G.:
“Mo money, mo problems.”
The Notorious B.I.G. is literally saying “more money, more problems.” And although this hit song doesn’t dive into the intricacies of accounting, it does support a frustrating truth about business: the more revenue you generate from sales, the more you’ll have to spend to keep selling.
Let’s unpack why that’s the case with one of the most important and useful financial figures to a growing business today: variable cost.

Variable Cost Formula
Variable costs are the sum of all labor and materials required to produce a unit of your product. Your total variable cost is equal to the variable cost per unit, multiplied by the number of units produced. Your average variable cost is equal to your total variable cost, divided by the number of units produced.
Variable costs vary because they can increase and decrease as you make more or less of your product. The more units you sell, the more money you’ll make, but some of this money will need to pay for the production of more units. So, you’ll need to produce more units to actually turn a profit.
And because each unit requires a certain amount of resources, a higher number of units will raise the variable costs needed to produce them.
A kitchenware maker might sell 10 knife sets for a total of $300, for example, but maybe $100 of this revenue goes into crafting the next 10 knife sets. If the business sells 20 knife sets for $600, it pays $200 of this revenue to make the next 20. The kitchenware maker’s net revenue only increased by $100, while its variable costs rose by $300.
Hence the words of rapping sensation The Notorious B.I.G., “mo money, mo problems.”
Variable costs aren’t a “problem,” though — they’re more of a necessary evil. They play a role in several bookkeeping tasks, and both your total variable cost and average variable cost are separate calculations. With that in mind, here’s what you need to know about variable cost in fewer than 200 words:
Variable Cost Defined in 200 Words
Variable cost denotes the money your business specifically spends on the development of goods and services. Businesses can use variable costs to calculate more complex financial values, such as their contribution margin and break even point.
You can represent your variable cost two different ways: by total variable cost or by average variable cost.
Total Variable Cost
Your total variable cost is the sum of the variable cost of each individual product you’ve developed. Calculate total variable cost by multiplying the cost to make one unit of your product by the number of products you’ve developed.
For example, if it costs $60 to make one unit of your product, and you’ve made 20 units, your total variable cost is $60 x 20, or $1,200.
Average Variable Cost
Your average variable cost uses your total variable cost to determine how much, on average, it costs to produce one unit of your product. You can calculate it with the formula below (for reference, the equation to the top left of the box is your total variable cost).
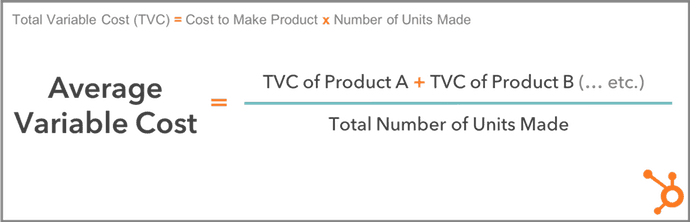
Total Variable Cost vs. Average Variable Cost
If the average variable cost of one unit is found using your total variable cost, don’t you already know how much one unit of your product costs to develop? Can’t you work backwards, and simply divide your total variable cost by the number of units you have? Not necessarily.
While total variable cost shows you how much you’re paying to develop every unit of your product, you might also have to account for products that have different variable costs per unit. That’s where average variable cost comes in.
For example, if you have 10 units of Product A at a variable cost of $60/unit, and 15 units of Product B at a variable cost of $30/unit, you have two different variable costs — $60 and $30. Your average variable cost crunches these two variable costs down to one manageable figure.
In the above example, you can find your average variable cost by adding the total variable cost of Product A ($60 x 10 units, or $600) and the total variable cost of Product B ($30 x 15 units, or $450), then dividing this sum by the total number of units produced (10 + 15, or 25).
Your average variable cost is ($600 + $450) ÷ 25, or $42 per unit.
Variable Cost Examples
So, what’s considered a variable cost to the business?
Depending on the goods or services you develop, you can classify many of your expenses as variable costs. In general, any recurring cost that doesn’t fluctuate as the business grows or shrinks is a fixed cost. A classic fixed cost is rent on office space: no matter what happens within the business, you still pay the same building rent. So, any cost that doesn’t fall into this category is likely a variable cost.
To make it easier for you to identify which of your costs you should factor into your total variable cost calculation, we’ve put together a brief list of variable cost examples below.
- Physical materials: this can include parts, cloth, and even food ingredients required to make your final product.
- Production equipment: if you automate certain parts of your product’s development, you might need to invest in more automation equipment or software as your product line gets bigger.
- Sales commissions: the more products your company sells, the more you might pay in commission to your salespeople as they win you customers.
- Staff wages: The more products you create, the more employees you might need, and the bigger your payroll.
- Credit card fees: businesses that receive credit card payments from their customers will incur higher transaction fees as they deliver more services.
- Packaging and shipping costs: you might pay to package and ship your product by the unit, and therefore more or fewer shipped units will cause these costs to vary.
It can be daunting to calculate expenses that change as your company evolves. Sometimes, you just want to know exactly what you’re paying to run your business. Using the formulas above, however, you’ll be able to easily track your variable costs no matter what stage of life your business might be in.

How to Convert a PDF to Excel: Free Tools & Instructions
A PDF, short for portable document format, is commonly used to view shared documents. The PDF format preserves a document’s formatting, which means you can look at the document on any device. But the key word here is “view” — you can’t edit a PDF without using a specific PDF-editing tool, which is where things get tricky.
If you’ve got a ton of data already formatted in a PDF, you don’t want to waste time manually re-entering that data into an Excel sheet.
Luckily, you don’t need to: there are plenty of free tools you can use to convert a PDF to an Excel file. Since all of the tools function similarly, we’ll show you how to use one of the more popular options, and supply a list of alternatives you can try out.
How to Convert a PDF to Excel
PDFtoExcel.com is a fantastic free tool for a few reasons: it’s secure (your downloads are deleted soon after conversion, and your files are only accessible by software agents); it converts documents of all sizes; the data you import is extracted accurately into rows and columns for Excel; and you can use your .xlsx converted file for various Microsoft Excel versions (7, 10, 13), LibreCalc, OpenCalc, or other office suites compatible with MS Office.
Plus, you don’t need to create an account to use it, which makes the whole process simple and quick (I converted my PDF file to Excel in under three minutes).
Here’s how to use it:
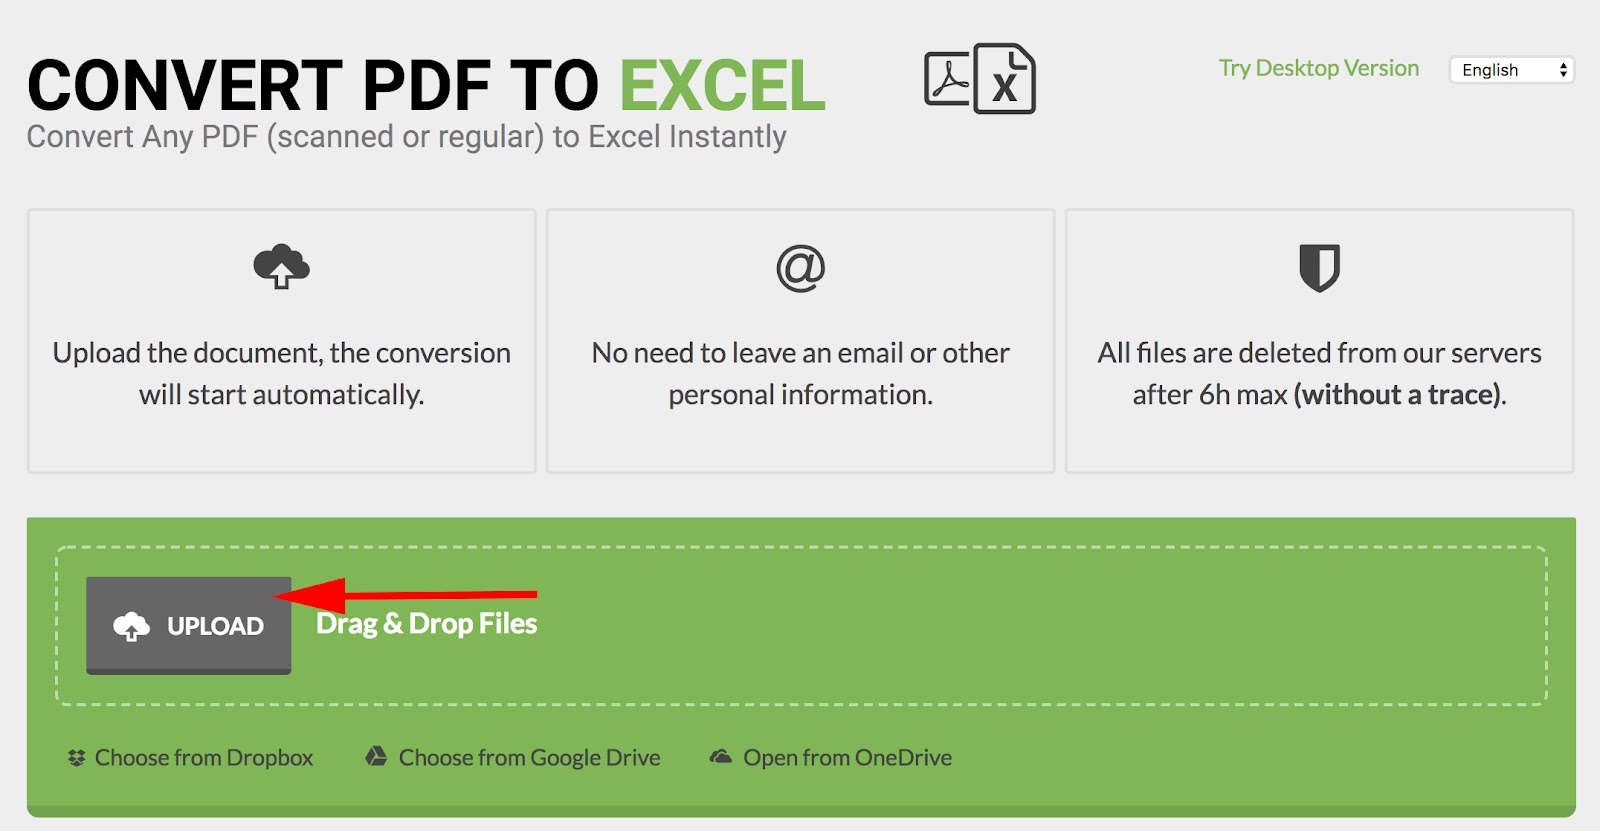
1. Go to PDFtoExcel.com, and click “Upload” (you can also drag and drop, or choose from Dropbox, Google Drive, or OneDrive)
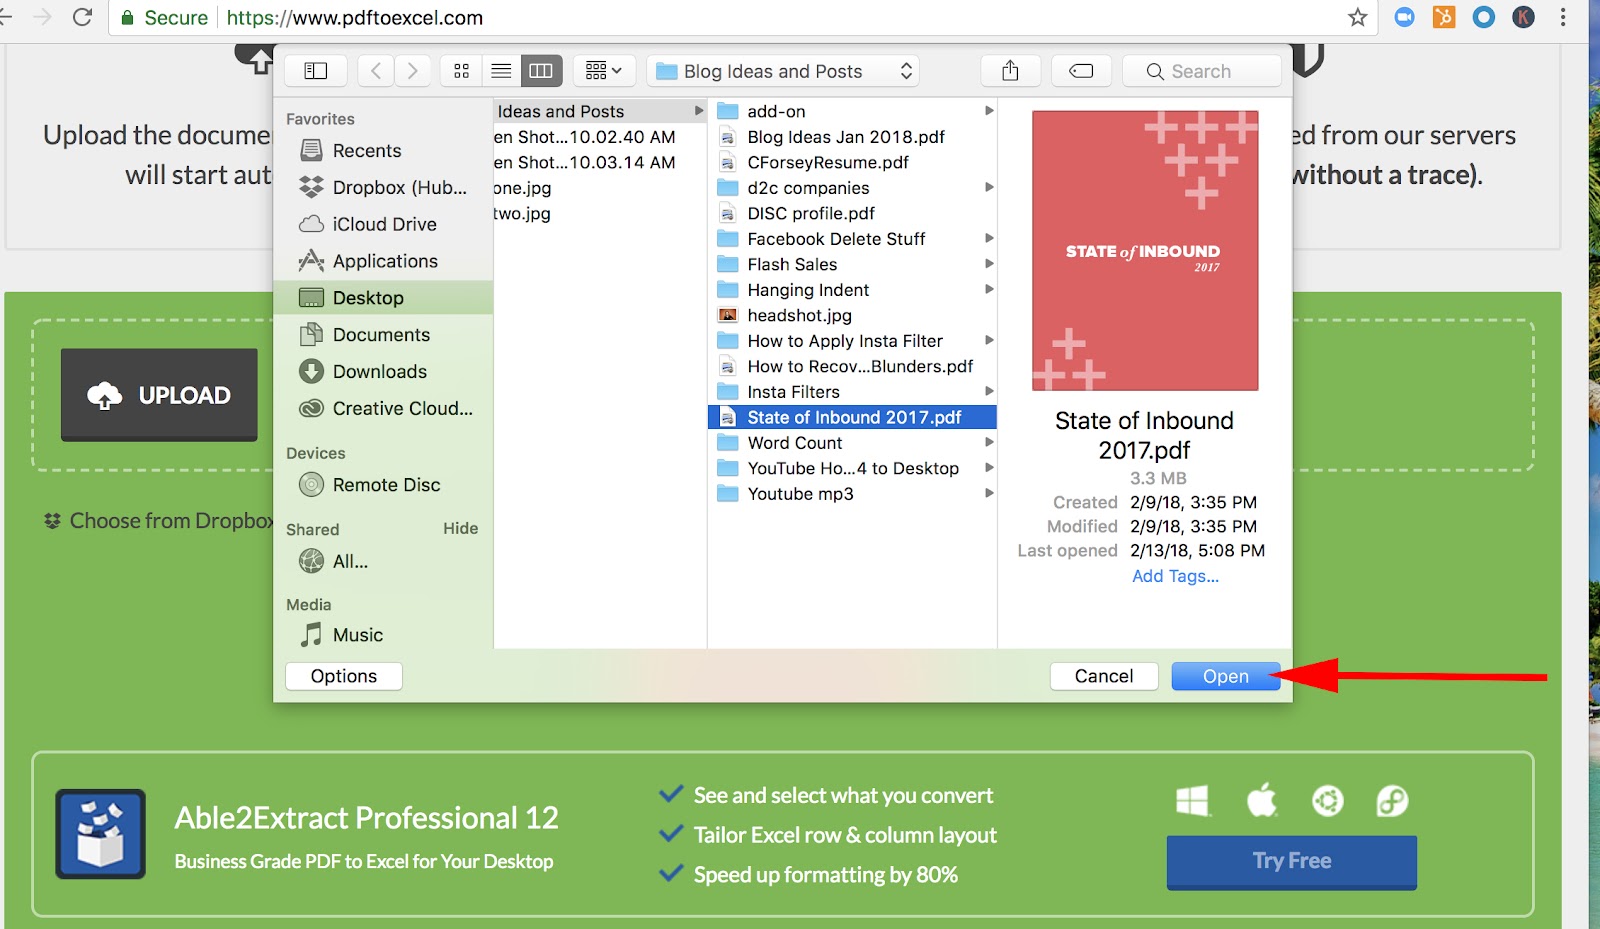
2. Choose the PDF file you want to upload, and click “Open”
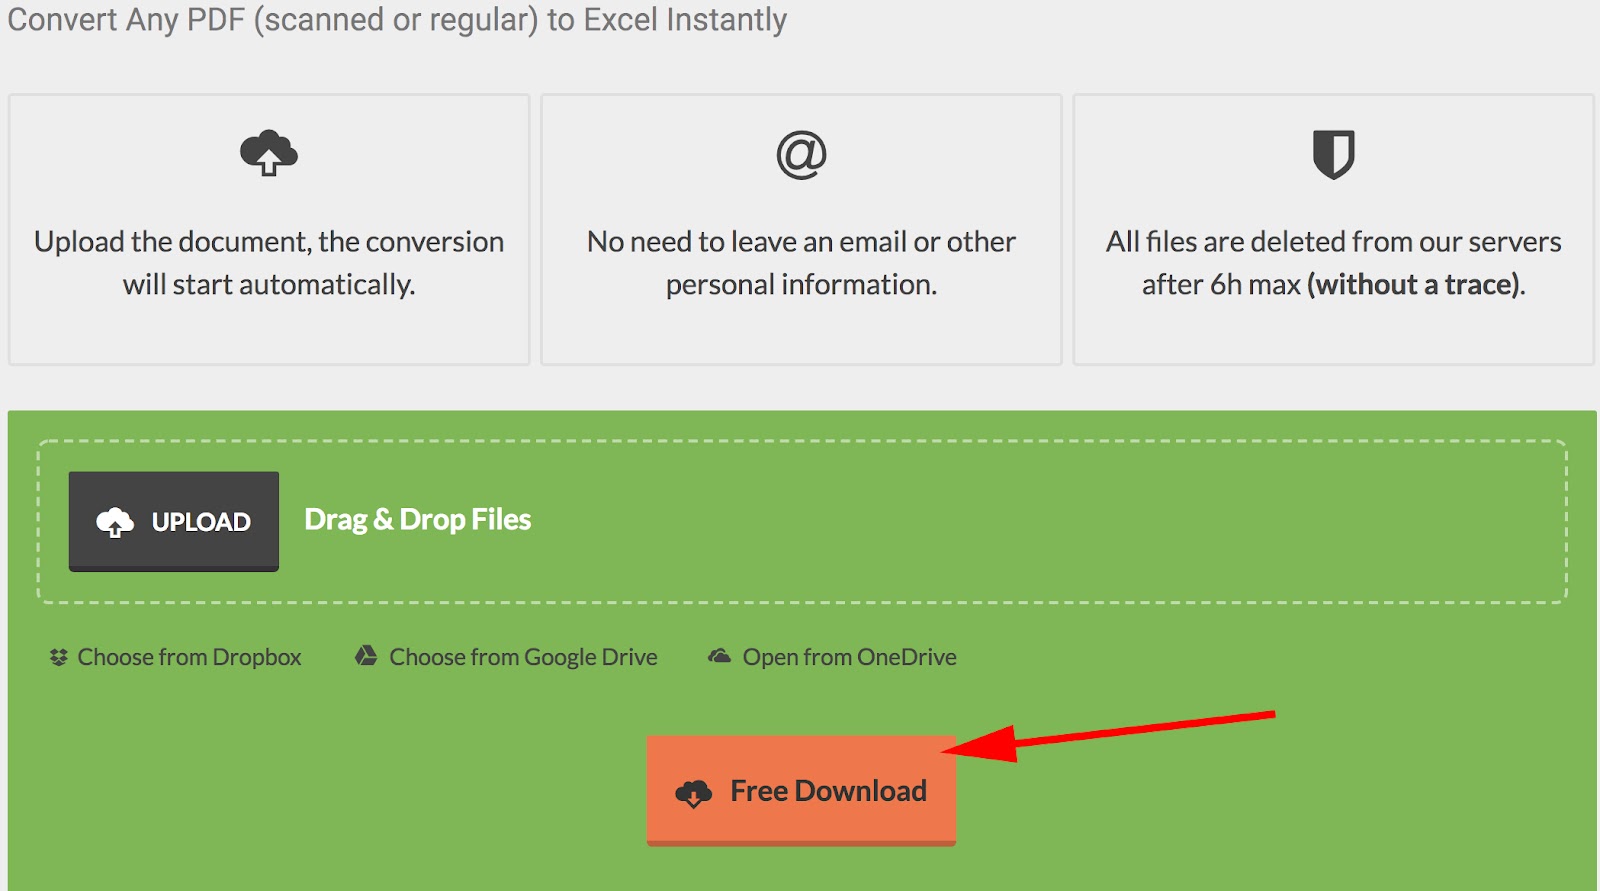
3. Click the orange “Free Download” button
4. Now, the PDF is downloaded onto your computer in an .xlsx format, which means it’s ready to use in Microsoft Excel (versions 7, 10, 13) LibreCalc, OpenCalc, or other office suite compatible with MS Office
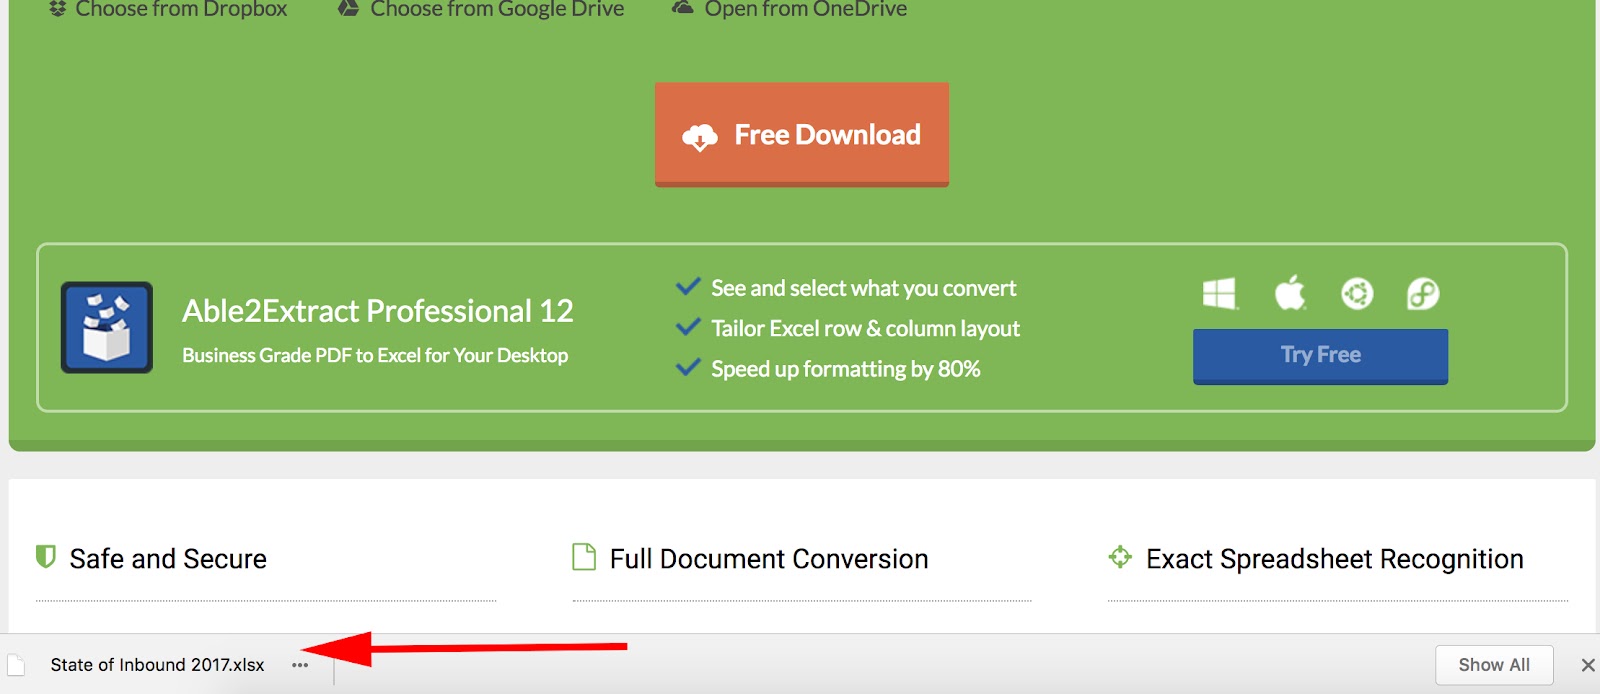
5. Open Excel, and go to “File” → “Open”. Find your .xlsx file, and click “Open”
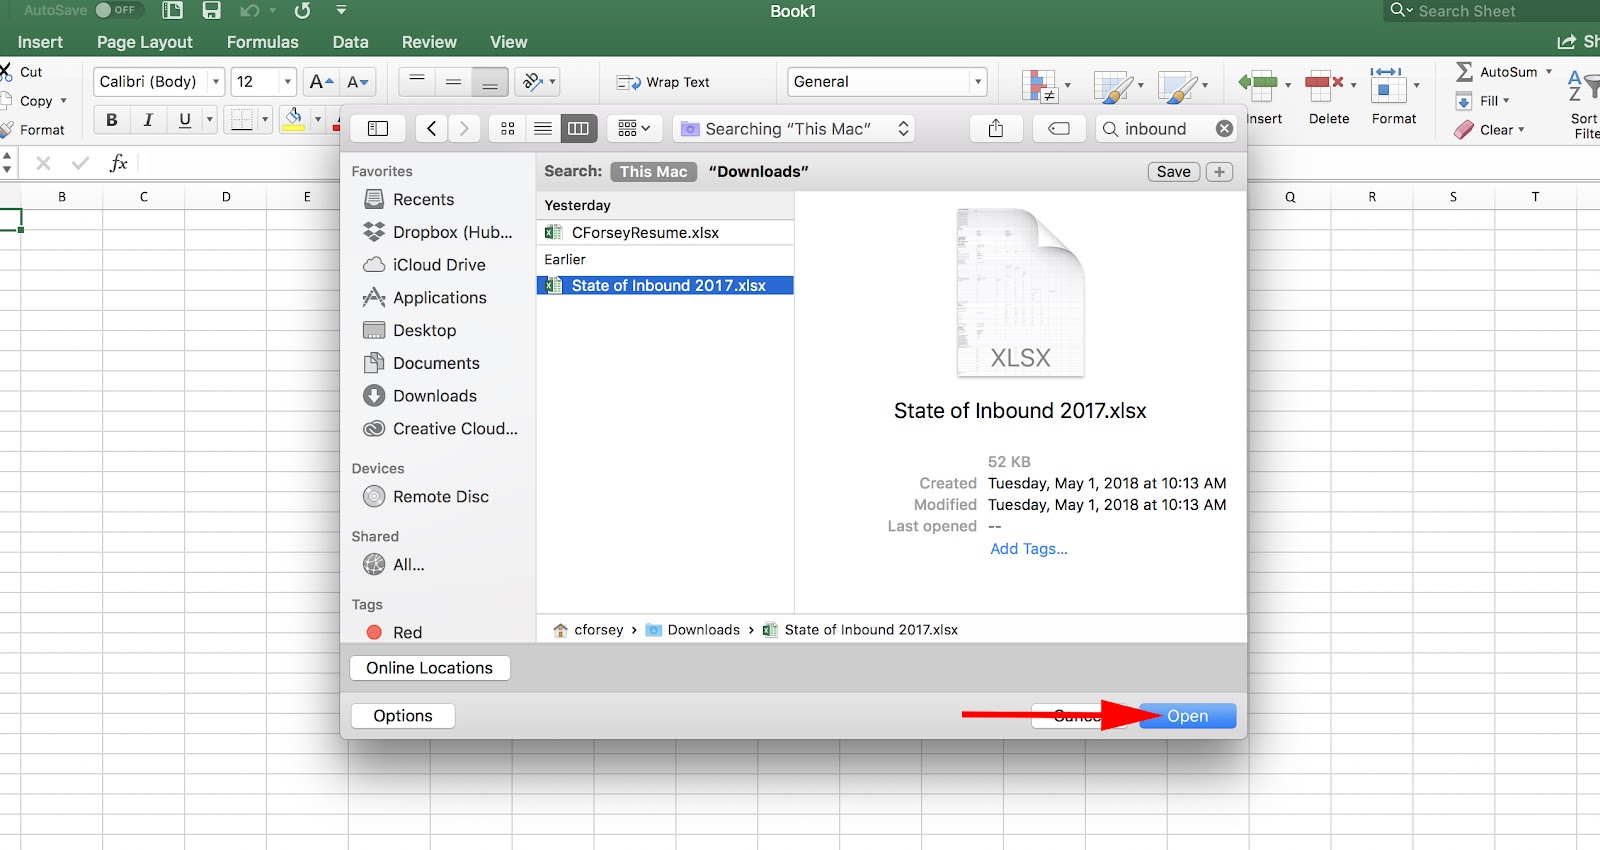
6. There you go! Your PDF is now converted in Excel
The other conversion tools work similarly, but some offer unique benefits. Take a look at our list to decide for yourself if one of them suits your business’s needs more than the rest.
Other free tools to convert a PDF to Excel:
- Tabula: Tabula extracts your PDF data into a format that Excel can read without difficulty, but doesn’t change your PDF into an Excel document itself
- Tabello: Tabello is an easy-to-use Chrome extension that converts your PDF data to an Excel format right from your browser, but it’s only free for the first five conversions (after that, it’s five dollars per 20 conversions)
- Free Online OCR: This tool uses character recognition to extract text from PDF’s and convert it into Word, Excel, or Text formats; allows conversions for different language PDF’s, including Chinese and Japanese
- iSkysoft: This is a paid tool, but you can get a free trial; allows you to convert multiple PDF files into Excel, HTML, Word, or other similar formats
These tools enable you to avoid manually entering data into your Excel sheet (if it’s in PDF format, anyway). This frees up your time so you can spend it analyzing and reporting on that data, instead.

How Cards Against Humanity Helped Us Shape Our Product Story
Cards Against Humanity is more than just a game to me — it led to an epiphany that shaped the way my company developed its product story around content personalization.
If you think about it, playing Cards Against Humanity and personalizing content are surprisingly similar actions. Both require you to know your audience members, understand what resonates with them, and deliver a relevant message. Both also build over time: a message that works at the start might need to evolve to remain relevant. In Cards Against Humanity, the person who delivers the most engaging experience over multiple rounds wins. In business, the company that consistently engages its audience succeeds.
Before I reframed my thinking, our company struggled to communicate what personalization meant in our industry. References to personalization almost always referred to either ecommerce or conversion rate optimization, and everyone wanted to talk about the greatness of Amazon and Netflix. While CRO might be relevant to our customers, ecommerce rarely is, so the B2C construct didn’t hold water for us. We found ourselves explaining what our product wasn’t more than what it was — a content-driven experience that liberates brands from the confines of one-size-fits-all information architecture.
With a little inspiration from Cards Against Humanity, we were able to tell a content personalization story that people easily understood. Read on to find out how we did this, and how your brand can use an analogy to tell your product story effectively, as well.
An Effortless Approach to Product Story
Cards Against Humanity became more than an inspiration for us; it became a metaphor for our product story. With a simple analogy, we turned convoluted explanations about what we do into something people could immediately grasp.
Conversations that were once frustrating became absurdly easy: “Ever play Cards Against Humanity? You know how you have to learn what people respond to if you want them to pick your card? That’s what we do for your website — make it relevant to different audiences by personalizing the experience.”
People immediately understood our company and were eager to learn more. Sales pitches that once took several minutes were reduced to one effective sentence. When we advertised at conferences, people flocked to our booth to play our customized expansion deck of Cards Against Humanity (appropriately named Marketers Avoid Calamity). Industry influencers gave us shout-outs on social media. Most importantly, this new approach landed us one of our biggest clients, a Fortune 500 software company.
Our association with the game was all about disrupting perceptions of personalization. To dispel personalization’s longstanding association with ecommerce, we needed a way to tell our story with brevity and clarity. Cards Against Humanity allowed us to use something familiar and fun to clarify what we mean by personalization.
The ironic beauty of Cards Against Humanity is that it is not all that personal. Every deck of cards is exactly the same. It’s the unique combinations of cards, and the personalized uses of those cards among players, that makes the difference.
Brands cannot change to fit the needs of every consumer, but they can
adapt their story to appeal to people in different ways.
How to Develop Your Own Product Story
My company’s experience with Cards Against Humanity is special to us, but it’s not the only way to tell a simple, effective product story. Other brands can do the same by following a few basic steps.
One great way to tell a product story is to tap into the power of analogy. We used a simple card game to explain our complex business, and people immediately understood what we meant. Many brands try to use analogies for this purpose, but their attempts don’t always hold up. The key is to identify something familiar and easily understood, which allows your audience to easily connect the dots between your example and your business.
In his book, “Winning the Story Wars,” Jonah Sachs identifies three story elements that capture audience attention: freaks, cheats, and familiars. In our case, we leveraged familiars by using an analogy that helped our audience arrive at the intended understanding on their own.
Pick something that works for your brand, and then find ways to make it your own. Infuse your brand’s personality into the analogy. Our third-party Cards Against Humanity expansion pack highlighted our sense of humor while maintaining a high level of relevance for our audience of content marketers and strategists.
That relevance will determine whether your analogy succeeds or flops. According to Content Science, audiences that perceive content as relevant are eight times more likely to feel they accomplished a goal than users who do not perceive relevance. Having clear goals and the path to meet them is a surefire way to create flow in the digital experience.
Throughout this process, focus on the experience. We were able to leverage the tactile, interactive elements of a card game, which felt completely different than a digital experience. That approach worked for us, but feel free to lean on virtual reality or whatever experience works best for your brand.
Whatever analogy avenue you choose, make it easy for audience members to engage with the experience. Gallup reports that only 20 percent of B2B customers are fully engaged, but those customers provide 23% more value than their disengaged peers.
Cards Against Humanity provided us with both the inspiration and the vessel to create a personalized message that captured our audience’s attention. As Brian Clark said, “The right analogy, at the right time, told the right way, may be exactly what they need to do business with you.”
For us, the right analogy for B2B website personalization was a rowdy party game. Inspiration can come from the strangest places — what unexpected analogy can help you tell your story?
Sean Schroeder is CCO of blueriver and co-founder of the Mura Digital Experience Platform. He’s currently consumed with creating content-driven experiences that spark meaningful, relevant connections.

The Decline of Organic Facebook Reach & How to Adjust to the Algorithm
If you’ve been managing a Facebook Business Page over the past few years, you’ve likely noticed a drop in how many of your fans have been viewing and interacting with the organic posts you publish to that page.
There are two reasons for this.
Why Your Organic Reach Has Declined on Facebook
More Ad Content Competing for News Feed Space
This observed decline in organic Facebook reach began in 2014, when Brian Boland, Facebook’s VP of Advertising Technology (at the time), said Facebook is simply managing more ad content than it used to, and News Feed space is thus more competitive among marketers.
Boland, now Facebook’s VP of Publisher Solutions, is right. There’s simply too much content being published on Facebook, making visibility in the News Feed increasingly competitive. And Facebook strives to show people the content that is most relevant to them, as opposed to surfacing all the content available.
Facebook’s 2018 News Feed Change
More recently, you might’ve noticed a greater dip in the organic reach of your Facebook content because of an important change to Facebook’s News Feed algorithm.
In January 2018, according to Facebook’s Head of News Feed Adam Mosseri, Facebook began to “shift ranking to make News Feed more about connecting with people and less about consuming media in isolation.”
As a result, marketing content was poised to take a backseat to content by friends and family — a value that Facebook says it originally had, and that it’s trying to return to.
The good news in all of this is that there’s a lot you can do to counteract these changes, like being more selective about what you publish, paying attention to when you publish, and putting money behind your posts (a.k.a. “boosting” them).
Download our free Facebook guide here for more tips on maximizing your Facebook reach.
Before we dive into how you can improve your Facebook Page’s organic reach and reengage your Facebook followers, let’s explore exactly how Facebook’s News Feed algorithm works. Then, we’ll see how various algorithm changes — including its 2018 update — have affected the reach of a marketer.
How Facebook’s News Feed Algorithm Works
When Facebook first launched News Feed back in 2006, the algorithm was pretty basic. Different post formats were assigned different point values — so a post with just text might be worth one point, while a post with a link in it might be worth two points, and so on. By multiplying the post format point value by the number of people interacting with a given post, Facebook could generate a ranking system for determining the order in which posts would appear.
As the years rolled on, the News Feed algorithm evolved to factor in the recency of posts, as well as the relationship between the person doing the posting and the person interacting with said post. This iteration of the algorithm was known as EdgeRank. But in 2011, Facebook abandoned EdgeRank for a more complex algorithm that incorporates machine learning.
That machine learning-based algorithm is what’s responsible for surfacing content on your News Feed today. Unlike its predecessors, which assigned generic point values to post formats, the current algorithm adapts to individual user preferences. So, for example, if you never, ever, interact with photos in your News Feed, Facebook’s algorithm will pick up on that and show you fewer photos over time.
On the other hand, Facebook has identified for marketers the content formats that drive engagement and sharing — native and live videos. Facebook ranks live videos higher in the News Feed, as well as videos with higher watch and completion rates and videos that are clicked on or unmuted as signals of viewer interest.
Ultimately, there are thousands of factors that inform Facebook’s algorithm of a meaningful interaction. These factors range from using trigger words that indicate important events (e.g., “congratulations”) to whether or not you’ve actually clicked a link in a post before liking it.
Today, Facebook rewards the content that produces these interactions the best: person-to-person content. Facebook’s end goal here isn’t just to match News Feed content to the individual interests of each user — it’s to display News Feed content that reveals connections between each user.
As Facebook’s Head of News Feed Research Lauren Scissors said in a 2018 press release:
“Interacting with people … is associated with a greater sense of well-being. And the benefits [to the content creator] are even stronger when you’re close to the person, and when the interaction requires some effort.”
What Is Facebook Reach and How Has It Changed?
Facebook defines organic reach as “how many people you can reach for free on Facebook by posting to your Page.” Prior to 2012, that number used to be much, much higher than it is now.
2007-2012: Fan Pages
From the moment “Fan Pages” launched in 2007, anyone could create a Page for their company or organization, start collecting fans, and post unlimited messages to their fan bases with the assumption that they would see those messages.
When 2012 rolled around, Page managers learned that only a fraction of their Facebook fans — 16% on average — were seeing their Page posts in their News Feeds. And that fraction got significantly smaller in 2014.
2014: Organic Reach Plummets
A study from Edgerank Checker found that between February 2012 and March 2014, organic reach for the average Facebook Page dropped from 16% to 6.5%. Research from Social@Ogilvy, meanwhile, suggests that for Pages with more than 500,000 Likes, organic reach could be as low as 2%.
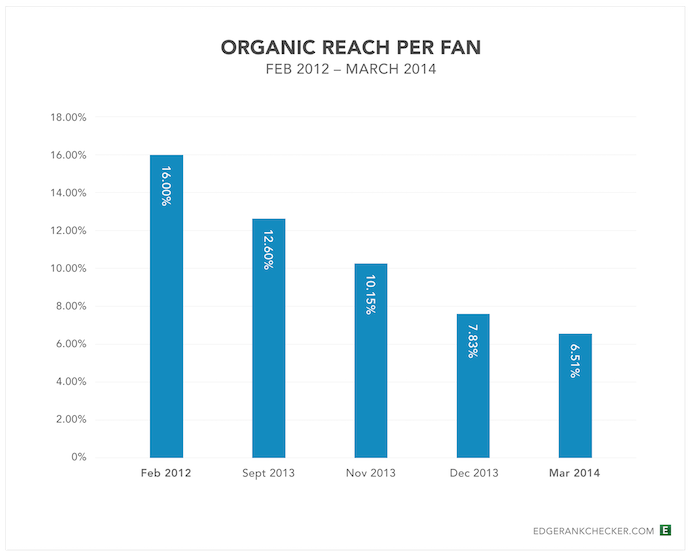 Image via Biznology
Based on the figures above, that means a Page with 10,000 fans could expect just 650 of them to actually see that Page’s posts in their News Feeds. For a Page with 1 million fans, about 20,000 would end up seeing posts (based on the 2% figure).
2016: Reintroducing Friend and Family Content
SocialFlow analyzed more than 3,000 posts by publishers on Facebook and found that organic reach dropped 42% between January and May 2016.
Then, later in 2016, Facebook adjusted its News Feed algorithm again, to further prioritize content from friends and family over Pages. This likely makes News Feed’s current condition less surprising …
In the blog post announcing the algorithm change, Facebook Engineering Director Lars Backstrom warned that Pages could anticipate a dip in organic reach — which could leave reach lower than that earlier 2% estimate, in some cases.
After this algorithm adjustment, SocialFlow adjusted the decline in organic reach — which had dropped further. Between January and July 2016, publishers saw a 52% decline in organic reach on Facebook.
2017: Explore Alternative News Feed
Facebook’s biggest algorithm update for 2017 wasn’t an algorithm update, but rather a new News Feed entirely.
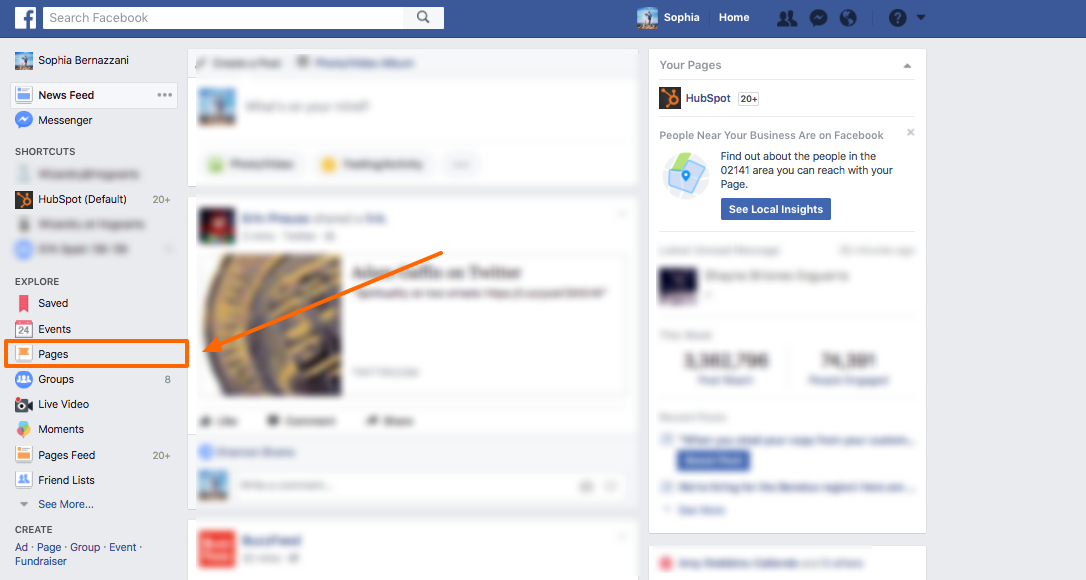
In October of that year, Facebook tested an ad-free News Feed that users could switch to, dedicated to publisher content rather than personal content. To brands, it clearly foreshadowed a Facebook that separated Pages content from friends and family content. Today, that “alternative News Feed” is known as the “Pages” option on the lefthand sidebar of a user’s News Feed.
Just days after Facebook launched this alternative News Feed test, a social media manager for a newspaper in Slovakia reported that 60 of the largest media pages in the country saw their likes, comments, and shares decrease fourfold.
2018: Reinforcing That Commitment to Friends and Family
Facebook’s recent incident of data misuse by analytics firm, Cambridge Analytica, prompted Facebook to deeply address the privacy of users who don’t want their personal information exploited in various ways.
But this process was preceded by a similar yet unrelated News Feed update to focus less on content from Pages and more from a user’s friends and family. This update to Facebook’s News Feed algorithm doesn’t eliminate Page content from News Feeds entirely, but this update does set different priorities for which content gets prime News Feed real estate.
According to a private Facebook webinar hosted in January 2018, those priorities are:
- If the content is shared over Facebook Messenger.
- If the content is Liked or commented on.
- If the content receives multiple replies.
- “Meaningful interactions” between users.
Shares and comments, in particular, are considered “active” interactions, which Facebook considers more “meaningful” when slotting content on a user’s News Feed. For that reason, the company notes that video watch time, referral traffic, and organic reach might decrease this year if the content doesn’t doesn’t stir up a meaningful interaction.
Should You Increase Your Paid Content on Facebook?
Fewer people seeing your Page’s organic posts on Facebook means fewer clicks, comments, and shares. And having fewer of those interactions means fewer conversions, leads, and customers. But this is only the case if your content doesn’t attract comments and shares to begin with.
So, why would Facebook decide to decrease organic post visibility in favor of friend and family content in the first place? How can a marketer create content that competes with the natural appeal of a friend’s new baby picture?
Meaningful Content vs. Paid Content
We already touched on Facebook’s official response to the first question in the introduction: There are simply too many Pages producing too much content for too many fans, which means competition for visibility on the News Feed is high. What’s more, Facebook is trying to make sure people are only seeing the best content — the stuff that is most relevant to them.
Some publishers have cracked the code when it comes to engagement on Facebook: by publishing and broadcasting video. (And we’ll get into that later in the post.) But many in the marketing world suspect that Facebook had (and still has) an ulterior motive: to get people to start spending more on ads and “promoted” content.
So, should you invest in more ads and paid content to get the exposure you want?
Is Paid Content Worth It?
As Facebook has evolved into more of a paid marketing platform than an organic one, Page managers are realizing they’re now expected to pay for ads yet again to reach those newly acquired Fans, even if those Fans have seemingly elected to see a brand’s posts by liking their Page in the first place.
From Facebook’s perspective, it’s simply not an ideal user experience to flood the News Feed with posts just because a Page has lots of Likes and is publishing prolifically.
Nowadays, Facebook is encouraging marketers to look at their fan bases as a way to make paid advertising more effective rather than using it as a free broadcast channel. Additionally, Facebook says you should assume organic reach will eventually arrive at zero. So, if you really want to reach your target audience on Facebook, you’ll need to supplement your organic efforts with some paid advertising.
Should you trust Facebook? Are paid ads on Facebook worth it? They can be — especially if they’re part of a longer content campaign, and can stimulate interest in a story that users might not see otherwise. Learn more about how to advertise on Facebook effectively in Step 8 further down in this article.
How to Deal With Declining Organic Reach on Facebook
Now that you’ve got a better understanding of how Facebook surfaces content, let’s explore some tips for dealing with the decline in organic Page reach.
1. Be more selective about what you post.
Marketers have to switch gears from untargeted, frequent publishing to targeted, selective publishing. The goal is no longer to spray and pray — it’s to get as much interaction from a single post as possible.
Each post published to a brand Page can be targeted to a specific audience regardless of whether or not it’s sponsored, which may improve overall interaction with that post among other people who are likely to find it more interesting and relevant.
2. Remind your Fans they can go to Pages Feed on the left sidebar of their News Feed to see content from Pages they’ve Liked.
3. Educate your super fans that they can update their notification settings from your page.
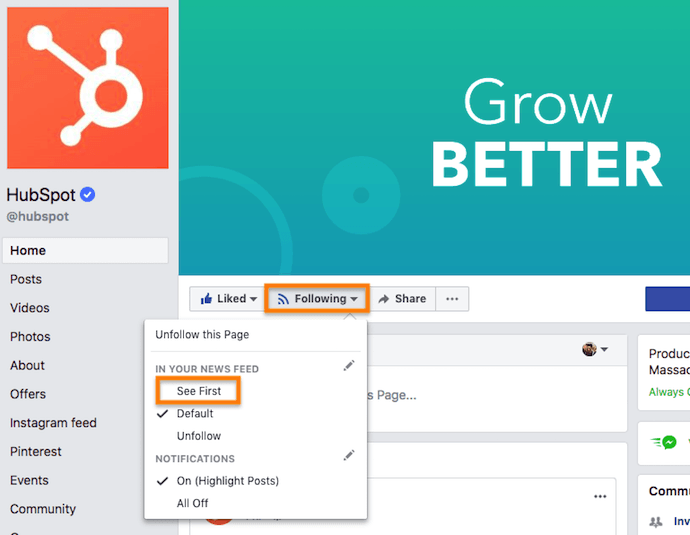
4. Encourage fans to engage with your posts when they do see them, so they see more of them.
This can be as simple as adding a reminder to “Please Like and share” at the end of your posts.
5. Share engaging videos on Facebook.
Videos on Facebook are engaging and make visitors more likely to stop, watch, and maybe even unmute when they spot them in the News Feed. Use videos with captions, animations, and engaging visuals to draw in Facebook users’ attention.
According to a recent study by quintly, native Facebook videos have an 186% higher engagement rate and are shared more than 1000% more than videos linked to from other hosting sites. Take the extra steps to publish videos for the platforms you’re promoting them on for best results — distribute your content on Facebook, YouTube, and other social platforms you’re trying to leverage.
6. Broadcast on Facebook Live.
If you’re not already doing so, start broadcasting on Facebook Live. Users spend 3X more time watching live broadcasts than traditional videos on the platform, so start experimenting with live content if you’re concerned about your organic reach. Advertise what you’re doing on different platforms to generate buzz, broadcast for several minutes (at least) to help your broadcast get surfaced in the News Feed, and share authentic, behind-the-scenes content to attract and interest your viewers.
To learn more about Facebook Live broadcasting strategies, check out our free guide.
7. Re-allocate your time and effort toward your owned assets.
Since the only constant with Facebook (and the larger digital media landscape) is change, it’s always safest to focus on the digital channels you entirely own and control — your website and blog. Spend the vast majority of your effort creating content (blog posts and long-form content such as ebooks, case studies, or videos) that will continue to garner inbound traffic, leads, and customers long after they’re first created. If you have time and budget, share those assets to Facebook for additional reach.
8. Start treating Facebook like a paid ad platform.
If you’re going to pay-to-play, get your targeting right. Once you’ve built an audience of relevant fans, focus on advertising the content assets you’ve created — blog posts, ebooks, etc. — and use ads to amplify them to targeted users. Remember: It’s likely only a matter of time before organic reach hits zero, so you might as well hone your paid strategy now, which brings me to one final recommendation …
9. If you do advertise, go beyond the basics.
Facebook’s targeting capabilities have gotten considerably better over the past few years. You can now pay to reach your ideal persona based on demographics, interests, web behavior, and more. Additionally, there are a bunch of tools and features that can help you maximize the effectiveness of your campaigns, including:
- Conversion Tracking: Track the actions of site visitors after viewing your Facebook ad.
- Custom Audiences: Target Facebook ads based on your email list.
- Lookalike Audiences: Target Facebook users similar to your customers.
- Audience Insights: Learn about your existing Facebook audience to better target your ads.
- Website Custom Audiences: Target Facebook users who have visited your website before.
- Facebook Exchange: Place retargeted ads on Facebook for users who’ve visited a certain product or service page on your site.
- Lots of Customizable Reporting: Create reports based on metrics that matter most for your business.
To learn more about how you can improve your Facebook Page’s reach, check out our free guide: How to Attract Customers with Facebook.


Top 10 Best To Do List Apps to Simplify Your Task Management in 2018
You know the phrase, “One man’s trash is another man’s treasure”? That’s how I feel about to-do lists.
After all, how you track your tasks depends entirely on the person. Are you looking for a simple interface, or are you hoping to color-code and categorize hundreds of tasks at once? Is this to-do list for yourself, you and your family, or you and your entire team? How much do aesthetics matter?
There are hundreds of to-do list tools out there, but some of them are just plain better than others. To help you separate the really solid ones from the rest, we’ve curated a list of 10 of the best to-do list tools below, including short descriptions to help you determine which may be right for you.
Best To Do List Apps
- Wunderlist
- Todoist
- Trello
- ToodleDo
- Any.DO
- Things
- TickTick
- Google Keep
- OmniFocus
- Habitica
Top 10 Task Management Tools to Download in 2018
1. Wunderlist
Price: Free
iOS | Android | Chrome
Wunderlist was my best to-do list app of 2017. Well, it’s remained my favorite this year — especially now that both its Basic and Pro versions are now free to access (Wunderlist Pro used to cost $4.99/month).
This app is such a powerful productivity tool that Microsoft bought it in 2015, The Verge named it best to-do list app the year before, and Apple named it App of the Year the year before that. And unless you want features like unlimited task delegation and file uploads, the free version offers just about everything you’ll likely need.
In a nutshell, Wunderlist lets you create to-do lists you can then share with friends, family, or coworkers — who will have editing capabilities of their own. And the user experience (UX) doesn’t get messy, even when both people are working on a list at the same time. When I use Wunderlist to share a grocery list with my roommate, for example, we’ll sometimes go to the grocery store together and tackle the list simultaneously. And it’s actually fun to check things off and watch her check things off at the same time.
Finally, it’s sleekly designed and very user-friendly. Adding and checking off list items is simple and intuitive, as is adding and checking off sub-tasks, adding a due date, adding any reminders you may want, and so on.
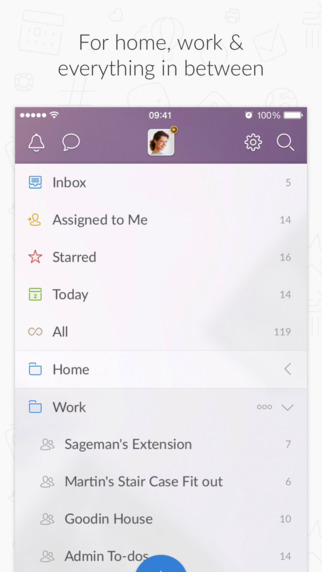
Image Credit: AppAdvice
Earlier this year, the service integrated with Slack to show its tasks and notifications in the work-collaboration tool while its users chatted in real time. To enable integration with Slack, here’s what you need to do:
- Sign in to Slack. Click on your company name in the top left corner, then choose “Configure Integrations” from the dropdown menu.
- Under “All Integrations,” find “Wunderlist” and click “Add.”
- Select or create a Slack channel, and then click on “Add Wunderlist Integration.”
- Once you’ve authenticated Wunderlist, all you have to do is choose a list from your Wunderlist and click on “Save Integration.” Boom, done.
2. Todoist
Price: Free for Basic, $29/yr. for Premium
iOS | Android | Chrome
Although Todoist has been around for a while, it’s become especially powerful in just the last few years. This tool includes a ton of great features that let you organize tasks by date, color-code them, and so on.
The free version has fewer features than Wunderlist’s free version, but it’s very well-designed and user-friendly. You can create sub-tasks and dependencies, projects, and sub-projects. You can attach due dates to these tasks, prioritize them using a color-coding system, categorize them, and more. The premium account costs $29 per year and includes push notifications, email reminders, labels, and filters.
Todoist is available for (and looks great on) every major platform: the web, iOS and Android apps, desktop apps for Windows and OSX, add-ons for Firefox and Chrome, plug-ins for email apps like Gmail, Thunderbird, and Outlook, and more. Not to mention, it integrates with services like Google Drive, Sunrise Calendar, and IFTTT.
3. Trello
Price: Free for Basic, $8.33/user per mo. for Business Class, or $20.83/user per yr. for Enterprise
iOS | Android | Chrome
Trello is the online project management tool that our blogging team uses here at HubSpot. It lets you drag, drop, color-code, and manipulate to-do list items in a way that many of the other tools on this list don’t.
You can arrange larger projects into “boards,” under which you can add all sorts of lists to break down that bigger project into sub-projects. Under each list, you can add what they call “Cards,” which are items in a list. You can add a due date, a checklist, notes, attachments, and color-coded labels to each card. You can also drag and drop cards between lists and boards.
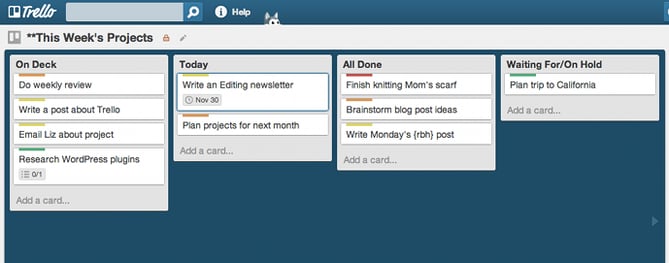
Image Credit: Cloud Couch
My favorite thing about Trello is that it lets you visualize your to-do list in a way that’s easy to follow — including a calendar view. In the calendar view, you can see what your upcoming tasks look like a week or a month at a time. You can also drag and drop cards between calendar days to change their due dates.
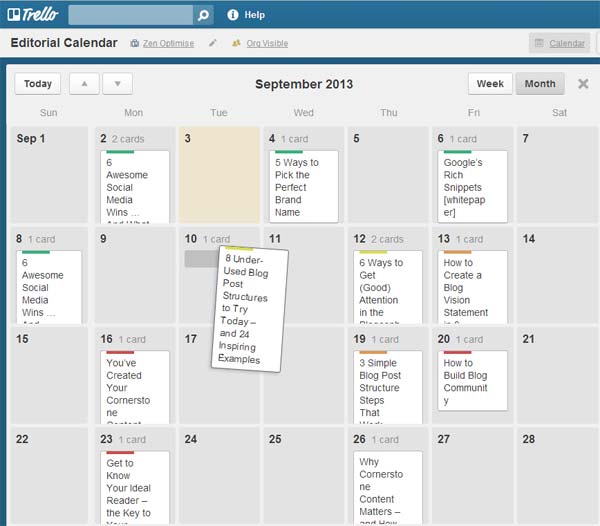
Image Credit: BlueGlass
The free version lets you create unlimited boards, lists, cards, members, checklists, attachments, and so on, and allows integration with Box, Google Drive, and Dropbox. The paid versions allow for more storage, more customization, stricter privacy options, and other added features.
4. ToodleDo
Price: Free
iOS | Android | Chrome
Here’s a task management tool some of the most organized people in my life swear by. ToodleDo is a very user-friendly tool for organizing simple to-do lists on your iOS and Android devices and on the web. It’s heavily focused on tasks, and that’s what the tool does best. Under each task, you can sub-tasks, additional notes, priority ratings, due dates, and reminders. You can also organize your tasks into different folders.
While it used to lack some of the aesthetic that other apps (especially Wunderlist) do well, it recently went through a redesign that did wonders for its design. Here’s a before and after shot, with the updated version on the right:
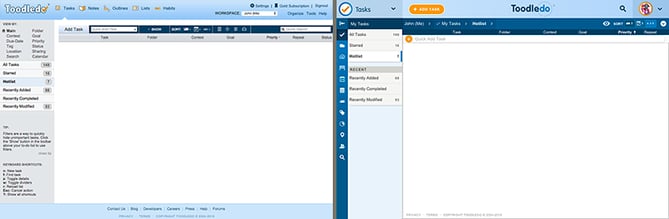 Image Credit: ToodleDo
Although it’s mostly for task management, there are also sections of the tool where you can take notes, create outlines, and even track your habits, like in the screenshot below. You can also share your lists, collaborate with others, and assign tasks to anyone you’d like.
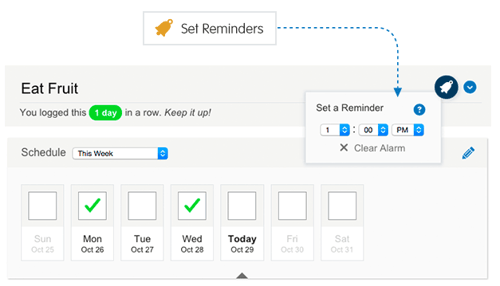
Image Credit: ToodleDo
5. Any.DO
Price: Free for Basic, $2.09/mo. for Premium
iOS | Android | Chrome
Any.Do is one of the more beautifully designed apps on this list. It offers all of the features you’d want in a to-do list app, including drag-and-drop and swipe-to-complete, but there are a few things that make it stand out.
For example, its key differentiator is “the moment” — a push notification you get each morning telling you to plan your day. There are also a few other cool and delightful features in there, like voice entry and the ability to shake your device to clear finished tasks.
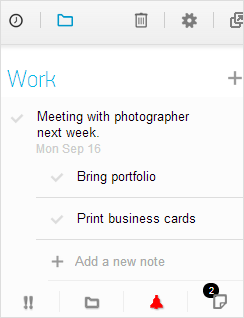
Image Credit: Tech Norms
It’s designed for the iPhone but can be used on iPad, as well as on the web and desktop with full syncing. Lifehacker named the app its favorite to-do app for iPhone, although the folks there admit it isn’t as intuitive or as robust in terms of features as other apps like Wunderlist and Todoist. It also has a Chrome extension with a four-star rating and over 2,000 reviews. Here’s a video that’ll walk you through its user interface and capabilities:
Any.DO Moment from Any.DO on Vimeo.
6. Things
Price: $9.99
iOS | Chrome
“‘Things’ might be the prettiest to-do list app ever,” reads a review from WIRED. “It doesn’t shout in your face about all the work you have to do today. It’s more like a clean, crisp piece of paper, ready whenever you need it.”
That sums up the user experience pretty well. Now known as Things 3, this third-generation task manager is intuitive, well designed, and very simple.
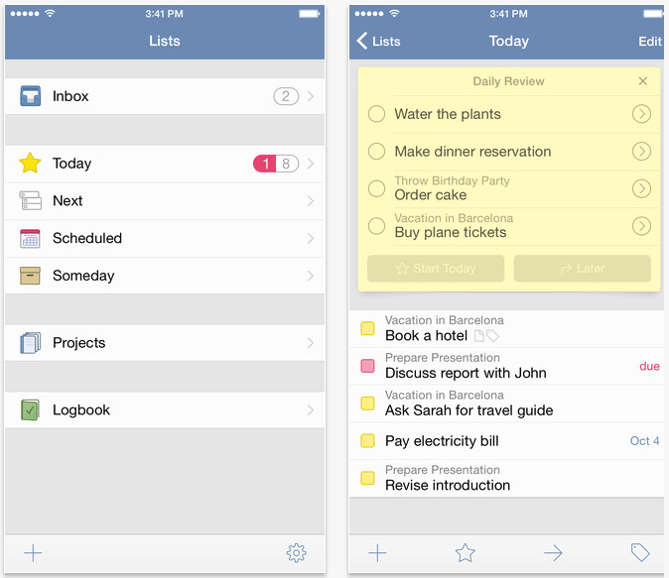
Image Credit: Things
For some, though, its simplicity might be a big turnoff. A review from The Verge says, “Things is still for individuals — there’s no easy way to collaborate with colleagues on your projects.”
It’s also not the most intuitive to due dates if you describe a particular task with the time to completion; if you say “next Wednesday” in the task description, you’ll have to set the corresponding deadline manually.
Nonetheless, if all you want in a to-do app is a beautiful design and the ability to organize simple tasks and lists — and you have $10 to spare — then Things could be a good bet. If you like the idea of checking things off on your Apple Watch, it also offers full Apple Watch Support. Otherwise, you might be better off going with something more complex.
7. TickTick
Price: Free for Basic, $1.99/mo. or $19.99/yr. for Pro
iOS | Android | Chrome
TickTick is a relatively new player, but it has a lot of potential. Like many of the other tools on this list, you can add new tasks, sub-tasks, set deadlines and custom reminders, and share with other users. You can also set recurring to-do list items for every day, a specific number of days, a week, a month, and so on.
The Pro version has a great calendar view where you can see what your to-do list looks like on a daily or weekly basis and get ahead of the game. You can drag tasks to change the order, and drop tasks into the calendar on the bottom left to set a due date. It also has revision history and an “experimental labs” feature.
In addition to its mobile apps, TickTick now offers Windows and Mac web apps as well. This to-do tool has a beautiful interface with a solid — and growing — feature list. Keep an eye out for updates and check out TickTick plans here.
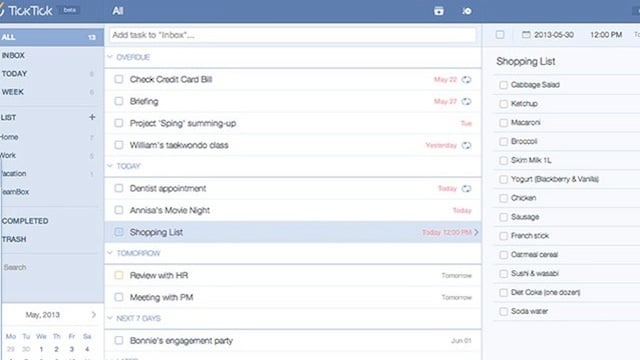 Image Credit: Lifehacker
8. Google Keep
Price: Free
iOS | Android | Chrome
Google Keep has existed under the radar for a long time, but it’s actually a great tool if you’re looking for a place to quickly make and save lists and notes and access them across multiple devices.
At its core, Google Keep is a simple notepad that connects to Google Drive, where you can keep checklists, photos, voice notes, and other text notes that sync across multiple devices as well as the cloud.
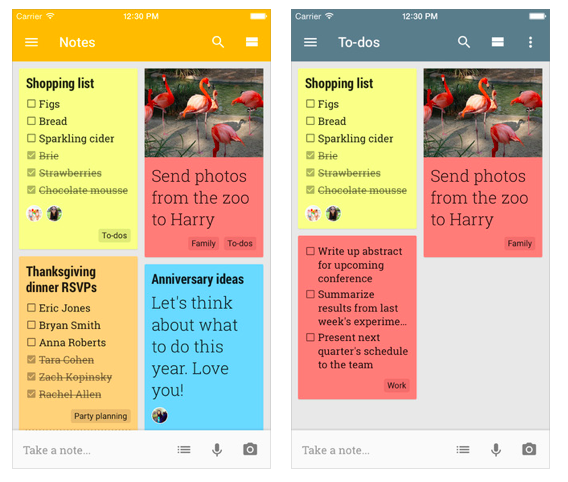
Image Credit: ShareChair
Google Keep doesn’t have nearly as many features as other to-do list apps, and its design isn’t as regimented — but if you’re an avid Google Drive user and like to create and edit lists on-the-go, then this could be a great option for you. You can learn more in this video:
9. OmniFocus
Price: $39.99 for Standard, $79.99 for Pro
iOS | Chrome
Don’t let the price tag deter you: If you’re an iOS user with a lot of different projects and tasks to track, and you’re looking for an app that organizes all these items in a super comprehensive way, then you’ll want to check this out.
This app’s latest product is OmniFocus 2. On its home screen, you’ll find a forecast summary of your upcoming to-do’s, as well as color-coded badges that show you what needs attention at-a-glance. Whenever you think of a new to-do list item or task, you can quickly enter them into your “Inbox,” during or after which you can apply this item to a specific folder, list, or context.
While most people would prefer something a little simpler, this is a great option for power users that are cool with a bit of a learning curve.
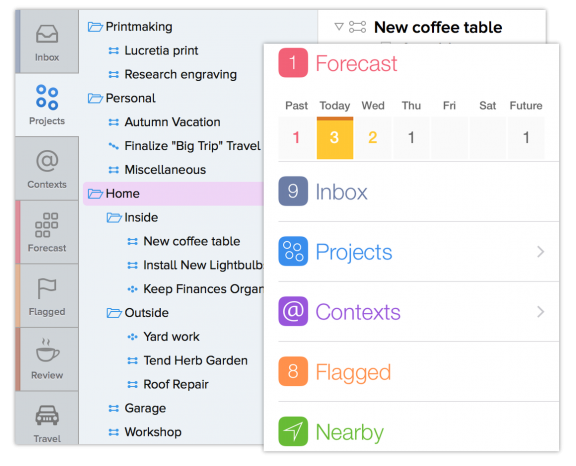
Image Credit: OmniGroup
10. Habitica
Price: Free
iOS | Android | Chrome
This one is for the video game lovers among us — or anyone interested in quite literally “gamifying” their life. Formerly HabitRPG, Habitica is a habit-building app available on iOS and Google Play that turns your to-do list items and projects into a medieval-themed, role-playing game.
You can level up your character when you succeed, earn money to buy weapons and armor, and defeat enemies — just by crossing things off your real list of tasks.
If you miss deadlines or fail to cross things off, you’ll take hits to your health and your character will lose progress. You can categorize your achievements into folders like “School & Work,” “Health & Fitness,” and more.
If you’re looking for a tool that’ll simply help you build good habits and encourage you to cross things off your to-do list, Habitica is a good option for you. Plus, you can compete with your friends to help hold yourself accountable. Get a better idea of how it works in this video:
Ready to download one of the task list apps above? Put all your projects on the app of your choosing, then download the free guide below to learn how to stay on track during the day.

Variable Cost Explained in 200 Words (& How to Calculate It)
There’s a frustrating truth every business deals with early into its growth. To reveal that truth, I’ll start with a song title by hip-hop legend, The Notorious B.I.G.:
“Mo money, mo problems.”
The Notorious B.I.G. is literally saying “more money, more problems.” And although this hit song doesn’t dive into the intricacies of accounting, it does support a frustrating truth about business: the more revenue you generate from sales, the more you’ll have to spend to keep selling.
Let’s unpack why that’s the case with one of the most important and useful financial figures to a growing business today: variable cost.
Variable Cost Formula
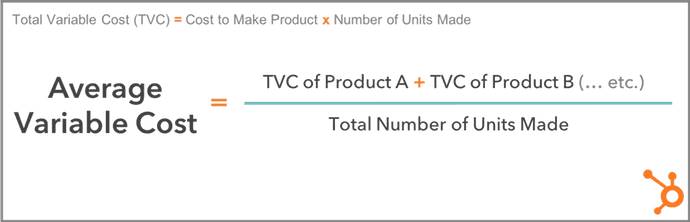
Variable costs are the sum of all labor and materials required to produce a unit of your product. Your total variable cost is equal to the variable cost per unit, multiplied by the number of units produced. Your average variable cost is equal to your total variable cost, divided by the number of units produced.
Variable costs vary because they can increase and decrease as you make more or less of your product. The more units you sell, the more money you’ll make, but some of this money will need to pay for the production of more units. So, you’ll need to produce more units to actually turn a profit.
And because each unit requires a certain amount of resources, a higher number of units will raise the variable costs needed to produce them.
A kitchenware maker might sell 10 knife sets for a total of $300, for example, but maybe $100 of this revenue goes into crafting the next 10 knife sets. If the business sells 20 knife sets for $600, it pays $200 of this revenue to make the next 20. The kitchenware maker’s net revenue only increased by $100, while its variable costs rose by $300.
Hence the words of rapping sensation The Notorious B.I.G., “mo money, mo problems.”
Variable costs aren’t a “problem,” though — they’re more of a necessary evil. They play a role in several bookkeeping tasks, and both your total variable cost and average variable cost are separate calculations. With that in mind, here’s what you need to know about variable cost in fewer than 200 words:
Variable Cost Defined in 200 Words
Variable cost denotes the money your business specifically spends on the development of goods and services. Businesses can use variable costs to calculate more complex financial values, such as their contribution margin and break even point.
You can represent your variable cost two different ways: by total variable cost or by average variable cost.
Total Variable Cost
Your total variable cost is the sum of the variable cost of each individual product you’ve developed. Calculate total variable cost by multiplying the cost to make one unit of your product by the number of products you’ve developed.
For example, if it costs $60 to make one unit of your product, and you’ve made 20 units, your total variable cost is $60 x 20, or $1,200.
Average Variable Cost
Your average variable cost uses your total variable cost to determine how much, on average, it costs to produce one unit of your product. You can calculate it with the formula below (for reference, the equation to the top left of the box is your total variable cost).
Total Variable Cost vs. Average Variable Cost
If the average variable cost of one unit is found using your total variable cost, don’t you already know how much one unit of your product costs to develop? Can’t you work backwards, and simply divide your total variable cost by the number of units you have? Not necessarily.
While total variable cost shows you how much you’re paying to develop every unit of your product, you might also have to account for products that have different variable costs per unit. That’s where average variable cost comes in.
For example, if you have 10 units of Product A at a variable cost of $60/unit, and 15 units of Product B at a variable cost of $30/unit, you have two different variable costs — $60 and $30. Your average variable cost crunches these two variable costs down to one manageable figure.
In the above example, you can find your average variable cost by adding the total variable cost of Product A ($60 x 10 units, or $600) and the total variable cost of Product B ($30 x 15 units, or $450), then dividing this sum by the total number of units produced (10 + 15, or 25).
Your average variable cost is ($600 + $450) ÷ 25, or $42 per unit.
Variable Cost Examples
So, what’s considered a variable cost to the business?
Depending on the goods or services you develop, you can classify many of your expenses as variable costs. In general, any recurring cost that doesn’t fluctuate as the business grows or shrinks is a fixed cost. A classic fixed cost is rent on office space: no matter what happens within the business, you still pay the same building rent. So, any cost that doesn’t fall into this category is likely a variable cost.
To make it easier for you to identify which of your costs you should factor into your total variable cost calculation, we’ve put together a brief list of variable cost examples below.
- Physical materials: this can include parts, cloth, and even food ingredients required to make your final product.
- Production equipment: if you automate certain parts of your product’s development, you might need to invest in more automation equipment or software as your product line gets bigger.
- Sales commissions: the more products your company sells, the more you might pay in commission to your salespeople as they win you customers.
- Staff wages: The more products you create, the more employees you might need, and the bigger your payroll.
- Credit card fees: businesses that receive credit card payments from their customers will incur higher transaction fees as they deliver more services.
- Packaging and shipping costs: you might pay to package and ship your product by the unit, and therefore more or fewer shipped units will cause these costs to vary.
It can be daunting to calculate expenses that change as your company evolves. Sometimes, you just want to know exactly what you’re paying to run your business. Using the formulas above, however, you’ll be able to easily track your variable costs no matter what stage of life your business might be in.

The 8 Best Excel Alternatives
Excel is one of the world’s most popular spreadsheet programs, with an estimated 750 million people using it for data summary and organization, analysis, and reporting.
While it’s a commendable data system for teams within a business, it’s not free — a standalone copy of Excel 2016 is $129.99, and the Office personal subscription is $69.99 per year for one user.
Equally important to note, Excel has its fair share of shortcomings, and there are some alternatives that might work better for your team or project.
If you feel you could be better off using a different data spreadsheet system, or if you simply don’t have the means to pay for one, take a look at our list of the eight best Excel alternatives.
Best Excel Alternatives
- Google Sheets
- Numbers
- Thinkfree
- Birt Spreadsheet
- Zoho Sheet
- FreeOffice2016
- Apache OpenOffice
- Quip
1. Google Sheets
Price: Free
If you have a Gmail account, you already have access to Google Sheets. Google Sheets, an almost equal competitor to Excel in both layout and features, has a few benefits that Excel lacks. For one thing, your files on Google Sheets are saved in the Cloud. That means if you use multiple devices for business purposes, you can’t beat the automatic accessibility of Sheets.
Second, you can share your Sheets with anyone on Slack or email and make edits simultaneously, allowing for optimal collaboration and teamwork on projects. Lastly, with Sheets, you have the advantage of other Google tools, like Google Translate, GoFinance, and Import Feed/Import Data functions, which enable you to pull data straight from web page’s URLS.
2. Numbers
Price: Free (for Mac users)
This program comes free with every Mac, and is essentially Mac’s own version of Microsoft’s Excel. Numbers provides high-quality data analysis and reporting functions, as well as plenty of visual tools. The program uniquely provides pre-built templates, dynamic donut charts and graphs, and a library with more than 600 shapes to turn your data into presentation-ready visuals. Since it’s in the iOS system, you can use the program on any Mac device, making it easy to access your data on the go or from home. In a show of great sportsmanship, Numbers also enables you to save your spreadsheet as an Excel file, to share with anyone who prefers to stick with Excel.
3. Thinkfree
Price: 2/months free trial; Enterprise version $79.99
ThinkFree offers three primary features, which are compatible with office programs: Write, Calc, and Show. The Excel alternative, Calc, lets you create spreadsheets and presentations and provides 1 GB of free online storage, and like Google Sheets, you can collaborate with colleagues on ThinkFree documents. Most notably, ThinkFree allows you to edit and view your documents on your mobile device, if you want to make changes to your spreadsheet away from your computer. ThinkFree doesn’t require any Office installation.
4. Birt Spreadsheet
Price: Free
This Excel alternative is particularly helpful for data analysis, with features including live formulas, pivot tables, hyperlinks, and data-driven layouts. Birt Spreadsheet (formerly Actuate e.Spreadsheet) automates and centralizes all your spreadsheet production, maintenance, and security. Birt also provides a Spreadsheet Designer, which creates reports to retain formulas, formatting, live charts, and data connections.
5. Zoho Sheet
Price: Free for teams of up to 25 users
One of the biggest perks of Zoho is that it’s Cloud-based, so you can access your data wherever and whenever you want. It offers functions including charts and pivot tables comparable to Excel, and you can also switch easily between .xlsx, .xls, .csv, and .ods. Plus, Zoho allows you to edit a spreadsheet with colleagues simultaneously, making collaboration easy. Along with functions to simplify formulas, and filters to analyze data, Zoho also provides visual charts and tools to create presentation-ready graphics.
6. FreeOffice 2016
Price: Free
The features in FreeOffice’s Excel alternative, PlanMaker, are very similar to Excel, including conditional formatting, pivot tables, and data visualization tools to create presentations. Best of all, FreeOffice’s programs are compatible with Microsoft Office file formats, so if you tend to use Microsoft Office, this alternative makes for easy transfers to any Microsoft product. The FreeOffice tools are clean and intuitive, and they’re also fast, even with dense data. However, if you want to save files as .doc, .xlsx, or .ppt., you’ll need to purchase a paid plan.
7. Apache OpenOffice
Price: Free
Apache OpenOffice, used on over 100 million computers, offers free software for word processing, spreadsheets, presentations, graphics, and more. It’s an open-source program, which means you can modify the program to meet your business’s needs, and it’s downloadable, which means you can work on your spreadsheets without wifi. Data is stored in an open standard format, and Calc, Excel’s alternative, performs data analysis.
8. Quip
Price: Free trial/$30 yearly for five members
If your team collaborates on budgeting or data reporting, Quip is a useful tool — it enables your team to operate and manage spreadsheets together, simultaneously. With over 400 functions, the Excel alternative has the capability to handle complex projects, and is used by companies including Facebook, CNN, and Pinterest. If you’re hesitant, Quip offers a free trial so you can try it out.

How to Build an Ecommerce Business Amazon Can’t Compete With
Today, giants define our world. A few big companies like Apple, Facebook, and Google shape our social lives, curate how we consume information, and influence what we buy. For the most part, this isn’t a bad thing: these titans offer wonderful products and services that make our lives better and help our businesses run smoothly.
But, as those of you who run small, ecommerce-powered businesses know very well, there is one giant who makes things very complicated. It’s impossible to be an online merchant and not have a point of view on Amazon. Love them, hate them, or something in-between — you all have a relationship with Amazon. Frankly, they can make it a real challenge for small businesses to grow past a certain point. But they don’t make it impossible.
Lately we’ve seen more and more HubSpot customers thrive in ecommerce, even though Amazon sells similar or even identical products as them. How can this be? I’ll tell you, but first let’s start from the beginning.
Nashua, New Hampshire is a quintessential New England city. It’s full of folks who love their Dunkins, wear Bean Boots 10 months out of the year, and pledge allegiance to Red Sox nation. It’s not a place you’d imagine one of the most influential technologies of the last 100-years might be born. But it is.
In August of 1994 21-year-old Dan Kohn put his new encryption technology to work to securely sell a Sting CD to Phil Brandenberger. It was the first sales transaction in the history of the internet, and it set off a series of events that would change the world forever.
That same summer, Jeff Bezos left his job on Wall Street to move to Seattle and found Amazon. Over the next 20+ years, the ecommerce industry would grow exponentially. A trend that is still up-and-to-the-right today.
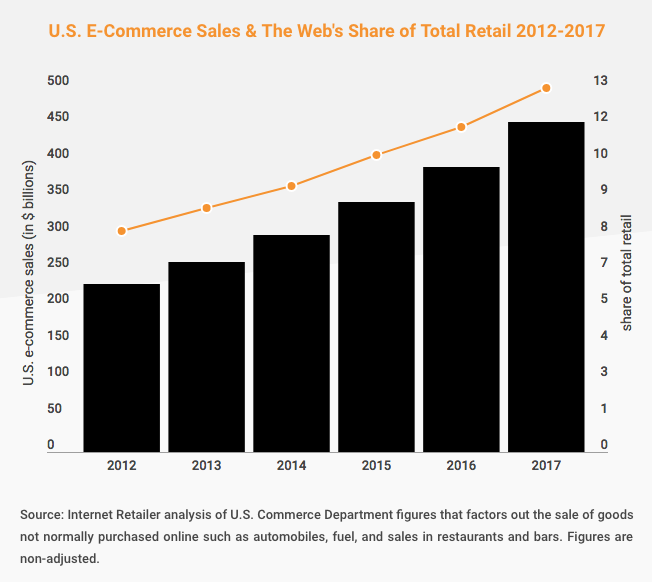
Today, there’s nothing people won’t buy online. The internet has challenged us to buy things on the internet that we used to think had to be purchased in person. But now, no one thinks twice about buying eyeglasses, food, or even cars online. The convenience and speed of making purchases online means the majority of us check there first before buying anything.
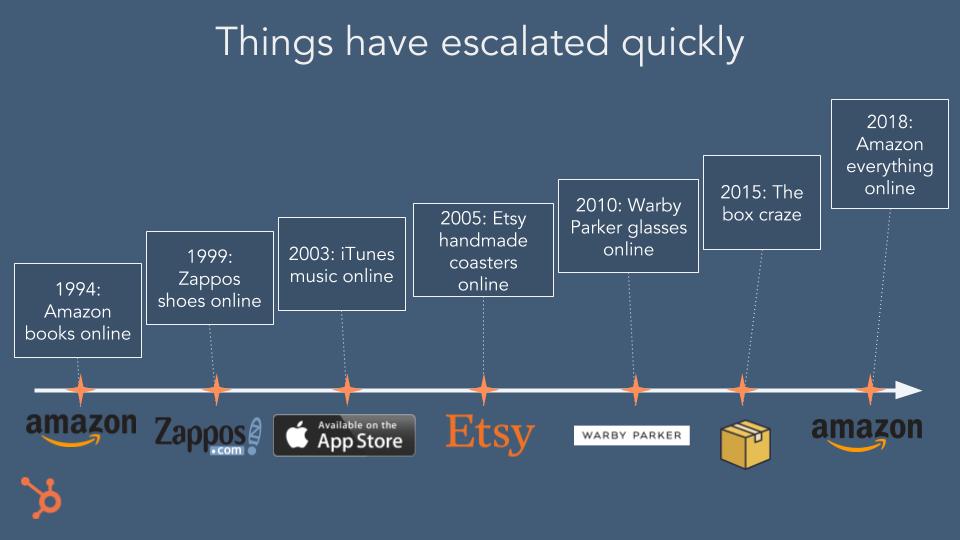
The ability to buy and sell online has been a win for everyone involved. Consumers love the convenience, speed, prices, and accessibility ecommerce delivers, and entrepreneurs love that they can now turn limited passion projects into full time careers and viable businesses.
It’s a good time to be an Ecommerce SMB.
The ability to sell online has created thousands of new businesses — and there’s still plenty of room to grow. The increasing demand to buy everything online has made it easy to find an initial audience, software like Shopify makes it simple for non-technical people to create a web store, and powerfully targeted ads from Google and Facebook make it easy to expand your audience.
Getting started has never been easier — the challenge now is figuring out how to scale.
There are plenty of big, scary challenges for a small ecommerce business, but none are quite as terrifying as the elephant in the room: Amazon.
Amazon and a few others eat up the majority of the world’s ecommerce demand. They sell everything imaginable online and are only expanding. They offer the best prices, the fastest shipping, excellent customers service, and have massive brand awareness. For small ecommerce businesses, they can feel like a major roadblock. Some SMBs have managed to cultivate mutually beneficial relationships with Amazon, but many worry about getting permanently stuck on the wrong side of a losing battle.
What’s next in ecommerce marketing?
Most ecommerce entrepreneurs know that quickly after product market fit they’ll need to adapt their marketing strategy to compete with the giants. Competing with the likes of Amazon is obviously a challenge, but it can be done — and while all businesses are different, there is a common three-part formula to making it happen.
1. Meet modern buyers’ expectations.
You may not always be able to compete with the giants on price, but you have to rise to meet or exceed their level of service. The giants generally offer 24-7 support, fast shipping, and are generous on returns. Their level of service has become the industry standard. If you’re not already investing in building a great customer experience, now is the time.
Customers will understand if you can’t ship as fast as Amazon, but they won’t forgive you for not answering their questions quickly.
Start using tools like Facebook Messenger and live website chat to help customers in real-time in addition to email. Make sure you’re aware of customer issues through surveys like Net Promoter Score (NPS), and are encouraging customers who love you to leave positive reviews. Future customers trust those reviews more than your marketing message.
2. Modernize and personalize your marketing.
With the rising popularity of ecommerce, you’re not the only player in town –regardless of what niche your business occupies, you’re probably already facing competition. One-size-fits-all marketing emails and ads aren’t going to resonate with the modern buyer. Targeting your ideal buyers with standard, largely impersonal marketing messages won’t work. You need to make your messages as personal as possible to get their attention.
Look for signals you can use to make your marketing efforts more targeted. For instance, if you know a customer came to your site, put a product in their cart, but left before buying, you have a very strong signal that person is interested in that product. Target them with emails and ads that remind them why your option is the best.
This abandoned cart tactic is low-hanging-fruit and very effective. But it’s just one way of using data to improve your marketing. If you know a customer typically only buys from you during the holidays, make sure you email them with a special offer right before they typically buy to try and increase their purchase size. If a customer recently purchased a product, and you have a complimentary service you think they should know about, target them with ads for the service.
Make sure your ecommerce data and marketing tools are talking to each other — it’s the secret to unlock more powerful, more effectively targeted marketing strategies.
To make that happen, HubSpot now integrates with Shopify. It’s easier than ever for you to sync your data from Shopify into HubSpot, using it to seamlessly personalize your marketing campaigns.
If you’re able to use your web store data for marketing purposes, you can automate these new personalization tactics: abandoned cart nurturing happens automatically soon after someone leaves a cart, and you’re constantly welcoming new customers with a dedicated on-boarding email.
3. Build a brand that Amazon can’t touch.
The online retail giants do a lot right, but the one thing they can’t do is be the single best player in any one given space. They offer everything, which limits them from truly going deep in anyone area. This gives SMBs space to build a brand and be the experts in their niche in a way that differentiates them from the giants.
HubSpot customer and Shopify merchant Kettlebell Kings sells kettlebells, and Amazon also sells kettlebells. But Kettlebell Kings has also built a community — something Amazon simply can’t do for every single category they occupy. Kettlebell Kings are active in the gym scene in their local community of Austin, Texas, offer workout plans, blog posts, videos, and Instagram content on working out with their products that their community loves. They’ve positioned themselves as experts and leaders in the workout and kettlebell space, and their branded product is a signal to their tribe of the companies’ quality and dedication.
They’ve built a memorable, community-driven brand around their product, and people are willing to wait a bit longer and pay a little more for it.
The same goes for HubSpot customer and Shopify merchant Love Your Melon. The company sells hats, and Amazon also sells plenty of hats. But Love Your Melon also stands for something that their audience cares deeply about. The company is dedicated to giving a hat to every child battling cancer in America. It’s something that drives their work, and they’re committed to telling the world about it. Their social media content celebrates the lives of families impacted by cancer, and their distinctive hats have become a product intertwined with a social mission. Their genuine passion isn’t something the giants can recreate.
Both of these companies have fully adopted inbound marketing. They aren’t just trying to get their product in front of people, they’re building a brand that pulls people in. It’s their secret to growth, and it’s applicable to every small ecommerce business today. Inbound marketing works for ecommerce, and it’s how you’ll grow.
Today we’re living in a world defined by giants. But it doesn’t mean there isn’t plenty of room for small, savvy businesses to grow.

And on the Second Day of F8, Facebook Said, ‘Let There Be AI Ethics’
If there’s one thing that Facebook wants everyone to know it’s taking seriously, it’s the topic of ethics.
The general idea of an ethical approach to everything it does — its innovations, initiatives, and new products — is executed with and undercurrent of ethics, user control, and privacy.
That’s what CEO Mark Zuckerberg said in his opening keynote on Day 1 of F8, Facebook’s annual developer conference. The new products and features unveiled yesterday, including its up-and-coming Facebook-for-dating services, was built “with privacy and safety in mind.“
Today, ethics was one topic that took center stage, especially when it comes to Facebook’s highly-boasted investment in AI to help combat things like hate speech and other moderation activity on the site. Here’s what company executives had to say.
Ethics and AI Take Center Stage on F8 Day 2
While it’s nice to know that your friends won’t see if you’re using Facebook’s dating services and you won’t be matched with them, according to yesterday’s keynote, the privacy and ethical specifics weren’t revealed in much data, and actually left great room for interpretation.
the dating app sounds like has some awfully handy functionality for stalkers .. why is there no one in the right place in FB to point out obvious probs like this? must be folks who can see potential problems (surely?) is it the internal comm process that’s gone awry?
— eleanorina (@_eleanorina)
May 2, 2018
Today, the company chose to elaborate a bit on its efforts in the “ethical” arena.
AI Ethics
When Zuckerberg appeared before Congress in April, one initiative he repeatedly emphasized throughout his testimony was the advances Facebook has made in the realm of artificial intelligence (AI) and how it can be used to combat the misuse and weaponization of the network.
But one area where it would be difficult to perfect that technology is detecting hate speech. The AI has a long way to go, he said — though he didn’t go into tremendous detail on the company’s plans to improve it.
Some problems “lend themselves to AI tools more than others. Hate speech is one of the toughest. … Contrast that with an area of something like battling terrorist propaganda,” says Zuckerberg, listing the times Facebook has successfully done the latter.
— Amanda Zantal-Wiener (@Amanda_ZW)
April 10, 2018
Today, Facebook Director of Machine Learning and AI Srinivas Narayanan acknowledged that, displaying cases where a machine might not understand the nuance of what might make a given sentence hateful or abusive. Using examples like, “Look at that pig” and “I’m going to beat you,” he said that understanding the context of such statements requires human review.
More from Srinivas Narayanan about the nuances of hate speech and how AI isn’t enough detect context. That requires human review, he says. #F8 pic.twitter.com/kuPkUR1MYc
— Amanda Zantal-Wiener (@Amanda_ZW)
May 2, 2018
The Fairness Flow
Which is where the area of focus known as AI ethics comes in, said Facebook Data Scientist Isabel Kloumann. Humans, she pointed out, have implicit biases — using herself as an example, she said most people in the audience would deduce that she is a white female. What they might not consider, she noted, is that she’s part Venezuelan, for instance.
And since machines are trained using the data given to them by humans, AI might learn to have these same biases, Kloumann said, which introduces the need for ethics and standards when it comes to building it.
That’s why Facebook created the Fairness Flow, which is to help determine how much bias has been built into Facebook’s algorithm, whether intentional or not. There’s a need now, Kloumann said, to ensure that the company’s AI is “fair and unbiased,” especially since the company has come under especially intense scrutiny over what content it deems in violation of its standards.
But we have implicit biases, says Isabel Klouman, and so do the machines that learn from the data it’s trained with. So there’s a need for “AI Ethics,” and thinking about how to create “fair and unbiased AI” #F8 pic.twitter.com/npuRDmXg5l
— Amanda Zantal-Wiener (@Amanda_ZW)
May 2, 2018
At the April hearings, for instance, many lawmakers accused Facebook of improperly moderating content, allowing some that could have severe impacts — like ads for narcotics, for instance — to remain live for far too long, while other content might be improperly deemed in violation.
Not long after Zuckerberg’s testimony, The New York Times profiled the way this imbalance has manifested in grave violence in Sri Lanka.
A reconstruction of Sri Lanka’s 2017 descent into violence found that Facebook’s newsfeed played a central role in nearly every step from rumor to killing. Facebook declined to respond in detail to questions about its role in the violence. https://t.co/IaA9EGJEIy pic.twitter.com/jPkw3RcOXZ
— The New York Times (@nytimes)
April 21, 2018
But Is It Enough?
But overall, Facebook has many (potentially PR-related) reasons to place the concept of ethics at the center of its messaging. The company came under fire in March when it was revealed that data analytics and voter profiling firm Cambridge Analytica — which it was today announced will be shut down by its parent company, SCL, as well as SCL Elections Ltd. — improperly obtained and used personal user data.
It would appear that, in addition to the questions and accusations mentioned above, people still don’t entirely trust the network in terms of protecting their data and privacy. And after Zuckerberg’s Congressional hearings, it seems, our survey of 300 trust in the company actually fell.
And among those who paid attention to them, the remarks made at F8 thus far had a mixed impact on overall trust in Facebook. In a HubSpot survey of 303 U.S. internet users, just under a third said they trust the company less, while roughly one-fifth of respondents said the keynotes improved their trust in the company.
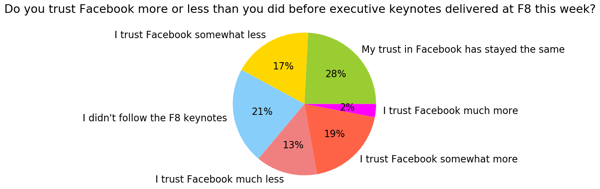
That has yet to show up financially, however — and as of the NASDAQ closing bell today, Facebook’s stock price was strong.
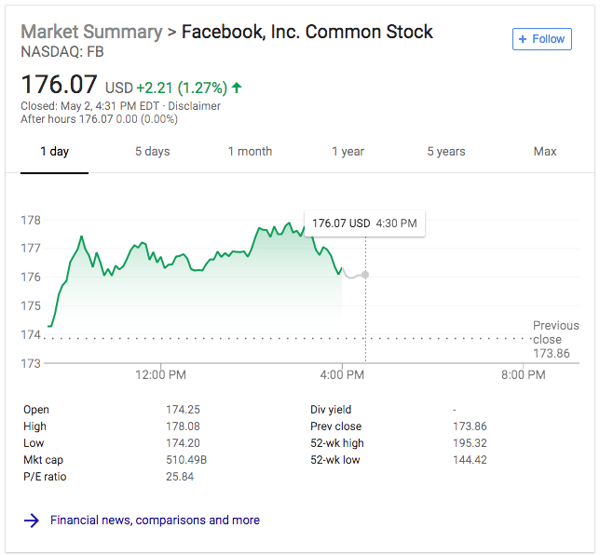
Source: Google
How all of this plays out in the long-term remains to be seen. But the stark contrast between last year’s F8 — when Facebook announced innovative progress in the area of reading people’s minds through their skin — and this year’s event is evident.
The type of pressure and scrutiny faced by the social network continues to evolve, as well. Despite reporting strong Q1 2018 earnings, UK Parliament still demands testimony from Zuckerberg — and recently stated that if he does not appear before members of parliament for questioning during his next visit to the UK, he shouldn’t enter the region at all.
And as for the ethics — that seems like it will be a slow, gradual road to fruition, if that’s the conclusion that actually takes form.
