The 5 Best Free Email Accounts for 2018
You need it for networking, job recruitment, downloading resources, transferring files, setting reminders, meeting with colleagues, and so much more.
Even with the rise of office chat platforms, you still depend on email for a surprising number of things. But unfortunately, not every email service is completely free to use. And even the free ones might not be the easiest to use or have all the features you need.
It can be a challenge to find an email client at no cost that balances the right features with usability. To help make your search easier, we put together a list of the five best free email accounts you can sign up for right now — as well as a few services we gave honorable mention. For each email client, we highlighted a unique feature in to help you find the best fit.
Best Free Email Accounts
- Gmail
- AOL
- Outlook
- Zoho
- Mail.com
- Yahoo! Mail
- ProtonMail
1. Gmail
Unique Feature: Native File Collaboration
Sign up here.
Who should use it: Anyone who already uses and loves the rest of Google’s products.
It might seem like an obvious top pick, but Gmail is just too versatile to not award the first slot. Gmail has the second-highest email client market share (behind Apple iPhone’s native email app), according to Litmus Labs. And ironically, one of the reasons Gmail has become so popular is because of all the communication options in your inbox that don’t involve email.
Gmail is an everyday email inbox you can sign up for by registering for a Google account. But it’s built into Google Suite, a group of free apps that allow you to chat, video-conference, and share files with the people in your contact list.
Google Hangouts, available from your inbox’s left sidebar (or the right — you can customize how you inbox is displayed), lets you text and video chat with other Gmail users for the things that might not warrant an email message. Like most other email clients today, Gmail also has an intuitive calendar where you can set meetings and reminders.
Unlike other email accounts, you can use your Gmail address to log into and manage your YouTube account, as well as collaborate on shared documents and spreadsheets right from a cloud-based Google Drive.
Offering a generous 15 GB of free email storage, Gmail does everything it can to make your inbox less chaotic, including advanced filters that automatically push emails into separate folders as they arrive. And none of these functions costs a dime.
2. AOL
Unique Feature: Unlimited Storage
Sign up here.
America Online (I feel nostalgic just typing those words) has quietly kept up with today’s standards for a good user experience. The classic AOL is now once again one of the best free email accounts available to you.
Purchased by Verizon in 2015, AOL delivers you email from its classic news-driven homepage, and comes with the contemporary spam filters and virus protection you’d expect from your email provider. You can also send text and instant messages from specific windows in your email inbox.
AOL does have something over Gmail, though: unlimited storage. Additionally, you can import email contacts from a CSV, TXT, or LDIF file so you’re not creating your “buddy list” (get it?) from scratch.
3. Outlook
Unique Feature: Multiple App Integrations
Sign up here.
If you ever cringed at the sight of a “Hotmail.com” email address, you can thank Outlook for this outdated domain name. But there’s good news: Microsoft has reinvented its longstanding email service, and your free Outlook.com email address has many progressive features waiting for you.
While it touts a calendar and message filter that is similar to Gmail, Outlook also integrates with a number of other popular communication apps. You can connect Skype, Facebook, PowerPoint, PayPal, and even task-management software such as Trello — making it very easy to reach and work with non-Outlook users without leaving your inbox.
Outlook offers 15 GB of free storage for each user, along with a super-clean interface.
4. Zoho
Unique Feature: 25 Business Addresses
Sign up here.
This is the first of the lesser-known free email accounts to make our list, but it holds a lot of potential for businesses.
The first thing you’ll notice about Zoho is its user-friendliness. From integrating with Google Drive, Box, and other cloud-based file managers, to its built-in task manager, this email service offers a simple way to accomplish all of your daily tasks.
The real difference-maker, though, is the ability to customize the domain name for up to 25 connected email addresses. Want to replace “@zoho.com” with the name of your business’s website? You can do so under Zoho Lite, which gives you 5 GB for free — all under username@yourdomainname.com.
5. Mail.com
Unique Feature: 200 Custom Domain Names
Sign up here.
It doesn’t get more self-explanatory than “Mail.com,” does it? This email client knows its audience — or should I say, audiences.
Right off the bat, you’ll probably notice Mail.com doesn’t have stellar storage space compared to the options above: only 2 GB. But what this email client lacks in gigabytes it makes up for with … drumroll … 200 free custom domain names. You can replace “@mail.com” at the end of your username with just about anything that describes you. Here are some options Mail.com has precreated for you to choose from:
- Bartender.net
- Musician.org
- Columnist.com
- Engineer.com
- Accountant.com
- Toothfairy.com (who knew she was online?)
Mail.com doesn’t rest on its 200 laurels, though, as the email provider also comes with a calendar for creating and tracking your events each week.
Honorable Mention
These five email services may be the most unique freemium services in the email world, but they’re not the only ones that impressed us.
Yahoo! Mail, another well-known platform, sits just behind AOL in storage space with a whopping 1 TB (that’s a terabyte) for free, along with a few key social media integrations. ProtonMail offers just 500 MB of free space but for the worthy trade of encrypted email, allowing you to send messages that nobody else can see, and disappear after a month.
And with that, you have some of the best options for free email accounts in 2018. But who knows? Your next email address could be entirely different while giving you just what you need to succeed.

5 Strategies to Monetize a Blog
Whether you’re running a personal blog as a hobby, or managing the official blog on your company’s website, monetizing your work is entirely possible — it just takes a good amount of time and effort.
While there’s no exact formula to start making money, there are some tried and true strategies you can start experimenting with to see what works best for your content, your business model, and your audience. Below, we’ll dive into each of these monetization ideas:
How to Monetize a Blog: 5 Strategies
1. Build an lead funnel for your product.
If you work at a B2B company or have a long sales cycle, reading a blog post is usually a customer’s first and furthest interaction from their actual purchase. But it’s also arguably the most important stage of the inbound funnel. Attracting your audience’s attention with helpful, educational, or entertaining content creates a larger pool of people to convert into leads and close as customers. In other words, your blog marks the start of a relationship with your customers.
Ideally, you’ll want to craft compelling blog content that your audience can discover easily through a Google search or social media. You can also pay to amplify your distribution on Facebook, which has the best targeting tools out of all the social media sites and is cost effective, or through paid search, which can thrust you to the top of a high-volume Google SERP, although some keywords are expensive.
After people start reading your blog content more, and want to read it on consistent basis, they’ll sign up for your blog’s email subscription. Once strangers to your brand, they’re now regular visitors.
When these visitors read enough blog posts, you can entice them to download eBooks, tools, and calculators that will turn them into leads. You can attach these lead generators to blog posts, email them to your blog subscribers, or send them through Facebook ads using cookie-based retargeting.
You can then nurture qualified leads with more blog posts and lead generators through email or Facebook ads. Consistently educating them and helping them solve their problems will build their trust, making it more likely they’ll move to the middle of your funnel when they’re ready. And once you see them researching your product or service by reading case studies, requesting a demo, or trying to contact sales, you can move them to the bottom of the funnel, where sales will qualify their fit as a customer.
Sales will close some of these leads into customers, and they’ll be thanking you when they do. Your blog introduced their customers to your brand.
2. Offer sponsored content opportunities to other brands.
Publishers like BuzzFeed and The Dodo produce content that floods social media almost every day. And they make money by helping other brands do it too.
Brands will collaborate with their video production, social media, and analytics teams to craft posts and videos that follow their formula for virality. Publishers also distribute this sponsored content to their massive social media and website followings. This content is similar to the publishers’ native content, so their audience will enjoy reading it, exposing their clients to a huge, engaged, and new viewership and boosting their followings and audience engagement.
If your blog generates a significant amount of traffic, you can leverage your editorial expertise and audience reach to help smaller brands tell captivating stories to a bigger and better viewership.
Doing sponsored content right can pay huge dividends for your brand. Not only does it create another revenue stream, but partnering with other marketing minds can help your team unleash unprecedented amounts of creativity. In fact, T Brand Studio, the New York Times native ad business, crafted paid posts that captured as much engagement as some of nytimes.com’s highest-performing articles.
3. Offer coaching services.
Your blog posts can serve as a teaser for how much your readers can learn about a certain subject matter. Because if you write about enhancing certain skills like selling, social savviness, sports, cooking, and music, your blog posts can only teach your readers so much. They need to practice these skills in real life to see substantial improvement.
But if your readers practice these skills on their own, they’ll only get so much better. If they really want to improve, training with a coach will guide them toward success faster than anything else. Think about it. What would improve your basketball skills the most? Reading Michael Jordan’s book about shooting and practicing his tips by yourself? Or reading his book and then taking shooting lessons with him?
As a coach, your blog is your most important marketing asset. It helps your potential clients improve themselves while giving them a glimpse into what life would be like if they actually achieved one of their life-long goals. Your blog inspires readers to strive for their dreams. And when they’re more motivated to reach their potential, they’ll usually want an expert directing them toward greatness, not just themselves.
4. Market your freelance writing skills.
As a freelance blogger, you need to show potential clients that you can write compelling content. To do this, you could try to attract their attention with your previous work, but you usually don’t have control over those topics. So what if they don’t pique their interest?
The best way to show potential clients you can write compelling content is by engaging them with your own content. When you start a blog, you have access to your post’s performance metrics and complete control over the topics you cover. This allows you to write content that you know your target audience will devour, attracting more and more potential clients to your blog. And once they realize they rely on you for content marketing advice, they’ll know they can trust you to help them improve their own content marketing.
For instance, Eddie Shleyner, a freelance copywriter and content marketer, markets his business called VeryGoodCopy by writing articles about copywriting, content marketing, and psychology. His articles are so engaging and insightful that organizations like The North Face, Geico, and Mercedes Benz hire him to write articles, eBooks, landing pages, website copy, and email campaigns.
5. Market affiliate products.
Affiliate marketing is one of the best ways to monetize a blog when you don’t sell a product or service. It’s a relatively simple process too. You’ll partner with an eCommerce platform or businesses that have affiliate programs and pick out relevant products to promote on your blog. Your partners will then send you custom links to their product pages that can track customers referred by your blog. And if someone clicks on the link and buys the product, you’ll earn a commission.
One of the most popular affiliate marketing programs is Amazon Associates. You can choose from over one million of Amazon’s eCommerce products to advertise on your blog, and you can earn up to 10% in commission.
Out of all the ways you can make money blogging, affiliate marketing requires the least amount of time, money, and resources. You don’t have to build, market, or sell a product or service and inserting affiliate links in your blog posts doesn’t cost any money. All you have to do is wait for people to click on them and buy something.

International SEO: How to Optimize Your Website for Other Countries
If your website is focused on a global audience, you’ve probably spent some time thinking about the best ways to organize and optimize your site for different countries.
There are several important decisions you need to make when bringing your content to an international audience. Determining which domain structure you need is key, but there are a few best practices to keep in mind when using one — especially if your content is published in a different language.
Below, we’ll dive into your domain structure options, explain how Google interprets these structures, and cover some original research and tips on making the best use of international SEO.

Types of Domain Structure
There are essentially three choices for setting up your international domain architecture:
1. A Country Subdirectory After the gTLD
If your domain is domain.com, you would add a folder called domain.com/german/ to target German language speakers or domain.com/uk/ to target U.K. users.
This is called the subdirectory, and it follows the “.com” (or “.org,” “.net,” etc.) generic top-level domain — also known as the gTLD. You can also use them for more than just country notation; as you can see, we have a subdirectory that indicates you’re on the “/marketing/” blog.
One thing to note on any targeting that you are doing in URLs: you must use each country’s vernacular in order for the search engines to understand the meaning of the string. For example, “the U.K.,” “uk,” “England,” and “G.B.” are all acceptable while “UnitedK” or “GrBr” would not be.
2. A Country Subdomain Before the gTLD
While a subdirectory implementation can be an easy and inexpensive option, however, it can be difficult for people to understand the location targeting from the URL alone.
This brings us to your section option: subdomains. For example, a U.K. targeted subdomain might be uk.domain.com while a Spanish language subdomain would be es.domain.com.
Subdomains are usually fairly easy to implement, but, like subdirectories, can make it difficult for people to understand what content will appear at that URL. They also can be more expensive to implement when compared to a folder structure.
3. A Country Code Top-Level Domain (ccTLD) to Replace the gTLD
In this option, Canadian site would be domain.ca and a Mexican site would be domain.mx — replacing the “.com” gTLD completely.
This architecture can be the most complex and expensive to implement, as you would need to have a domain for every focus country. In addition, while a .com domain can be purchased for around $10, there are some TLDs that can cost more than $1,000 and require that you have a local presence in the country.
We’ll elaborate on this trickier option in just a moment.
Using Them in Your International SEO Strategy
If you’re translating content that already exists in a different language and on a different subdirectory or subdomain, rest assured Google won’t flag your website for duplicate content. Google knows what you’re doing, and will let you do it!
Duplicate content is also not penalized by most search engines — rather, it’s filtered. This means if you’ve published an article in two different languages, both will rank in results for each international reader.
So, here’s what to keep in mind when pursuing one of the above three URL structures:
You’ll Need Multilingual SEO Meta Tags
Because subdirectories and subdomains don’t completely separate country-specific websites from one another — in the eyes of readers and Google — it’s important to use meta tags as well.
Meta tags are the lines in the HTML of a given web page that give Google the proper context when crawling that page. Headers, keywords, and other elements of article structure are some important ones. But language is one of your best multilingual SEO maneuvers.
In HTML, the language meta tag for English looks like this: <html lang=”en”>. This tag surrounds all the text that is written in that language, helping Google understand what it’s reading and whom it’s for. Learn more about how to incorporate meta tags here.
Meta tags should resemble both the country and language abbreviation listed in your subdirectory or subdomain. For example, if your Mexican subdomain is mx.domain.com, the meta tags you add to each blog post belonging to this subdomain will be <html lang=”es-MX> in order to designate your web page as meant for Spanish speakers in Mexico. Find your country’s and language’s HTML meta tag here.
This gives Google another layer of data when crawling republished content for search engine results pages (SERPs) you’d see in other countries.
ccTLD Domains Are Valuable, But a Big Commitment
The pitfall of using ccTLD domains is that Google won’t transfer the page authority from your original domain to this translated one. Although, regaining that organic power can happen fairly quickly if you optimize your content well in other ways.
Subdirectories and subdomains with the same TLD, on the other hand, receive SEO credit from Google much more naturally.
Google also clearly states that it uses ccTLD to determine country targeting. So, if you have the financial and technical resources, using a ccTLD could be a good idea.
But, a ccTLD can be expensive and the complexity of the setup could create some costly mistakes, so many webmasters will only take the ccTLD plunge if there is a positive impact on their bottom line.
In that case, there would either have to be an extremely significant shift in search rankings where ccTLDs are rewarded (which Google has not reported), or a ccTLD would have to be favored by users in a way that meaningfully impacts clickthroughs to a website.
How People See Your Domain
Since there is no better way to predict user behavior than just asking users what they prefer, I decided to launch a survey on SurveyMonkey’s Audience tool, which collects data from a pool of millions of respondents across the United States, Australia, and the U.K.
Respondents are selected at random, and because the sample is statistically significant, the sample should mirror actual user behavior pretty closely — this type of survey was even used to correctly predict election results in 2012, 2013, and 2014.
For this survey, I collaborated with Sam Mallikarjunan, Executive Strategist at HubSpot, to craft and analyze the surveys. We created two nearly identical surveys: one targeted to a representative sample in the U.S. and one to a representative sample in Australia.
Here’s what we found:
User Awareness of ccTLD
Before trying to understand how users related to ccTLDs, we needed to validate the assumption that users even know that general TLDs exist. For all we know, marketers may be overly concerned with whether their domain is a .com, .info or even .com.mx, but user might not even notice.
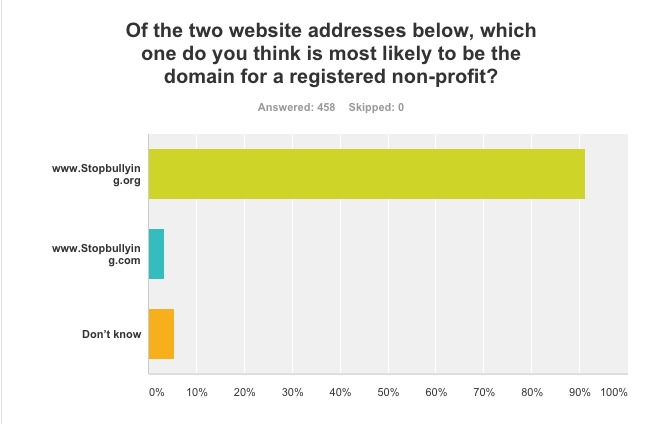
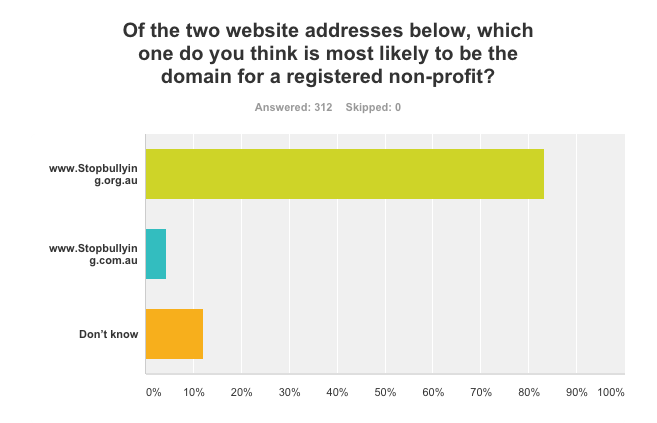
To establish this foundation, we asked respondents to pick which TLD might be the one in use by a nonprofit. Nearly all respondents correctly identified a TLD ending with .org as the one most likely to be used by a nonprofit. Interestingly, only 4% of people in the U.S. stated that they were unsure of the correct TLD compared to 13% of Australians.
U.S. Responses
Australian Responses
To build on this awareness of ccTLD, we wanted to know if users made the connection between ccTLD and countries. We asked respondents to identify the location of a local business using a .ca TLD extension. The majority of respondents correctly chose Canada.
Oddly, 67% of Australians chose the correct answer while only 62% of Americans did the same. Additionally, more Americans (23%) fell for the trick answer of California than Australians (15%).
Based on the previous results, it is apparent that users are aware of ccTLDs in domain addresses and also usually understand the connection to local countries. But without knowing if users make decisions based on TLDs, a country’s TLD could just be a vanity portion of a URL and certainly not worth the investment.
Therefore, the real test of TLD choice is how it impacts ROI. This type of data point is, of course, hard to gauge in a survey where customers are not actually buying products, but we did want to try to see if there might be a way to measure purchasing decisions, too.
Revenue Impact of ccTLD
To achieve this result, we compared two different online retailers and asked respondents to choose the establishment that they thought would have the most reliable express shipping. It was assumed that respondents would consider an in-country retailer to be able to ship products faster than an international store.
In the U.S. survey, we compared Amazon.co.jp to BestBuy.com. In the Australian survey, we compared Bigw.com.au, a well-known brick and mortar retailer similar to the U.S. Target.com. (Interesting fact: There is a Target in Australia that is not affiliated with Target in the U.S. and their website is target.com.au — more on that later.)
The intent of the question was to see if users zeroed in on the recognizable brand name or the domain extension.
U.S. Responses
Australian Responses
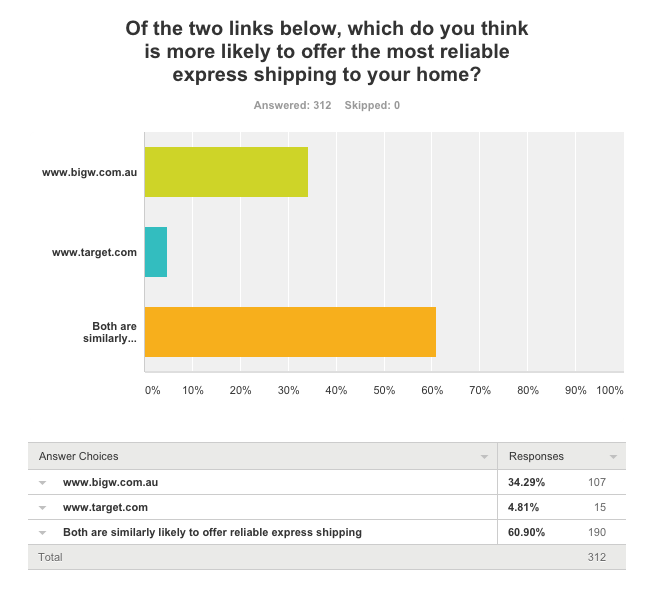
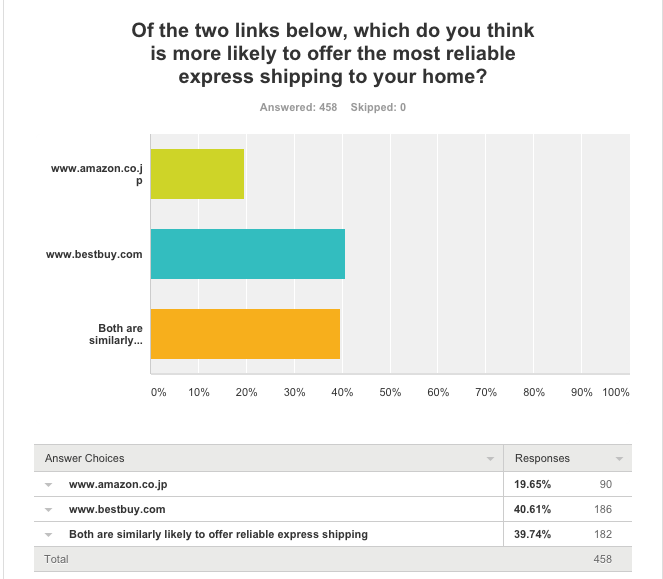
In the U.S., while 39% said that both websites would offer reliable shipping — meaning that both TLDs have the potential to ship from the U.S. — 42% still said that Best Buy with a .com TLD would be the better option. Australians may have been confused by the incorrect Target website, since 61% said both websites would have reliable shipping, but 34% chose Big W.
The data in this question is a bit inconclusive, but we can say that while a large portion of users are blind to domain extensions, it would still be better to use a familiar domain extension when selling online.
What Should You Do?
To answer the original question, if you lack the resources to craft a ccTLD architecture, what should you do?
It depends. Based on the data we collected, we can definitively declare that users are aware of the differences between TLDs and do make decisions based on TLDs; however, the jury is still out on how important a TLD really is.
A good place to start is to list your business in country-specific directories. This will help that portion of your site or that country domain generate quality inbound links back your website — boosting page authority if you’re trying to build it back up for a new domain.
Use Google Local and do some research to find popular website and blog directories that’d be worth broadcasting your new site from. Generating more than 80% of inbound links from French users and directories to your domain (whether http://fr.domain.com or http://www.domain.fr) will let search engines know that French-based traffic should be funneled there appropriately.
If you’re debating whether ccTLD is the right choice for your site, it might be a good idea to launch a test on AdWords using a ccTLD as your display URL and measure whether there is any change in CTR. Alternatively, you can deploy a survey to your own customers and just ask if they are more likely to buy from a local domain.
Nonetheless, if you do have the budget and development time to create ccTLDs, you certainly can’t go wrong with it. Good luck!


Data Visualization 101: How to Choose the Right Chart or Graph for Your Data
Types of Charts to Use for Your Data
- Column Chart
- Bar Graph
- Line Graph
- Dual Axis Chart
- Area Chart
- Stacked Bar Graph
- Mekko Chart
- Pie Chart
- Scatter Plot Chart
- Bubble Chart
- Waterfall Chart
- Funnel Chart
- Bullet Chart
- Heat Map
You and I sift through a lot of data for our jobs. Data about website performance, sales performance, product adoption, customer service, marketing campaign results … the list goes on.
When you manage multiple content assets, such as social media or a blog, with multiple sources of data, it can get overwhelming.What should you be tracking? What actually matters? How do you visualize and analyze the data so you can extract insights and actionable information?
More importantly, how can you make reporting more efficient when you’re busy working on multiple projects at once?

One of the struggles that slows down my own reporting and analysis is understanding what types of graphs to use — and why. That’s because choosing the wrong visual aid or simply defaulting to the most common type of data visualization could cause confusion with the viewer or lead to mistaken data interpretation.
To create charts that clarify and provide the right canvas for analysis, you should first understand the reasons why you might need a chart. In this post, I’ll cover five questions to ask yourself when choosing a chart for your data.
Then, I’ll give an overview of 14 different types of charts you have at your disposal.
5 Questions to Ask When Deciding Which Type of Chart to Use
1. Do you want to compare values?
Charts are perfect for comparing one or many value sets, and they can easily show the low and high values in the data sets. To create a comparison chart, use these types of graphs:
- Column
- Mekko
- Bar
- Pie
- Line
- Scatter Plot
- Bullet
2. Do you want to show the composition of something?
Use this type of chart to show how individual parts make up the whole of something, such as the device type used for mobile visitors to your website or total sales broken down by sales rep.
To show composition, use these charts:
- Pie
- Stacked Bar
- Mekko
- Stacked Column
- Area
- Waterfall
3. Do you want to understand the distribution of your data?
Distribution charts help you to understand outliers, the normal tendency, and the range of information in your values.
Use these charts to show distribution:
- Scatter Plot
- Mekko
- Line
- Column
- Bar
4. Are you interested in analyzing trends in your data set?
If you want to know more information about how a data set performed during a specific time period, there are specific chart types that do extremely well.
You should choose a:
- Line
- Dual-Axis Line
- Column
5. Do you want to better understand the relationship between value sets?
Relationship charts are suited to showing how one variable relates to one or numerous different variables. You could use this to show how something positively effects, has no effect, or negatively effects another variable.
When trying to establish the relationship between things, use these charts:
- Scatter Plot
- Bubble
- Line
14 Different Types of Graphs and Charts for Presenting Data
To better understand each chart and how they can be used, here’s an overview of each type of chart.
1. Column Chart
A column chart is used to show a comparison among different items, or it can show a comparison of items over time. You could use this format to see the revenue per landing page or customers by close date.
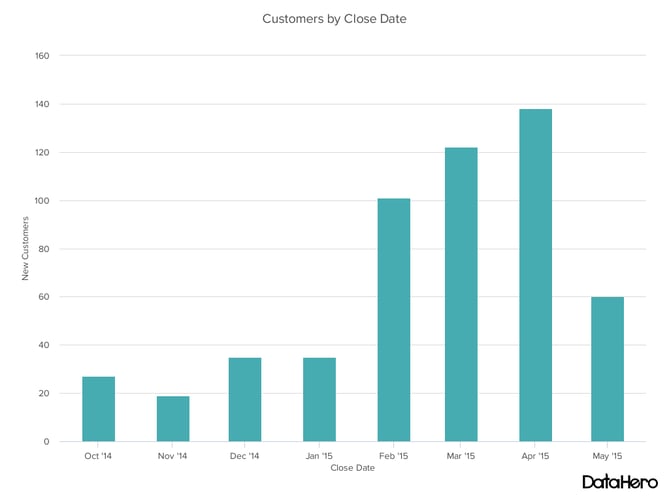
Design Best Practices for Column Charts:
- Use consistent colors throughout the chart, selecting accent colors to highlight meaningful data points or changes over time.
- Use horizontal labels to improve readability.
- Start the y-axis at 0 to appropriately reflect the values in your graph.
2. Bar Graph
A bar graph, basically a horizontal column chart, should be used to avoid clutter when one data label is long or if you have more than 10 items to compare. This type of visualization can also be used to display negative numbers.
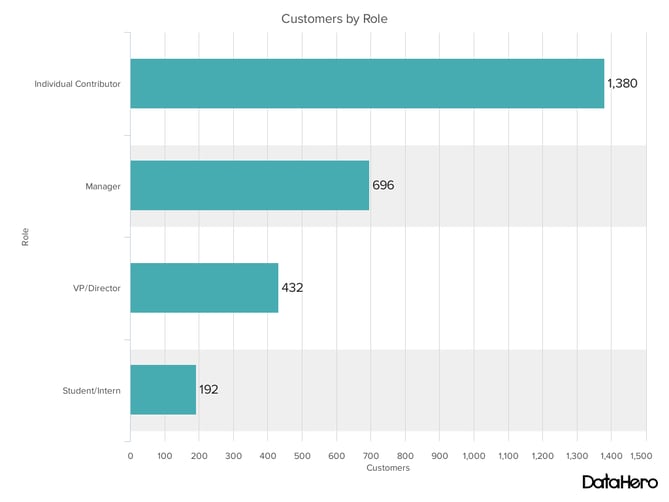
Design Best Practices for Bar Graphs:
- Use consistent colors throughout the chart, selecting accent colors to highlight meaningful data points or changes over time.
- Use horizontal labels to improve readability.
- Start the y-axis at 0 to appropriately reflect the values in your graph.
3. Line Graph
A line graph reveals trends or progress over time and can be used to show many different categories of data. You should use it when you chart a continuous data set.
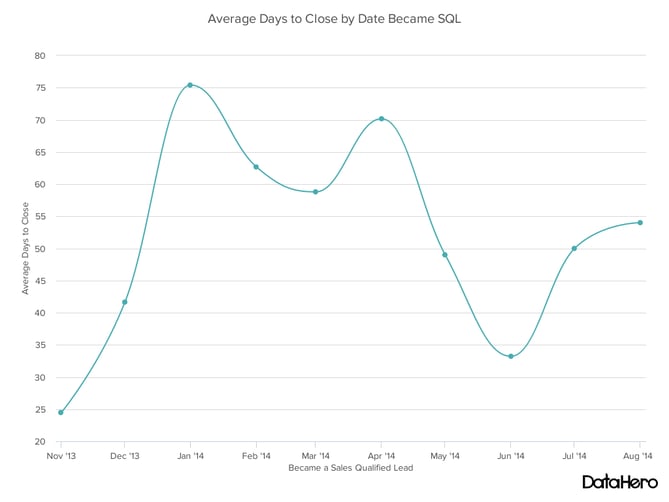
Design Best Practices for Line Graphs:
- Use solid lines only.
- Don’t plot more than four lines to avoid visual distractions.
- Use the right height so the lines take up roughly 2/3 of the y-axis’ height.
4. Dual Axis Chart
A dual axis chart allows you to plot data using two y-axes and a shared x-axis. It’s used with three data sets, one of which is based on a continuous set of data and another which is better suited to being grouped by category. This should be used to visualize a correlation or the lack thereof between these three data sets.
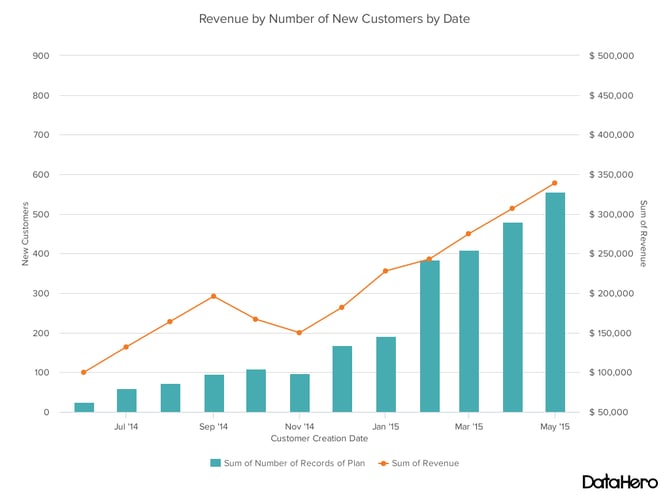
Design Best Practices for Dual Axis Charts:
- Use the y-axis on the left side for the primary variable because brains are naturally inclined to look left first.
- Use different graphing styles to illustrate the two data sets, as illustrated above.
- Choose contrasting colors for the two data sets.
5. Area Chart
An area chart is basically a line chart, but the space between the x-axis and the line is filled with a color or pattern. It is useful for showing part-to-whole relations, such as showing individual sales reps’ contribution to total sales for a year. It helps you analyze both overall and individual trend information.
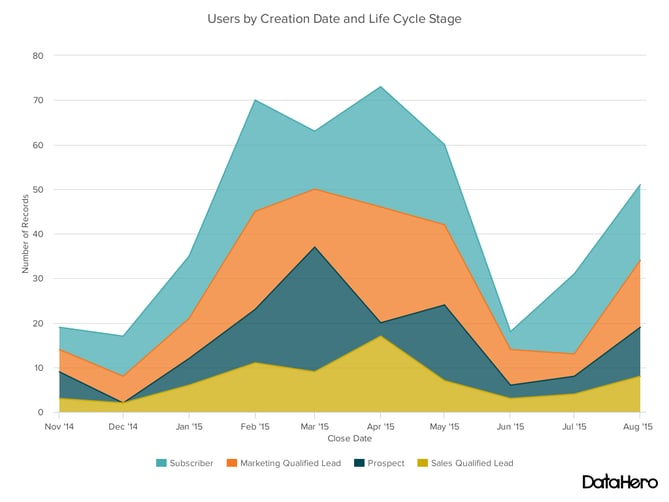
Design Best Practices for Area Charts:
- Use transparent colors so information isn’t obscured in the background.
- Don’t display more than four categories to avoid clutter.
- Organize highly variable data at the top of the chart to make it easy to read.
6. Stacked Bar Chart
This should be used to compare many different items and show the composition of each item being compared.
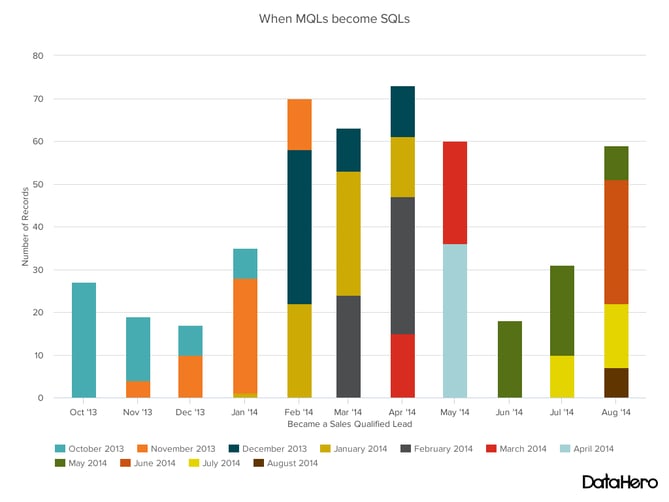
Design Best Practices for Stacked Bar Graphs:
- Best used to illustrate part-to-whole relationships.
- Use contrasting colors for greater clarity.
- Make chart scale large enough to view group sizes in relation to one another.
7. Mekko Chart
Also known as a marimekko chart, this type of graph can compare values, measure each one’s composition, and show how your data is distributed across each one.
It’s similar to a stacked bar, except the mekko’s x-axis is used to capture another dimension of your values — rather than time progression, like column charts often do. In the graphic below, the x-axis compares each city to one another.
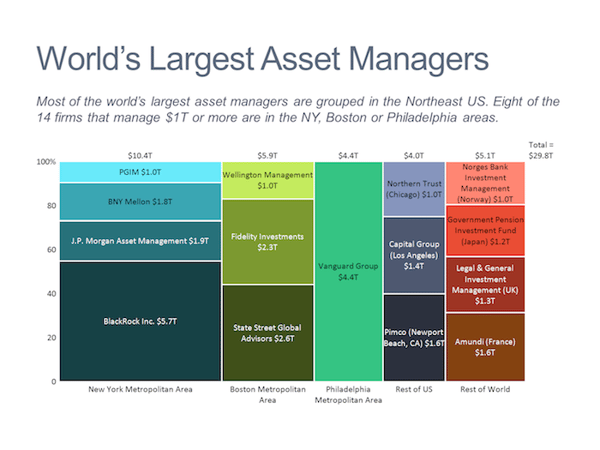
Image via Mekko Graphics
Design Best Practices for Mekko Charts:
- Vary you bar heights if the portion size is an important point of comparison.
- Don’t include too many composite values within each bar. you might want to reevaluate how to present your data if you have a lot.
- Order your bars from left to right in such a way that exposes a relevant trend or message.
8. Pie Chart
A pie chart shows a static number and how categories represent part of a whole — the composition of something. A pie chart represents numbers in percentages, and the total sum of all segments needs to equal 100%.
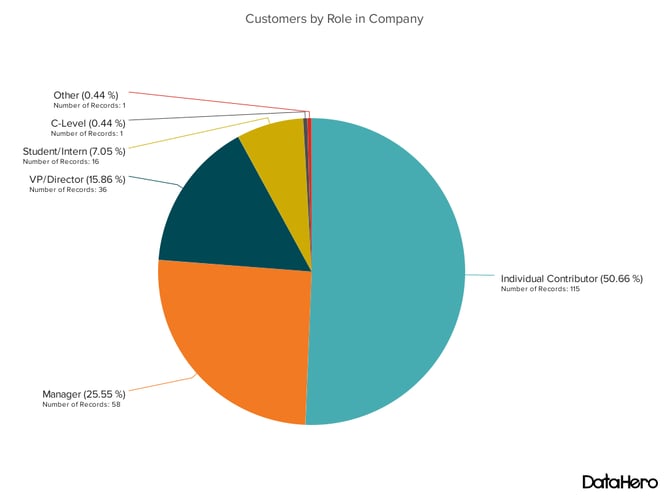
Design Best Practices for Pie Charts:
- Don’t illustrate too many categories to ensure differentiation between slices.
- Ensure that the slice values add up to 100%.
- Order slices according to their size.
9. Scatter Plot Chart
A scatter plot or scattergram chart will show the relationship between two different variables or it can reveal the distribution trends. It should be used when there are many different data points, and you want to highlight similarities in the data set. This is useful when looking for outliers or for understanding the distribution of your data.
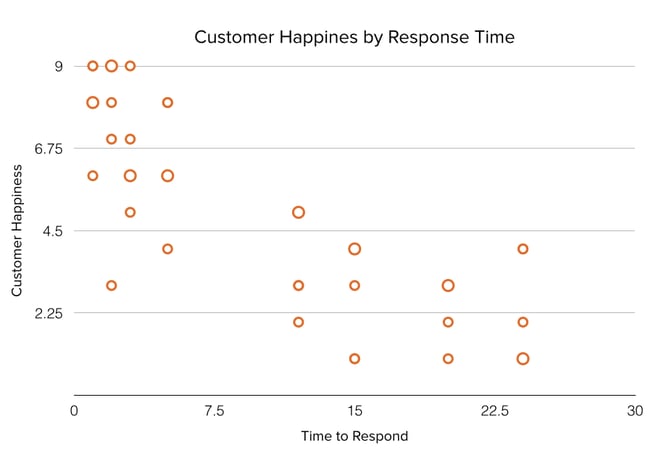
Design Best Practices for Scatter Plots:
- Include more variables, such as different sizes, to incorporate more data.
- Start y-axis at 0 to represent data accurately.
- If you use trend lines, only use a maximum of two to make your plot easy to understand.
10. Bubble Chart
A bubble chart is similar to a scatter plot in that it can show distribution or relationship. There is a third data set, which is indicated by the size of the bubble or circle.
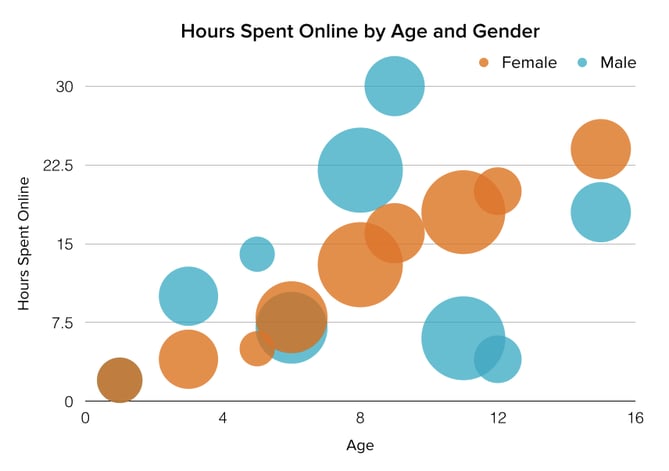
Design Best Practices for Bubble Charts:
- Scale bubbles according to area, not diameter.
- Make sure labels are clear and visible.
- Use circular shapes only.
11. Waterfall Chart
A waterfall chart should be used to show how an initial value is affected by intermediate values — either positive or negative — and resulted in a final value. This should be used to reveal the composition of a number. An example of this would be to showcase how overall company revenue is influenced by different departments and leads to a specific profit number.
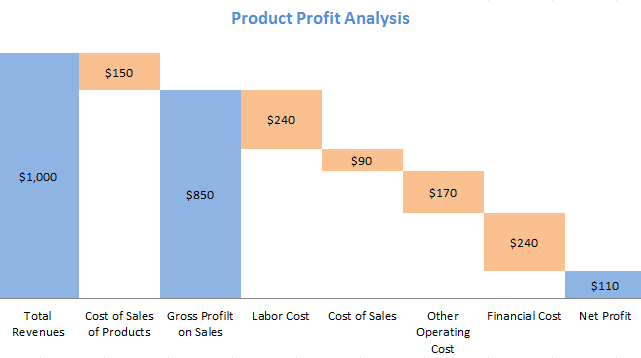
Chart via Baans Consulting
Design Best Practices for Waterfall Charts:
- Use contrasting colors to highlight differences in data sets.
- Choose warm colors to indicate increases and cool colors to indicate decreases.
12. Funnel Chart
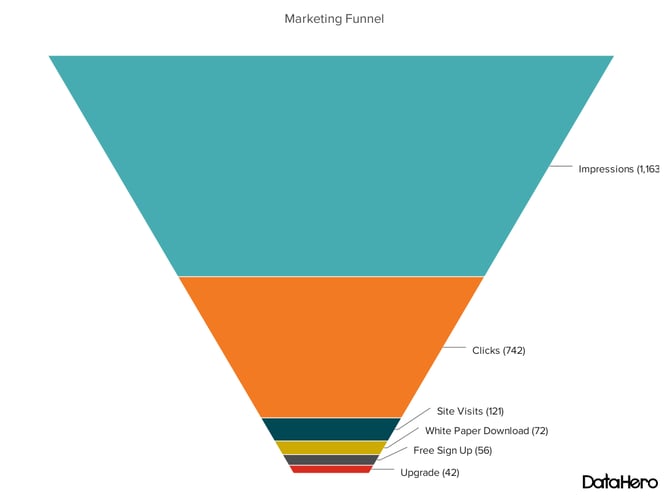
A funnel chart shows a series of steps and the completion rate for each step. This can be used to track the sales process or the conversion rate across a series of pages or steps.
Design Best Practices for Funnel Charts:
- Scale the size of each section to accurately reflect the size of the data set.
- Use contrasting colors or one color in gradating hues, from darkest to lightest as the size of the funnel decreases.
13. Bullet Graph
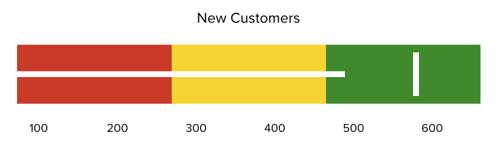
A bullet graph reveals progress toward a goal, compares this to another measure, and provides context in the form of a rating or performance.
Design Best Practices for Bullet Graphs:
- Use contrasting colors to highlight how the data is progressing.
- Use one color in different shades to gauge progress.
14. Heat Map
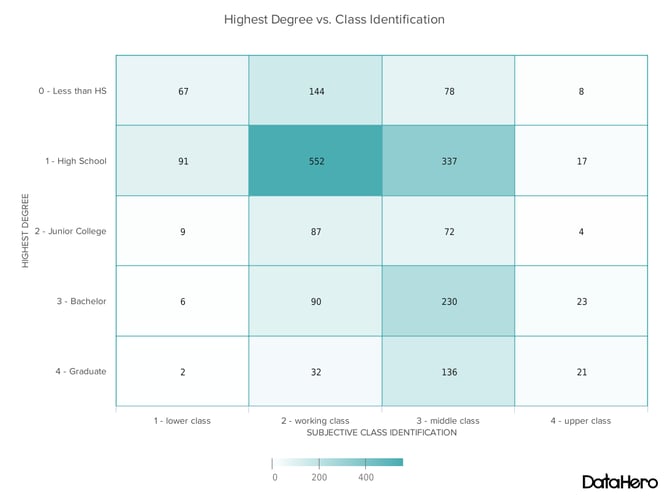
A heat map shows the relationship between two items and provides rating information, such as high to low or poor to excellent. The rating information is displayed using varying colors or saturation.
Design Best Practices for Heat Map:
- Use a basic and clear map outline to avoid distracting from the data.
- Use a single color in varying shades to show changes in data.
- Avoid using multiple patterns.


What’s Happening at Facebook? A Breakdown of the Ongoing Data Story
When Facebook shared a story in its official newsroom at 9:00 p.m. on Friday night, it didn’t bode well for anyone.
Maybe it would make sense to post a small, throw-away story at a time when few people would be monitoring their inboxes for breaking news or major announcements. But at that point, why publish it at all? No, this had to be something big — something that Facebook hoped people would miss for the sake of their regularly-scheduled Friday night plans.
But it didn’t quite work out that way.
Instead, the weekend was much noisier than usual, with reporters, legislators, and executives weighing in on what might turn out to be the biggest tech news story of the year: the story of how the personal data of 50 million Facebook users was obtained by a so-called data analytics firm and likely misused for a number of purposes, including, allegedly, influencing a U.S. presidential election.
How in the world did this happen?
Many are understandably confused about that question — as well as what’s going to happen now, who’s at fault, and more.
Here’s what you need to know.
What’s Going on at Facebook? A Breakdown of the Ongoing Data Story
What Happened?
This all began when Cambridge Analytica, a data analytics firm, began wading into the world of politics. It wanted to find an edge that other, similar consulting companies hired by campaigns, for example, didn’t have — and the solution to that was thought to be found in personal Facebook data.
That went beyond someone’s name, age, email address, and demographics. It had to be behavioral data — such items and behaviors as Page and comment Likes that would help analysts build what they called psychographic profiles that could reveal if someone was, as the New York Times put it, “a neurotic introvert, a religious extrovert, a fair-minded liberal or a fan of the occult.”
That could be determined by closely examining what a person Liked on Facebook — and could help to compose influential messaging to sway consumers … or voters.
That helps to explain why Cambridge Analytica was hired by Donald Trump’s campaign officials leading up to the 2016 U.S. presidential election — and received investments from Robert Mercer (a known Republican donor) and Steve Bannon, Trump’s former campaign advisor.
The data on users’ Facebook behavior could be used to shape messages that leveraged what Mark Turnbull, Cambridge Analytica’s political division managing director, called “deep-seated underlying fears [and] concerns” in hidden camera footage captured by the U.K’s Channel 4 as part of an investigative report.
“The two fundamental human drivers, when it comes to taking information onboard effectively, are hopes and fears — and many of those are unspoken and even unconscious,” Turnbull said in the footage. “You didn’t know that was a fear until you saw something that just evoked that reaction from you.”
That’s where the behavioral data came in — it could help Cambridge Analytics do its “job … to drop the bucket further down the well than anybody else, to understand what are those really deep-seated underlying fears, concerns.”
He added: “It’s no good fighting an election campaign on the facts because actually, it’s all about emotion.”
This Was Not a Data Breach
While it can be argued that this personal data was used for less-than-savory purposes, one of the biggest misconceptions of this story is that it was a breach or hack of Facebook that allowed Cambridge Analytica to obtain the personal data of 50 million users.
However, that’s not what happened.
“This wasn’t a data leak by Facebook,” said Marcus Andrews, HubSpot’s Principal Product Marketing Manager. “I think that has been misreported.”

Source: Facebook
When someone creates a Facebook account, she must agree to the company’s Data Policy: a rather long document that discloses the use of a user’s personal Facebook data, what kind of data is collected, as well as details on how and why that data is used.
Here’s a crucial, but largely unnoticed excerpt:
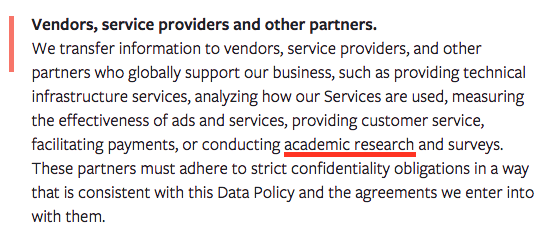
The “academic research” allowance played a major role in allowing Cambridge Analytica, in particular, to gain access to personal user data. At Cambridge University’s Psychometrics Centre, researchers created a method of synthesizing a user’s personality elements based on the Pages, comments, and other content they liked on Facebook.
The method required users to opt-into taking a personality test and downloading a third-party app on Facebook that scraped some of that information, as well as similar data from their friends. These users were compensated for their participation in the research, and when it was conducted, Facebook permitted that type of activity on its site.
But the Psychometrics Centre wouldn’t agree to work with Cambridge Analytica, so it instead enlisted the help of Dr. Aleksandr Kogan, one of the university’s psychology professors. He built his own app with similar capabilities in 2014 and, that summer, started work on obtaining the requested personal data for the firm.
According to the New York Times report, Kogan revealed nothing more to Facebook and users than that he was collecting this data solely for academic purposes — a purpose that Facebook did not question or verify. In its official statement on the matter, Facebook VP & Deputy General Counsel Paul Grewal wrote that Kogan “lied to us and violated our Platform Policies by passing data from an app that was using Facebook Login to SCL/Cambridge Analytica.”
Those policies forbid third parties from selling, licensing, or purchasing data obtained from Facebook, or transferring that data “to any ad network, data broker or other advertising or monetization-related service.”

On the surface, it appears that Facebook did not violate any privacy rules or standards by allowing this personal user data to be accessed. Kogan, however, allegedly violated the platform’s policies by transferring it to Cambridge Analytica, where it was assumed to be used for non-academic purposes.
But it’s been known since 2015 that Cambridge Analytica has been in possession of this data, when it was using it in a similar manner while working on behalf of then U.S. presidential candidate Ted Cruz, which Guardian reported on late that year. At the time, Facebook said it was “carefully investigating this situation,” and, more recently, claims Kogan’s app was removed from the network and that it received “certifications” from Cambridge Analytica and Kogan, among others, that the data had been destroyed.
Why Facebook Is Taking a Major Blow
On Monday, following a weekend of emerging news and speculation around what Cambridge Analytica had done, Facebook began to experience was looked to be the beginning of a major fallout.
By the end of the day, its stock price had dropped over 7% (and continued to drop through the publication of this post on Tuesday), causing CEO Mark Zuckerberg to lose roughly $5 billion of his net worth. A #deletefacebook movement began. And by Tuesday morning, Zuckerberg had been called upon by members of the U.K. parliament to furnish any evidence pertaining to Facebook’s connection to Cambridge Analytica.
But if Facebook didn’t actually violate any rules, what’s causing the uproar? Especially if it’s hardly the first instance of data being used in this capacity?
“None of this tech is new to advertisers,” says HubSpot head of SEO Victor Pan, an ex-search director who worked for one of the largest-known global media buying companies, WPP plc, for three years. “But there’s an uncanny valley experience that is also true with personalized advertising — and we’re there right now.”
In other words, users largely feel that they were being manipulated by Facebook — or that, despite its emphasis on how much it values privacy, it wasn’t doing enough to protect them from the abuse of their personal data.
“It doesn’t feel very good to know that you’re being manipulated,” Pan said, “and people are turning denial into anger.”
The timing of the news doesn’t help, either. Facebook, as well as several other online and social networks, is already facing high scrutiny for the alleged weaponization of its platform by foreign agents to spread misinformation and propaganda with hopes of influencing the 2016 U.S. presidential election.
Plus, there are rumors circulating that Facebook’s chief security officer, Alex Stamos, will soon be departing the company among conflicting points of view with other executives (and the downsizing of his department). Stamos is said to have wanted greater transparency around the network’s privacy and security woes, contrasting the opinions of others in the c-suite.
“It also raises the wrong questions for Facebook at a time when the company is already struggling to retain its younger user demographic,” said Henry Franco, HubSpot’s social campaign and brand Marketing Associate. “This is a group that is increasingly wary of how the company collects user data.”
And for his part, Andrews says that more users should share this concern and skepticism. “From a user perspective, people shouldn’t assume their social data is in any way protected,” he explained. “All the data you provide social networks is manipulated, shared, and monetized constantly — illegally and legally.”
What Happens Now
As a first step, Facebook banned Cambridge Analytica and other associated actors — including Dr. Kogan and Christopher Wylie, the contractor working with Cambridge Analytica who is said to have blown the whistle on the alleged use of this data by the Trump campaign.
Suspended by @facebook. For blowing the whistle. On something they have known privately for 2 years. pic.twitter.com/iSu6VwqUdG
— Christopher Wylie (@chrisinsilico)
March 18, 2018
As for the uncertainty of earlier certifications that the user data was destroyed after initial revelations in 2015, Facebook has enlisted the services of digital forensics firm Stroz Friedberg to determine if the data is still in existence, or in Cambridge Analytica’s possession.
However, Stroz Friedberg investigators have since stepped aside to make way for an investigation being conducted by the U.K. Information Commissioner’s Office.
As the story continues to unfold, there appears to be much at stake for marketers and those who use social media — as well as data — to shape messaging in a legal way. In fact, Andrews says, the use of social data to personalize marketing isn’t always a bad thing: “It keeps the internet free and makes the ads and content you see more relevant.”
But he cautions of the consequences that marketers could ultimately face because of the actors who use data maliciously, citing a “need to better understand the power these data can provide people with an ulterior motive, and protect consumers” accordingly.
That’s especially true in the face of such regulations as the GDPR, which is coming into force in the EU next month. And now that the U.S. is experiencing particularly amplified cases of personal data abuse, Andrews says, it “could speed up internet privacy regulation and provide fodder for lawmakers who want that. We could be headed towards a more regulated digital marketing landscape.”
But until that day comes, says Franco, it’s up to the rest of us to ensure that user data is protected.
“With very little government regulation, it’s up to tech giants to enforce these rules, which highlights a huge conflict of interest,” he explains. “Any restrictions on how third parties take advantage of user data could potentially impact their profitability.”
And, he suspects, this event is likely the last we’ll see of personal data use coming into question.
“With so many third-party developers able to access user data through Facebook APIs, there’s no telling how many other actors might be abusing data in a similar way,” he says. “While the Cambridge Analytica situation is unsettling, what’s worse is that it may just be the tip of the iceberg.”
This is a developing story that I’ll monitoring as it unfolds. Questions? Feel free to weigh in on Twitter.

How to Delete Your Instagram [Easy Guide]
Instagram doesn’t always make us feel our best. While the photo-sharing platform encourages creativity and has become a powerful tool for brands, usage of the app has also been connected to increased levels of anxiety and depression among young people.
If you’ve finally tired of Instagram’s endless stream of FOMO-inducing vacation pics, slime videos, and former Bachelor contestants selling hair vitamins, this quick guide will walk you through temporarily disabling or deleting your account for good.
Before you proceed, keep in mind that deleting your account cannot be undone. Once you move forward, your profile, photos, videos, comments, likes, and followers will all be permanently removed from the app.
How to Delete Your Instagram
- Log on to Instagram.com from a web or mobile browser. You won’t be able to delete your account from within the Instagram app.
- Enter http://ift.tt/1EvU0Rx into your browser’s address bar. There is no way to navigate to this page from Instagram.com, so you’ll need to enter this URL directly once you’re logged in.
- Once you land on the page, select an answer from the drop-down menu for ‘Why are you deleting your account?’
- After you’ve selected an answer, you’ll be promped to re-enter your password.
- An option to permanently delete your account will appear.
If you’d rather just take a break and temporarily disable your account, follow the steps below instead. Temporarily disabling your account means that your profile, photos, videos, comments, and likes will all be hidden until you reactivate your account by logging back into Instagram.
How to Disable Your Instagram
- Log on to Instagram.com from a web or mobile browser. You won’t be able to disable your account from within the Instagram app.
- Click the person icon in the upper right-hand corner to navigate to your profile.
- Click ‘Edit Profile’ on your profile.
- Scroll down until you see an option for ‘Temporarily disable my account’.
- Once you land on the page, select an answer from the drop-down menu for ‘Why are you disabling your account?’
- After you’ve selected an answer, you’ll be promped to re-enter your password.
- An option to temporarily disable your account will appear.

The Definition of Advertising in Less Than 50 Words
Ads in 2018 are anything but straightforward — but that’s kind of the point.
Consider for a minute that this green rainbow is an ad:

McDonald’s “Shambow” light installation, Chicago, St. Patrick’s Day 2018 (Image via Adweek)
And this “Ketchup” jersey is also an ad:

Doritos’ limited edition Ketchup streetwear line (Image via Adweek)
Once easily defined in terms of medium, today’s ads are designed to slip seamlessly into our lives without causing noticable disruptions (whether or not they always succeed in this area is another story entirely).
With advertisers working harder than ever to create unexpected (and undetected) ad experiences, a clear definition of advertising is more difficult than you might think to pin down. If you’re here, I’m guessing you’re looking for a succinct, simple definition of advertising. Maybe even — and I’m reaching here — in 50 words or less? I won’t delay you further.
What is Advertising?
Advertising is a form of communication that attempts to influence the behavior of a defined target audience. Any message developed and placed with the ultimate intention of persuading a group to take a specific action (such as buying a product) can be considered an ad.
To be considered an ad, messages don’t need to specifically mention a product or service. In fact, many of the ads you encounter on a daily basis are more about cultivating a general sense of awareness for a brand than directly influencing buying decisions right away.
As a general rule of thumb, if you think it’s an ad, then it probably is.

9 Ways to Make a Resume Employers Will Hate [Infographic]
Crafting a standout resume is a lot of work.
Not only do you have to write the darn thing, but you also have to check (and double-check) for typos, even out your margins, make sure you’re not repeating the same action verb 10 times … the list goes on.
In other words, knowing what makes a great resume also means knowing what makes a bad one. And while there are a lot of little things you’ll want to check before sending your “curriculum vitae” (CV) to a recruiter, some more important than others.
Download our 10 free marketing resume templates here.
In the name of prioritization, check out the infographic below from StandoutCV for a list of nine resume mistakes you definitely don’t want to make the next time you apply to an open position. Then, see a brief list of advice to keep bookmarked when you find your dream job.

Perhaps this infographic made you cringe at a mistake you made in a past resume. Everyone needs another chance — so, here’s a quick summary of things to keep in mind when making (or remaking) your CV:
- Professional email address: Your old AOL screen name won’t cut it in the job world. Stick to your first and/or last name.
- Actionable verbs: Don’t just say you’re a “self-starter” — explain what you did to earn that title.
- Years of experience: “Proficient” needs a number value. How long have you done these things?
- One to two pages: Recruiters sift through a lot of resumes every day. Make yours as concise as possible.
- Employment consistency: Did you take a year off? What’d you do to stay productive?
- Error-free: “Attention to detail” is a bullet point on so many job listings today. Show you care with a resume that is clean of typos.
- Balance and neatness: Sans serif fonts and bulleted lists make your resume easy to read. (Hint: This blog post does both of those things!)

18 Instagram Apps to Make Your Posts Stand Out
With 500 million daily active users on Instagram, it’s not enough to just rely on the 24 standard filters and tools available within the app anymore. To truly set yourself apart from the other brands competing for attention, you’ve got to supplement your Instagram game with some extra apps.
Lucky for you, there are plenty of apps and tools available to help you edit Instagram photos, gain followers, attract likes, and analyze your performance. Unfortunately, a lot of these tools aren’t as helpful as they seem.
To help you take your Instagram posts to the next level, we’ve compiled a list of all the best apps and tools that will help you at any stage of your Insta journey. These tools will make your Instagram content distinguishable, memorable, and impactful. You might not be able to reach all 500 million potential customers, but you’ll be able to reach the ones that matter most to your brand.
Best Instagram Apps
- VSCO
- Priime
- Snapseed
- Pixlr
- Litely
- Followers for Instagram
- Social Rocket
- Crowdfire
- Tracker for Instagram
- Followers & Likes on Instagram
- InstaTag
- Get Instant Likes and Hashtags
- Magic Liker for Like Tags
- Instagram Insights
- Hootsuite Analytics
- Iconosquare
- Union Metrics
- Squarelovin
Instagram Photo Editing Apps
Instagram’s in-app filters leave something to be desired. If you’re looking for an easy way to make your photos look more professional and unique, try out one of these alternative photo-editing apps. Whether you’re looking for a wider selection of filters developed by professional photographers, or just want to remove blemishes from selfies, these will do the trick.
1. VSCO
- Price: Free
- Available on: Android and iOS
VSCO provides free filters that often beat Instagram’s in-app options in terms of quality and professionalism. VSCO also offers plenty of editing tools (like customized sharpen, brightness/contrast, and skintone correction), so you can fully tweak your photo before exporting to Instagram. Plus, like Instagram, VSCO offers its own social capabilities: you can follow people directly on VSCO, and post and share photos from within the app.


2. Priime
- Price: $2.99
- Available on: iOS
Priime offers a selection of over 100 filters created in collaboration with professional photographers. If you aren’t sure which filter will look best, you can even receive recommendations from Priime’s Smart Suggestions.


Images via App Store
3. Snapseed
- Price: Free
- Available on: Android and iOS
Sometimes, your photo has varying degrees of darkness and brightness and you don’t want to auto-enhance all of it. Snapseed’s brush tool allows you to selectively adjust for exposure, saturation, and color temperature, which is ideal for situations where you’d rather selectively edit. Snapseed also gives you plenty of control and fine-tuning, and even provides tools to remove small blemishes or unwanted objects.


4. Pixlr
- Price: Free
- Available on: Android and iOS
With Pixlr, you can build your own filters with effects, overlays, and textures. When you’re happy with a filter you’ve created, you can save that filter and use it again. This can be particularly useful if you’re trying to build a unique brand image. Pixlr also lets you selectively adjust your brightness and sharpness. It includes a red-eye fixer and an array of photo-editing tools.


5. Litely
- Price: Free
- Available on: iOS
If you’re frustrated by photos that look overly filtered and edited, Litely is the tool for you. Litely offers uniquely subtle filters with the intent of enhancing the natural beauty of a photo. You can drag your finger anywhere on the image to make adjustments, and tap your finger to compare “before” and “after” versions. You can also choose different variations of the same filter (like “argyle,” “argyle high,” or “argyle faded”) to ensure the filter looks natural with your photo.


Instagram Apps for Followers
There aren’t many automated ways to gain followers, which makes the task a tedious challenge for any social media manager. Fortunately, the following tools can combat this challenge. Although the apps won’t let you buy followers, they offer legitimate options to gain and manage followers organically. You can decipher why people unfollow you, how to improve your social media visibility, and how to keep your followers long-term. With the help of these tools, you can attract a larger following and ensure your current followers are happy.
6. Followers for Instagram
- Price: Free
- Available on: Android and iOS
Followers for Instagram shows you accounts that unfollowed you, accounts that haven’t followed you back, and accounts you should be following based on similar accounts you already follow. You can use this data to strengthen weak relationships, make your followers happier, and understand the reasons an account might unfollow you. You might find that accounts are unfollowing you for simple, fixable reasons — like posting infrequently. Hopefully, fixing these issues improves your relationship to your Instagram audience longterm.


Images via App Store
7. Social Rocket
- Price: Free
- Available on: iOS
Social Rocket is a “likes/followers” marketplace: every time you like someone else’s post, you gain points to exchange for followers or likes on your own posts. Although this is probably an inefficient long-term solution, it can be helpful in the beginning when you’re trying to build an initial following and want your content to spread.


Images via App Store
8. Crowdfire
- Price: Free
- Available on: iOS
Crowdfire identifies your inactive followers. If you know your inactive followers, you can delete them from your followers pool and fix your ratio to get better analytics. Crowdfire also provides automated DM messaging, recognizes when people unfollow you, and helps you find new followers.

Images via App Store
9. Tracker for Instagram
- Price: Free
- Available on: iOS
Instagram doesn’t offer any efficient tools for unfollowing or following accounts in bulk. Tracker for Instagram allows you to do this directly from the app. It also shows you your overall post performance, and analyzes how followers engage with your account, so you can discover your most active users.

Images via App Store
10. Followers & Likes on Instagram
- Price: Free
- Available on: iOS
Followers & Likes on Instagram creates lists of your most engaged and least engaged followers, which is helpful because it gives you a better understanding of your target audience. It also shows you which posts attract the most likes and comments from your best followers. Knowing your most popular posts helps you evaluate and modify your future content strategy.


Images via App Store
Instagram Apps for Likes
On Instagram, likes are the strongest indicator we have when evaluating whether our audience is happy. Plus, the more likes your post gets, the higher it’ll appear on people’s feeds, and the more popular it’ll become. While there are no apps that allow you to buy likes, there are apps that help you attract more likes by offering suggestions, popular hashtags, and favorable captions.
11. InstaTag
- Price: Free
- Available on: Android
InstaTag allows you to discover the highest trending hashtags, which is valuable since popular hashtags change daily. By knowing the trending hashtags, your posts are more likely to show up ahead of the less relevant competition. There are dozens of categories and hundreds of tags, and you’re even able to search tags across categories.


Images via Android Apps on Google Play
12. Get Instant Likes and Hashtags
- Price: Free
- Available on: Android
Get Instant Likes and Hashtags gathers the top tags for each category and shows you the most popular ones, making it easy to make hashtag decisions quickly. You can also add, edit, and remove categories, and create custom hashtags, so you can copy all your hashtags at once and paste them into your post.


Images via Android Apps on Google Play
13. Magic Liker for Like Tags
- Price: Free
- Available on: iOS
Magic Liker helps you search multiple tags at the same time, find popular tags suggested by the app, search through daily suggested tags, or search posts by category like, “only videos,” or “only photos.” It also provides captions that are currently popular, for additional caption-writing inspiration.


Images via TopAppsLike.com
Instagram Analytics Apps
Regardless of where you are in your Instagram strategy (i.e. still creating it, or have been implementing it for years), it’s important to gather analytics to figure out how well you’re doing, and where you could be doing better. With the right Instagram analytics tools, you’ll be able to improve your strategy, attract a larger audience, and make your existing followers happier than ever.
14. Instagram Insights
- Price: Free
- Available on: Android and iOS
Instagram actually does offer its own native analytics tool. Instagram Insights does require you to have a Facebook Business profile, but if you don’t have one, it’s a simple four-step process to get set up. The tool offers powerful insights, including how many times people use the Send Message option on your Instagram story, how many people have saved your posts, and how well your Instagram advertisements are doing.

Image via Buffer Blog
15. Hootsuite Analytics
- Price:Free 30-Day Trial, Professional Version is $30/month
- Available on: Android and iOS
Along with metrics like audience growth and traffic, Hootsuite gathers insights like how people react to your posts according to language or gender, and what types of action your followers are taking. You can also customize the insights you collect, which is particularly helpful if you’re testing out unique engagement factors or collecting specific data.

Image via Hootsuite
16. Iconosquare
- Price: Free 30-Day Trial, Professional Version is $30/month
- Available on: Android and iOS
While the above two tools focus on your business alone, Iconosquare also examines the community (and competition) by identifying the most important Instagram influencers in your industry. This is great if you’re interested in hiring influencers to promote your brand, but aren’t sure where to find them. It’s also helpful if you’re just starting to build your Instagram strategy, and want to see what other brands are doing for inspiration. Iconosquare also provides analytics on engagement, and analyzes hashtag growth and popularity.


Images via App Store
17. Union Metrics
- Price:Free Account Checkup, Lite Version is $23/month
- Available on: Android and iOS
Union Metrics’ free Instagram Account Checkup shows you the best time to post for your network, your most loyal followers, your top hashtags, and your best-performing posts. The paid version gathers more specific information including a profile analysis, analytics, and hashtag monitoring. If you’re unsure about paying for it, test out the free Checkup Tool and see what you think.

Image via Union Metrics
18. Squarelovin
- Price:Free
- Available on: Android and iOS
Squarelovin provides analytics regarding growth, engagement, number of followers, best and worst times to post, and top hashtags. Best of all, the analytics are delivered daily, weekly, and monthly, allowing you to narrow or broaden your focus and your analytics as you see fit. This is especially helpful if you want to A/B test a few different Instagram strategies throughout the month, and want to compare weeks or even days.

Image via Squarelovin

The Best of B2B Marketing Content: 10 Examples
Here at HubSpot, some of the most awe-inspiring moments take place when we get to take new products and features for a test drive. We transform, if it’s even imaginable, into even bigger geeks than we normally are, squealing with the excitement typically reserved for iPhone launches and new seasons of Netflix series.
But alas — this glee is caused by software we use every day at work, and will eventually get to share with other marketers.
Many B2B marketers have seen B2C content at least once and asked, “Why do they get to have all the fun?” But the moments like the one we described above are the ones that remind us: B2B companies are just as passionate about their products as B2C companies are. And for every B2B product, there are even more B2B users out there looking for information, inspiration, and knowledge to provide them with solutions.
The point? No marketing, including content, is uninteresting if you look at it certain ways.

Done right, B2B content marketing can certainly match — and sometimes, maybe even rival — the creativity and appeal of the best B2C ones. And we want to recognize the brands that are breaking that mold and creating great content that grows fervent, dedicated audiences.
Below, you’ll find a few of our favorites, all with their own B2B marketing strategies that you can take with you.
10 Exceptional B2B Content Marketing Examples
1. CB Insights: Newsletter

What It Does Well
There are two things I love about the CB Insights newsletter. First, it’s surprisingly funny (the subject lines alone make it worth it). Second, you learn a lot just by reading the newsletter, no need to click through a bunch of links.”
– Janessa Lantz, HubSpot Senior Marketing Manager
We love how this newsletter illustrates the willingness of CB Insights to not take itself too seriously. Yes, it shares some of the finest insights on technology, venture capital (VC), and emerging businesses, but it does so with fun images that ultimately relate back to the subject — e.g., the above photo of Oprah that’s been adapted as a meme, since, well, that was the topic of the newsletter.
But the messaging remains relevant, even among the hint of silliness. After all, CB Insights designs technology for people in the VC space, so it’s tasked with creating content that will appeal to a broad audience: customers, prospective customers, tech enthusiasts, and investors. And so, under such subject lines as “so sad: tough to have a VC dad,” it includes relevant data. Yes, gifs are hilarious — but in some contexts, they’re also worth $147 million.
Takeaway for Marketers: Remember Your Buyer’s Goals
When you’re dying to create truly unique, cutting-edge content, it’s easy to stray from your organization’s mission and focus.
So, while it’s great to think outside of the box, use clever subject lines, or even write every email with an overarching humorous tone — keep it relevant and include the information that the people reading it signed up to receive in the first place. Then, keep it human.
2. Mattermark: Raise the Bar

What It Does Well
Raise the Bar rounds up the best stories about a variety of different industries, giving me a great snapshot of trends to watch and news stories to follow without having to search for them myself.”
– Sophia Bernazzani, Editor, HubSpot Customer Success Blog
One of the best things about well-curated content — especially the kind that pertains to your line of work — is that it eliminates a lot of work. Keeping up with news and trends is never easy when you’ve already got a full plate, so when someone else is able to hand-pick the things you need to know, it can feel like you’ve struck gold.
That’s what Raise the Bar does, by compiling a “daily digest of timely, must-read posts on sales, marketing and growth engineering.” And, that was the intent all along. In a 2016 blog post announcing the launch of the newsletter, Mattermark’s Co-founder and CEO, Danielle Morrill, wrote, “We’re turning our focus toward sifting through the mountains of content out there around sales, marketing, and growth to help the community of DOERS who grow companies.”
Takeaway for Marketers: Educate Your Buyers
Think about the problems that your product or service already aims to solve for customers. Then, turn that into relevant content that’s going to both save time for and inform your audience — and make it easy for them to access it.
3. MYOB: Tax Time

What It Does Well
MYOB, a provider of business management solutions in Australia and New Zealand, helps companies manage their finances, in part by connecting them with bookkeepers and financial services professionals. It has two main buyer personas:
- Small businesses that are just learning the ropes
- More established companies that need greater insight into all facets of their operations.
Each audience has its own set of concerns and corresponding hub of information on MYOB.com — and MYOB has built a B2B content marketing strategy for each one that shows how much it understands its customers.
MYOB recognizes that many businesses are figuring out accounting and financial decisions as they grow, so it’s created content that positions the brand as a go-to resource to help those businesses navigate each stage of their development. The Tax Time center, for example, is angled to fit the needs of both customer groups, providing tips for those just starting out, and guides for breaking through new stages of development.
Takeaway for Marketers: Grow With Your Buyers
When you begin to brainstorm and map out ideas for content, ask yourself, “Do I really understand my audience?” If you have any doubts as to how the idea will benefit or be useful to your audience, the answer might be “no” — and that’s okay. Like everything else, audiences (and people) evolve, so it’s okay to go back to the drawing board in instances like these for a refresh.
4. Unbounce: Page Fights (R.I.P.)
What It Does Well
If you’ve ever seen a growth marketer on the heels of a successful optimization experiment, you know that her energy is electric. Unbounce, a landing page software company based in Vancouver, understands that excitement and decided to leverage it to create an engaging microsite, Page Fights, in collaboration with optimization company Conversion XL.
The project came to a close after one year, but during its existence, Page Fights contained live streams of marketing optimization expert panels who critiqued landing pages in real time. It was content that expanded far beyond the written word — and that was one thing that made it so great.
Sure, Unbounce has a successful blog, but it saw Page Fights as an opportunity to expand beyond that copy. It knew that the web — especially within marketing and web design — was becoming increasingly crowded with content. To address that, it diversified the format of its expertise, to keep its audience engaged and learning.
Takeaway for Marketers: Diversify Your Channels
The internet is only going to become more crowded. And as the human attention span dwindles, that makes it even more important to create content that engages and maintains your audience’s attention.
So while we don’t recommend abandoning blogs completely — after all, written content is still vital to SEO — we do emphasize the importance of diversifying content formats. Marketers who incorporate video into their content strategies, for example, have seen 49% faster revenue growth than those who don’t. And remember that tip to “keep it human” we mentioned earlier? That’s a great thing about live video in particular — it can help portray brands (and their people) as candid and genuine.
5. Deloitte Insights

What It Does Well
Deloitte is a professional services company specializing in consulting, tech, auditing, and more. It works with a massive cross-section of industries, from government agencies to life sciences — and that broad range of knowledge is a major selling point. That’s why creating informed, useful content for individual, specialized audiences is core to its marketing strategy.
But Deloitte has also used that wealth of knowledge to position itself as a resource for those who want to know what it knows. So, among its specialized hubs are educational content centers, including Deloitte Insights (formerly branded Deloitte University Press).
Much like some of the other remarkable B2B content we’ve come across, it curates not only different pieces of highly helpful content — but also a variety of content formats. From blog posts, to webcasts, to podcasts, Deloitte Insights has a bit of everything for those who want to learn about its specialties and the industries it works with.
Takeaway for Marketers: Separate Your Buyer Personas
Creating a content strategy to please a wide-scale audience like Deloitte’s is challenging. It can quickly become unfocused. But if your company has a number of specialties, creating content microsites for each of them is one way to keep that information organized, discoverable, and easy to navigate.
Plus, it can never hurt to establish your brand as a go-to resource. So, as you create these content hubs, consider adding a “knowledge center” among them that’s dedicated to teaching your audience the valuable things it wants to learn.
6. First Round Magazines

What It Does Well
Here’s another example of a brand that does a great job of leveraging different categories of knowledge. First Round, an early-stage VC company, recognized the knowledge among entrepreneurs and leaders that wasn’t being shared — knowledge that could be highly beneficial to their peers — and created the First Round Review as a place for it to be shared. It serves, reads the manifesto, to liberate the ideas and expertise that are “trapped in other people’s heads.”
But liberating that much-untapped knowledge can lead to the same problem we alluded to above — an unfocused mass of content that makes it difficult to discover exactly what you’re looking for. That’s why First Round organized the Review into a collection of nine online magazines, each specializing in a different aspect of building a business.
Takeaway for Marketers: Work With Thought Leaders
If you’ve ever wondered how to leverage the wealth of knowledge outside of your organization — and inside your professional network — here’s a great example.
Don’t be afraid to reach out to the entrepreneurs and leaders you’ve met, or simply just admire, to figure out how they can work with you to create content with teachable experiences that your audience will value. Sharing useful, relatable first-hand accounts conveys empathy, which helps to invoke trust among readers.
7. NextView Ventures: Better Everyday

What It Does Well
We absolutely love stumbling across B2B companies with an active presence on Medium. A great example is VC firm NextView Ventures’ Better Everyday, a Medium publication that focuses on “stories, analyses & resources to help seed-stage founders redesign the everyday.”
But why would NextView want to create an entirely separate blog that isn’t even on its website? Well, it’s an exercise in creating off-site content: the material you own but doesn’t live on your website. When executed correctly, it can give publishers a huge boost in discoverability, variety, and quality, especially when making use of a highly popular platform like Medium.
Because Better Everyday isn’t attached to the company’s main URL, it provides an opportunity for NextView to experiment with different tones, voices, and stories — all from a variety of experts that might already be using Medium to discover and contribute unique content. Plus, with Medium’s built-in ability for people to recommend, highlight, and search internally for relevant content, it makes the work published there that much more shareable.
Takeaway for Marketers: Publish Off-Domain Content
Take advantage of the availability of off-site content platforms. As my colleague, Sam Mallikarjunan, writes in “Why Medium Works,” it can take up to six months of consistent publishing on your company’s blog before it gains significant traction. (And we’re not discouraging that — stick with it, and find ways to supplement those efforts.) But off-site content diversifies your audience by engaging readers who might not have otherwise found your website.
Medium, for example, connects your content with the people most likely to read it. Plus, you’re creating a publication on a platform that comes with a built-in audience of at least 6.3 million users.
8. Wistia: Instagram
What It Does Well
At risk of sounding like a broken record, we can’t emphasize enough the importance of B2B brands maintaining a human element. That’s why we like it when companies use social media channels to give audiences a “look inside” at the people who make the great products and services they love.
Wistia, a video hosting platform, does that particularly well by sharing visual content on Instagram that lifts the curtain on its people — and dogs. It not only aligns with its brand — after all, the company does provide technology to businesses that want hosting solutions for their visual content — but it’s also just smart. Among its other advantages, visual content can help boost a viewer’s retention of things like brand information.
Takeaway for Marketers: Incorporate Visual Content
Please, please, please don’t neglect to incorporate visuals into your content strategy. Of course, having a presence on visually-focused channels like Instagram and YouTube is vital — but when it comes to your written content, don’t afraid to use visuals there, as well. After all, articles with an image once every 75-100 words got double the number of social shares than articles with fewer images.
But if you can also create content that aligns with the core of your product or service, that’s also great. As we mentioned before, Wistia creates visual content technology — so it makes sense that it would have unique visual content. Identify what your business does particularly well, and then make the most use of the channel that best aligns with your strengths.
9. Zendesk Engineering

What It Does Well
Yes — more offsite content. This time, it’s from Zendesk, a maker of customer service software that’s done something unique with its Medium publication, Zendesk Engineering.
Zendesk might be an expert in the solutions provided by its product, but behind that product is a chorus of highly skilled experts — the people who build and engineer the software. The company realized that there’s an audience to be tapped that’s seeking insights and expertise on the technical side of the product, so it used that to build an entirely independent content property.
Takeaway for Marketers: Tell Your Brand Story
Dig beneath the surface of the solutions your company provides. You offer solutions — but what is your process? What have you learned that makes you do what you do so well, and how did you get there?
Sure, topics like engineering might be traditionally “unsexy.” But when leveraged and communicated in a storytelling manner, they can make for remarkable content.
10. Hexagon: Annual Report
 Image via App Annie
What It Does Well
Who says written content needs to be two-dimensional?
For Hexagon, an industrial IT solutions provider, “AR” doesn’t just stand for annual report. With that in mind, the company recently “augmented” a presentation to its investors in a creative way.
Hexagon used augmented reality (AR) to spruce up their written company report, giving investors a more interactive experience when learning the latest updates on the company. How does it work? A mobile app, based on technology from Samsung and zSpace, displays a virtual demonstration of a product when readers hold their mobile device over a “trigger image” of that product within the report.
Takeaway for Marketers: Challenge Your Buyers
It’s easy to feel limited by your medium as you create content — especially for a business audience who you’ve all agreed is comfortable with that medium.
But in order for content to convert readers and incite growth, it needs to occasionally disrupt its audience’s point of view. A company doesn’t work for its content; content works for its company. If you need to say something that a blog alone can’t, the business demands that you make it work — whether that means starting a YouTube channel or seeing how you can integrate an AR tool into your next ebook.
And the List Goes On
We’re optimistic that the digital realm is full of strong B2B content marketing efforts — and, we want to hear about them. But even more than that, we want to hear how these examples inspire you. As they show, there’s a world of content opportunities out there, just waiting for creative B2B marketers to take on.