
6 Content Ideas to Keep Ecommerce Shoppers in the Holiday Spirit
You’ve been prepping your ecommerce site for a banner holiday season for months now. You’ve adding sparkly graphics, and changed up clever copy, but you may be forgetting one major thing: your content. See, many of the consumers who find your website this holiday season may not be regular customers. They’re probably shopping for someone else. How will they know they’ve found the perfect products if you don’t have content in place to help them?
FAQs
What could any new customer possibly need to know about your products? The answers you give here aren’t directed toward your usual buyer, so keep that in mind. You need to give answers to someone who may have zero experience with your products or brand.
Stepping outside the comfort zone of your buyer personas is hard, especially after you’ve worked so hard to find that space to begin with. But if you’re not diligent in answering the questions a “newbie” might have, you might just miss the sale.
Gift Guides
Once those buyers know what they need, show them how the products can be used. Gift guides are a great way to introduce new ideas to uninitiated buyers. For instance, maybe a mom is looking for something edgy and fun for her daughter, but isn’t sure which of your products fits. A gift guide spells out exactly who loves your products, shows the best options for everyone on the gift list, and quells buyer’s fears.
Tutorials
Now, suppose your products require some assembly. How would someone who’s not acquainted with your brand go about putting your products together before presenting the gift? Even those who are aware of your brand and want the items you sell very badly may need some help figuring out best uses. Tutorials are the perfect way to keep previous buyers coming back for more information.
You not only have a chance to answer questions and create some serious customer delight, but you can also hint toward the purchase of other products, especially if they can meet your buyers’ pain in any way. Accessories, items that enhance other products, or just additional purchases because you sell cool stuff—these are all great things to introduce in your tutorials.
Product Reviews
No new customer is just going to take your word for it. If you provide only the testimonials you want others to see, then buyers will go somewhere else to get the info they need. That means moving away from your ecommerce site, maybe never to return again.
If, however, you cut out the third-party review sites and includie reviews right there on your own site, you keep buyers around. They appreciate your honesty, and in some cases will reward you handsomely for being so transparent.
Videos
Some buyers prefer to learn by watching instead of reading. That’s just all there is to it. With videos, you have a chance to convey the very same emotions while also introducing a vivid world where your products live. Take the time to produce some quality videos that reach out to the buyers you might not normally see. Use these videos to share all the above content and more.
Remember that your introductory information doesn’t have to be in depth. Sometimes a little humor can capture attention and get those consumers hooked. A video is the perfect way to give a brief introduction that leaves everyone wanting more.
Social Engagement
Don’t forget to listen within your social channels for things said about your brand or products. When you post social ads, graphics, or links, stick around to see who responds. You may get lots of questions or comments that need immediate answers. How you handle your social engagement is just as important—if not more—than the long-form content you’ve been planning. Remember, 140 characters of content is still content, and you can use every last one of those characters to educate and delight your buyers.
A content calendar is a great way to get your holiday content organized and scheduled for release. We do have some templates, or you can come up with something that works just for you. However you plan, just be sure that you do keep your content at the forefront of your mind.
10 To-Do List Tools to Simplify Your Task Management
You know the phrase, “One man’s trash is another man’s treasure”? That’s how I feel about to-do lists.
After all, how you track your tasks depends entirely on the person. Are you looking for a simple interface, or are you hoping to color-code and categorize hundreds of tasks at once? Is this to-do list for yourself, you and your family, or you and your entire team? How much do aesthetics matter?
There are hundreds of to-do list tools out there, but some of them are just plain better than others. To help you separate the really solid ones from the rest, we’ve curated a list of 10 of the best to-do list tools below, including short descriptions to help you determine which may be right for you.
1) Wunderlist
Price: Free for Basic, $4.99/mo. or $49/yr. for Pro
Wunderlist is such a powerful productivity tool that Microsoft bought it earlier this year, Apple named it App of the Year in 2013, and The Verge named it best to-do list app in 2014. And unless you want features like unlimited task delegation and file uploads, the free version offers just about everything you’ll likely need.
In a nutshell, this tool lets you create to-do lists you can then share with friends, family, or coworkers — who will have editing capabilities of their own. And the UX doesn’t get messy, even when both people are working on a list at the same time. For example, I use Wunderlist to share a grocery list with my roommate. Sometimes, we’ll go to the grocery store together and tackle the list simultaneously — and it’s actually fun to check things off and watch her check things off at the same time.
Finally, it’s sleekly designed and very user-friendly. Adding and checking off list items is simple and intuitive, as is adding and checking off sub-tasks, adding a due date, adding any reminders you may want, and so on.
Image Credit: AppAdvice
Earlier this year, the service integrated with Slack to show its tasks and notifications in the work-collaboration tool while its users chatted in real time. To enable integration with Slack, here’s what you need to do:
- Sign in to Slack. Click on your company name in the top left corner, then choose “Configure Integrations” from the dropdown menu.
- Under “All Integrations,” find “Wunderlist” and click “Add.”
- Select or create a Slack channel, and then click on “Add Wunderlist Integration.”
- Once you’ve authenticated Wunderlist, all you have to do is choose a list from your Wunderlist and click on “Save Integration.” Boom, done.
2) Todoist
Price: Free for Basic, $29/yr. for Premium
Although Todoist has been around for a while, it’s become especially powerful in just the last few years. This tool includes a ton of great features that let you organize tasks by date, color-code them, and so on.
The free version has fewer features than Wunderlist’s free version, but it’s very well-designed and user-friendly. You can create sub-tasks and dependencies, projects, and sub-projects. You can attach due dates to these tasks, prioritize them using a color-coding system, categorize them, and more. The premium account costs $29 per year and includes push notifications, email reminders, labels, and filters.
Todoist is available for (and looks great on) every major platform: the web, iOS and Android apps, desktop apps for Windows and OSX, add-ons for Firefox and Chrome, plug-ins for email apps like Gmail, Thunderbird, and Outlook, and more. Not to mention, it integrates with services like Google Drive, Sunrise Calendar, and IFTTT.
3) Trello
Price: Free for Basic, $8.33/user/mo. for Business Class, or $20.83/user/yr. for Enterprise
Trello is the online project management tool that our blogging team uses here at HubSpot. It lets you drag, drop, color-code, and manipulate to-do list items in a way that many of the other tools on this list don’t.
You can arrange larger projects into “boards,” under which you can add all sorts of lists to break down that bigger project into sub-projects. Under each list, you can add what they call “Cards,” which are items in a list. You can add a due date, a checklist, notes, attachments, and color-coded labels to each card. You can also drag and drop cards between lists and boards.
Image Credit: Cloud Couch
My favorite thing about Trello is that it lets you visualize your to-do list in a way that’s easy to follow — including a calendar view. In the calendar view, you can see what your upcoming tasks look like a week or a month at a time. You can also drag and drop cards between calendar days to change their due dates.
Image Credit: BlueGlass
The free version lets you create unlimited boards, lists, cards, members, checklists, attachments, and so on, and allows integration with Box, Google Drive, and Dropbox. The paid versions allow for more storage, more customization, stricter privacy options, and other added features.
4) ToodleDo
Price: Free
Here’s a task management tool some of the most organized people in my life swear by. ToodleDo is a very user-friendly tool for organizing simple to-do lists on your iOS and Android devices and on the web. It’s heavily focused on tasks, and that’s what the tool does best. Under each task, you can sub-tasks, additional notes, priority ratings, due dates, and reminders. You can also organize your tasks into different folders.
While it used to lack some of the aesthetic that other apps (especially Wunderlist) do well, it recently went through a redesign that did wonders for its design. Here’s a before and after shot, with the updated version on the right:
Image Credit: ToodleDo
Although it’s mostly for task management, there are also sections of the tool where you can take notes, create outlines, and even track your habits, like in the screenshot below. You can also share your lists, collaborate with others, and assign tasks to anyone you’d like.
Image Credit: ToodleDo
5) Any.DO
Price: Free for Basic, $26.99/yr. for Premium
Any.Do is one of the more beautifully designed apps on this list. It offers all of the features you’d want in a to-do list app, including drag-and-drop and swipe-to-complete, but there are a few things that make it stand out.
For example, its key differentiator is “the moment”: a push notification you get each morning telling you to plan your day. There are also a few other cool and delightful features in there, like voice entry and the ability to shake your device to clear finished tasks.
Image Credit: Tech Norms
It’s designed for the iPhone but can be used on iPad, as well as on the web and desktop with full syncing. Lifehacker named the app its favorite to-do app for iPhone, although the folks there admit it isn’t as intuitive or as robust in terms of features as other apps like Wunderlist and Todoist. It also has a Chrome extension with a four-star rating and over 2,000 reviews. Here’s a video that’ll walk you through its user interface and capabilities:
Any.DO Moment from Any.DO on Vimeo.
6) Things
Price: $9.99
“If it were a car, it would be a VW Golf — sleek, efficient, and a joy to use,” reads one review of Things on DailyMacReview.com. That sums up the user experience pretty well: It’s intuitive, well designed, and very simple.
Image Credit: Things
For some, though, its simplicity might be a big turnoff. Another review reads, “If you are an avid GTDer [Get-Things-Done] who wants the most powerful tool with a plethora customization options, I recommend you steer clear of Things.”
If all you want in the app is a beautiful design and the ability to organize simple tasks and lists — and you have ten bucks to spare — then Things could be a good bet. If you like the idea of checking things off on your Apple Watch, it also offers full Apple Watch Support. Otherwise, though, you might be better off going with something more complex.
7) TickTick
Price: Free for Basic, $1.99/mo. or $19.99/yr. for Pro
TickTick is a relatively new player, but it has a lot of potential. Like many of the other tools on this list, you can add new tasks, sub-tasks, set deadlines and custom reminders, and share with other users. You can also set recurring to-do list items for every day, a specific number of days, a week, a month, and so on.
The Pro version has a great calendar view where you can see what your to-do list looks like on a daily or weekly basis and get ahead of the game. You can drag tasks to change the order, and drop tasks into the calendar on the bottom left to set a due date. It also has revision history and an “experimental labs” feature.
This tool is still in its early stages, but so far, it’s a beautiful interface with a solid — and growing — feature list. Keep an eye out for updates and check out their plans here.
Image Credit: Lifehacker
8) Google Keep
Price: Free
Google Keep has existed under the radar for a long time, but it’s actually a great tool if you’re looking for a place to quickly make and save lists and notes and access them across multiple devices. At its core, it’s a simple notepad that connects to Google Drive, where you can keep checklists, photos, voice notes, and other text notes that sync across multiple devices as well as the cloud.
Image Credit: ShareChair
It doesn’t have nearly as many features as other to-do list apps, and its design isn’t as regimented — but if you’re an avid Google Drive user and like to create and edit lists on-the-go, then this could be a great option for you. You can learn more in this video:
9) OmniFocus
Price: $39.99 for Standard, $79.99 for Pro
Don’t let the price tag deter you: If you’re an iOS user with a lot of different projects and tasks to track, and you’re looking for an app that organizes all these items in a super comprehensive way, then you’ll want to check this out.
On the tool’s home screen, you’ll find a forecast summary of your upcoming to-do’s, as well as color-coded badges that show you what needs attention at-a-glance. Whenever you think of a new to-do list item or task, you can quickly enter them into your “Inbox,” during or after which you can apply this item to a specific folder, list, or context.
While most people would prefer something a little simpler, this is a great option for power users that are cool with a bit of a learning curve.
Image Credit: OmniGroup
10) HabitRPG
Price: Free
This one is for the video game lovers among us — or anyone interested in quite literally gamifying their life. HabitRPG a habit-building app available on Google Play that turns your to-do list items and projects into a medieval-themed, role-playing game. You can level up your character when you succeed, earn money to buy weapons and armor, and defeat enemies — just by crossing things off your list.
If you miss deadlines or fail to cross things off, then you’ll take hits to your health and your character will lose progress. You can categorize your achievements into folders like “Career & Finances,” “Fitness & Health,” “Friends & Family,” and so on.
If you’re looking for a tool that’ll simply help you build good habits and encourage you to cross things off your to-do list, then this is a good option for you. Plus, you can compete with your friends to help hold yourself accountable. Get a better idea of how it works in this video:
What are you favorite to-do list tools? Share them with us in the comments.
True Confessions: Are You Guilty of These Marketing & Sales Pitfalls? [Video]
Sometimes, it’s really tempting to cut corners.
It’s the end of the month. You’ve got an aggressive goal to hit. Will anyone really be that mad if you buy that list or make a couple cold calls? You promise — it’s just this once.
But we all know how easy it is for that excuse to fall by the wayside. That thing you did just once spirals out of control, and pretty soon you’re relying on that tactic every single month.
Turns out, there is a better way to market and sell. And for us to actually work toward making that inbound vision a reality, we’ve got to fess up to our mistakes.
We’ll start. Check out the video below to see some pitfalls marketers and salespeople face — and get resources for avoiding them in the future.
Want to confess your own prospecting pitfalls? Use the meme generator below.
12 Businesses With Fantastic LinkedIn Company Pages
Over the past several years, LinkedIn quickly evolved from a cocktail party for recruiters and job seekers to something much more substantial: an epicenter for content — particularly branded content.
LinkedIn’s evolution began in May 2012 with the acquisition of SlideShare, and it continued with the purchase of news reader app Pulse. Later that year, the social network got into the original content game with the launch of the LinkedIn Influencer Program, which features posts from the likes of Richard Branson and Suze Orman. And by February 2014, they opened up their publishing platform to all members.
All of those moves have turned LinkedIn into a place where people come to consume professional content. That’s been great news for brands, since it’s given them a new audience to reach with their content — via their Company Pages on LinkedIn.
Let’s look at 12 businesses that are capitalizing on the opportunity and rocking it. I think you might be surprised to find that both B2B and B2C companies are working to get the most out of their pages.
Click here to download our free guide about how to create a fantastic LinkedIn Company Page of your own.
12 of the Best LinkedIn Business Pages (And What Makes Them Great)
1) Coca-Cola
Coca-Cola’s LinkedIn Page regularly highlights content from Coca-Cola Journey, the company’s digital magazine that’s churned out over 2,000 stories since its launch in November 2012 and seen huge success, especially on social. Though 59% the magazine’s audience is in the 18–35 year-old demographic, they see a lot of interaction from the company’s 917,000+ followers on LinkedIn.
“LinkedIn is a huge traffic driver for us,” explains Co-Managing Editor Jay Moye. “That’s obviously a different audience. It’s a professional audience. It’s professional social network versus more of a social network. We see great clickthrough rates on story links that we publish on LinkedIn. The percentage of clickthroughs is markedly higher than it is on Facebook, and to a degree, Twitter.”
Moye and the Coca-Cola team choose which content to share on LinkedIn with that professional audience in mind.
“You’ll see more consumer-focused content go up on our Facebook page,” explains Moye, “whereas you’ll see more business innovation, jobs, workplace stuff go up on LinkedIn. That’s kind of a no-brainer. It’s obviously an older, more professional audience on LinkedIn.”
2) AppleOne
As an employment agency, AppleOne could simply push their job openings on LinkedIn and call it a day. Instead, they share awesome advice for job seekers both from their blog and from other outlets like The Muse and PopSugar. Their LinkedIn description also includes information that differentiates them from other, similar companies, while touching on their core mission. For example, they write:
AppleOne Employment Services is unique in that we view the career seeker as a client. Other employment agencies see you as a commodity to be sold, and it shows in the way they treat you. Our services are always free to our associates, and we encourage you to take full advantage of them.”
Mission and vision statements are great differentiators to add to your LinkedIn Page’s description.
3) Mashable
Mashable made LinkedIn’s list of the Best LinkedIn Company Pages of 2013 (which was presented, of course, in a SlideShare) and it’s easy to see why. Mashable has tons of potential content to share, but on LinkedIn, they primarily dish out business and productivity tips, such as “How to Succeed at Business Without Becoming a Workaholic.”
And while they publish a lot of articles on “sillier” topics (like “adorkable” pandas) on their main website, they stick to business-related topics when posting updates on LinkedIn to appeal to the more professional audience that spends time there.
Their social media-focused content generates a lot of engagement, too: A post featuring “If ‘House of Cards’ Characters Used LinkedIn,” for example, hits all the right notes.
4) L’Oréal
For businesses that have multiple entities under one name, LinkedIn Showcase Pages make it easy to segment content to spotlight a specific business brand or product. L’Oréal, for example, owns a lot of different, popular brands like Lancôme, Yves Saint Laurent, and Redken. By creating different Showcase Pages for each one, L’Oréal can engage and share relevant content with each of their specific target audiences.

5) Four Seasons Hotels and Resorts
The purpose of the Four Seasons Hotels and Resorts LinkedIn Page seems to be to make me really regret studying writing in college instead of studying hotel and restaurant management. Yes, Four Seasons, I do wish that I could work at your sexy new wine, cheese, and chocolate bar on the beach.
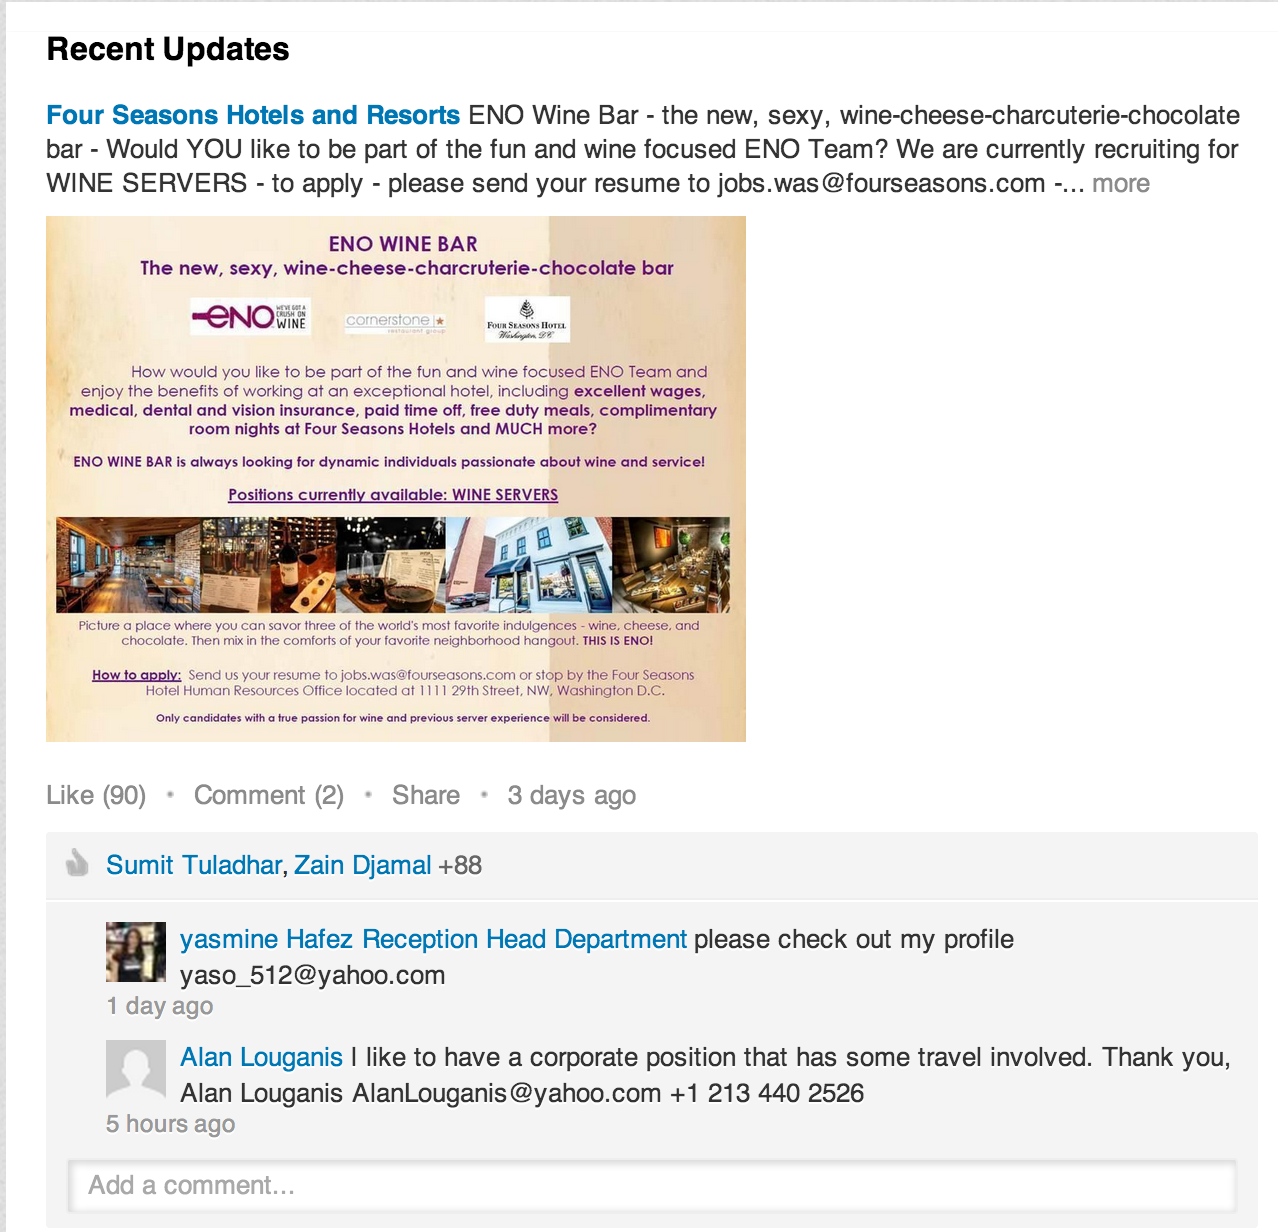
They also mix in some fun content, like this caption contest:
Overall, the Four Seasons goal on LinkedIn is pretty obvious: Make the hotel chain look both like a company that you’d like to work for, and a place you want to stay.
6) The Nature Conservancy
Like AppleOne, The Nature Conservancy puts their mission statement front-and-center in their LinkedIn Company Page description to let professionals visiting their Page know what they’re all about. They also drive engagement by posting compelling rich media and thumbnails in updates that link back to blog posts from their own blog, as well as other blogs whose content resonates with their target audience.
7) BlackRock
At a LinkedIn conference in 2013, BlackRock’s then-Global Director of Social Media Eileen Loustau estimated that LinkedIn was driving $17-18 million dollars of revenue for the financial investment company. That’s because of the sophisticated pieces of investment advice that BlackRock shares on their LinkedIn Page, such as “Your Core Portfolio: The Case for ETFs.”
“We sometimes call it chapter four,” Loustau said of the investment company’s strategy and skipping the basics and focusing on more complex content.
8) Evernote
The folks at Evernote publish a lot of great content to their Company Page, but their pinned updates are especially noteworthy here. Whenever Evernote releases a new feature, they post an update and then pin it to the top of their Recent Updates section. That way, anyone visiting their Page can see the news right away, even if they’ve published other updates since. This move helped them earn a spot on LinkedIn’s “Best of Company Pages” in 2014.
9) IBM
IBM topped the LinkedIn rankings with 1.8 million interactions back in 2012, and they haven’t slowed down since. They’ve added nearly a million and a half followers, and over 2.5 million people now subscribe to the company’s updates. The technology giant shares a nice mix of stories from around the web and their own content hub.
They also do a great job of cross-promoting IBM’s other online assets, like their Tumblr posts and hashtag campaigns that span multiple social platforms. Here’s a recent post featuring their #HackAHairDryer campaign, which you’ll notice follows brief, compelling copy:
10) Marketplace Home Mortgage
Despite having just 872 followers at the time, Marketplace Home Mortgage made LinkedIn’s list of best company pages of 2013. Why? Because the relatively small company does a great job of curating useful and interesting content for home buyers, and curating it with strong hooks — evidence that small businesses can excel on LinkedIn, too. Now they have over 1,600 followers and follow a lot of great LinkedIn best practices, including pinning a simple, succinct status to the top of their Company Page that lets visitors know they’re hiring:
11) HP
HP rocks LinkedIn with a pretty fascinating and diverse array of content: thought leadership, big data analysis, and even simple, branded graphics. They post a lot of these simple graphics, like this one:
Their posts consistently draw hundreds of interactions from their 2.1+ million followers, and their Career tab is chock-full of videos and testimonials from current employees. This is LinkedIn done right.
12) Hays
If you’ve got it, why not flaunt it? Hays makes their claim as the #1 recruiting firm in the world right on their LinkedIn banner. They also use that space to promise to delivery helpful, relevant content to their followers — and they practice what they preach. Their status updates are often links to their own blog posts on great topics like “A Simple Guide to Writing the Perfect Resume/CV,” from which they draw a lot of engagement from their followers.
Another thing Hays does well? They acknowledge their followers directly, and even ask what they want to see more of. Here’s an example of a recent post, in which they thank their YouTube viewers and ask them what types of videos they’d like to watch next. Bonus: They included a hashtag (#WhatCouldYouBe) with this ask so that folks can share their thoughts either on LinkedIn or another social channel.
Which other companies are rocking LinkedIn? Share with us in the comments.
Editor’s Note: This post was originally published in May 2014 and has been updated for freshness, accuracy, and comprehensiveness.
The Kurt Vonnegut Guide to Great Copywriting: 8 Rules That Apply to Anyone
Kurt Vonnegut was not a copywriter … but he could have been.
That’s what dawned on me after reading “How to Write with Style,” an essay Vonnegut published in the 1985 anthology, How to Use the Power of the Printed Word. In it he outlines the eight rules for great writing — rules that can be applied to any type of writing, including copywriting.
How’s this possible? How can a novelist and a copywriter base their work off of the same standard principles?
Because every writer is working with the human condition. That’s why you’re gonna want to read this.
To prove it, let’s take a closer look at Vonnegut’s rules. You’ll notice that I’ve outlined a takeaway under each to highlight how copywriters can use it to command attention and influence action.
The Kurt Vonnegut Guide to Great Copywriting
1) “Find a subject you care about.”
Vonnegut writes:
Find a subject you care about and which you in your heart feel others care about. It is genuine caring, and not your games with language, which will be the most compelling and seductive element in your style.”
Takeaway: Whether you’re composing a sales letter, writing a blog article, or sculpting a landing page, if you’re not passionate about the product or service you’re selling, it will come through in your copy.
How can a copywriter force himself or herself to care about teakettles if they hate tea? Or cat food if they love dogs? Or boat propellers if they’re plagued by seasickness? Here’s what I recommend:
- Be selective about the projects you take on. If you don’t like guns, writing web copy for a hunting site might not be a good fit for you. That’s a personal call — and it’ll require your brutally honest evaluation.
- Research like crazy. If you do choose to tackle an unfamiliar topic, get your hands dirty. Dive into your new product, service, or industry headfirst. The more you know, the more you’ll care.
2) “Do not ramble, though.”
Vonnegut writes:
I won’t ramble on about that…”
Takeaway: Good copy is concise. Don’t use three words when one will do.
3) “Keep it simple.”
Vonnegut writes:
Simplicity of language is not only reputable, but perhaps even sacred.”
Takeaway: Good copy is also clear. Don’t make the reader think. Your message should be easy to understand. If it’s not, you run the risk of losing your prospect. So, how can copywriters keep their message simple?
- Use clean, short, understandable words. Be incredibly clear. Don’t write “utilize” when you can say “use,” or don’t write “tenebrous” when you can say “dark.”
- Use clean, short, understandable sentences. Don’t fear periods, go easy on the adverbs, and avoid the passive voice. Here’s a great site that can help you do this.
Keeping it simple isn’t easy, but it’s the right thing to do for your reader.
4) “Have the guts to cut.”
Vonnegut writes:
If a sentence, no matter how excellent, does not illuminate your subject in some new and useful way, scratch it out.”
Takeaway: It doesn’t matter how beautiful your sentence is, if it doesn’t speak to your target audience and make the reader crave the next sentence, it’s probably best to delete it. A copywriter’s end goal is to fluidly move prospects down the page until they reach a call-to-action, which, then, asks them to move on to the next step of the buying process. Fluff will only serve to disrupt that process. And that negates the whole purpose of copy. So go ahead, cut.
5) “Sound like yourself.”
Vonnegut writes:
I myself find that I trust my own writing most, and others seem to trust it most, too, when I sound most like a person from Indianapolis, which is what I am.”
Takeaway: Write naturally. Pick a persona to target and write as if you’re speaking to that one individual and no one else. Sound like yourself and the copy will take on a unique, one-of-a-kind tone.
6) “Say what you mean to say.”
Vonnegut writes:
“I used to be exasperated by such teachers, but am no more. I understand now that all those antique essays and stories with which I was to compare my own work were not magnificent for their datedness or foreignness, but for saying precisely what their authors meant them to say. My teachers wished me to write accurately, always selecting the most effective words, and relating the words to one another unambiguously, rigidly, like parts of a machine. The teachers did not want to turn me into an Englishman after all. They hoped that I would become understandable — and therefore understood.
And there went my dream of doing with words what Pablo Picasso did with paint or what any number of Jazz Idols did with music. If I broke all the rules of punctuation, had words mean whatever I wanted them to mean, and strung them together higgledy-piggledy, I would simply not be understood. So you, too, had better avoid Picasso-style or jazz-style writing if you have something worth saying and wish to be understood.”
Takeaway: Good copy is, first and foremost, understood. That’s why good, conversion-driven copywriters won’t be caught dead distracting readers with fluff. Respect your readers’ time. Minimize their cognitive expenditure.
7) “Pity the readers.”
Vonnegut writes:
“Readers have to identify thousands of little marks on paper, and make sense of them immediately. They have to read, an art so difficult that most people don’t really master it even after having studied it all through grade school and high school — twelve long years.
So this discussion must finally acknowledge that our stylistic options as writers are neither numerous nor glamorous, since our readers are bound to be such imperfect artists. Our audience requires us to be sympathetic and patient teachers, ever willing to simplify and clarify, whereas we would rather soar high above the crowd, singing like nightingales.”
Takeaway: You may be a wordsmith and an artist. Your prose may sing. And that’s great … but it doesn’t make it okay to write wordy copy. Successful copywriters know that long-winded copy won’t get the job done. It’s all about being clear and concise because catering to the reader will be rewarded with trust, credibility, and action. So do your readers — and yourself — a favor: Show mercy.
8) “For really detailed advice.”
Vonnegut writes:
“For a discussion of literary style in a narrower sense, a more technical sense, I commend to your attention The Elements of Style, by Strunk, Jr. and E.B. White. E.B. White is, of course, one of the most admirable literary stylists this country has so far produced.
You should realize, too, that no one would care how well or badly Mr. White expressed himself if he did not have perfectly enchanting things to say.”
Takeaway: Always provide readers with value. Fail to do so and all the other rules on this list become obsolete. Value is born when your copy solves a specific problem for your reader. Or when it assuages a fear. Or when it meets a desire.
Informative content is valuable. So is entertaining content. Ultimately, providing value is fundamental to the success of any piece of copy because in its absence, what’s there to care about?
So next time you sit down to write your next blog article or sales letter or landing page, ask yourself: Who’s this for? What do they want or need? And, perhaps, what would Kurt do?
What do you think of these writing rules? Share your thoughts in the comments section below.
Nothing is Original: Why the Most Talented People Copy (And Why That’s OK)
This post originally appeared on Agency Post. To read more content like this, subscribe to Agency Post.
We have an insatiable thirst for the new.
In business, we want new products, new campaigns, and new ways of reaching consumers.
The shiny object syndrome isn’t just about being easily distracted. It’s also the result of thinking that what is new — and seemingly unique — is better.
So how can we meet the increasing demands to come up with new ideas under shorter deadlines?
Mark Earls believes we need to get better at copying — badly.
“Copying lies at the heart of creativity,” writes Earls in Copy, Copy, Copy: How to Do Smarter Marketing by Using Other People’s Ideas, which was released earlier this year.
Why Copying Makes Us Uncomfortable
Earls’ background is in planning — previously at St Luke’s and as the executive planning director for the EMEA division at Ogilvy & Mather in London. He also has published three other books, including Herd: How to Change Mass Behaviour by Harnessing Our True Nature and I’ll Have What She’s Having: Mapping Social Behavior. These previously published books deal more with insights on how people are social beings and how that relates to consumer behavior. Copy, Copy, Copy is the playbook for applying those insights to come up with new ideas, which is based on copying the success of others.
But this idea of copying is uncomfortable for many people — especially those in agencies whose value to clients lies in the ideas it produces.
He writes:
Our culture has a very strong individualist strand: we prize the individual over the group and distrust those who don’t have a strong sense of authentic self, who don’t ‘know their own mind’, ‘self-actualize’, ‘sing their own song’ or whatever metaphor is popular down the dark self-help aisle in the bookstore.
We pride ourselves on the uniqueness of our ideas, our thoughts, and our expressions. So the thought of saying that we copied someone else’s ideas would mean that we are not smart enough or creative enough or inventive enough to develop our own ideas.
We worship originality, but actually, copying is an innate human skill — one we need for survival. We copy to learn, to understand, and to gain social status by mimicking others.
And this focus on individualism is mostly a product of North American and European cultures.
“We’re the unusual ones,” Earls said. “We’re the ones that think almost everything in human behavior is going to be explained by individuals and what goes on between and individual and peers. Everyone else seems to think human beings are, first and foremost, social creatures, and that much of what shapes human behavior is between them, not in between their ears.”
In the book he points to the idea of Ubuntu, a South African philosophy, that is described as: “which sees man as a fundamentally social being, rather than a ‘host of individual entities that cannot help being in constant conflict.’”
While many marketers think of consumers as concerned about “me,” much of the world thinks in terms of “we.” And this is often how people actually make decisions.
“Without people copying each other, things don’t spread very fast or very far,” Earls said. “It’s human-see, human-do.”
Why You Should Copy — Badly
There are two types of copying. The first is replication or machine-like copying.
Copying with the intention to “exploit the intellectual and financial effort involved in making something new and better” is how copying gets a bad rap, writes Earls.
The second type is human copying, which Earls says naturally creates error — this is the kind of copying you need to master.
The point is to copy badly (or loosely), to copy with the point of including variations or to fix known problems. You can also copy from “far away” — studying other industries and applying these to your own.
Earls mentions an example of this “from a distance” copying: In the early 1800s, Joseph Marie Jacquard invented the Jacquard loom, which used laced together wooden punch cards to simplify the creation of complex textile designs. This system made it possible to created highly detailed, intricate weaving patterns quickly and accurately. This machine is inspired early computer technology that used punch cards to control data processing.
How to Copy to Create Better Ideas Faster
Copy, Copy, Copy isn’t about using someone else’s idea as the foundation of a new idea. And it certainly doesn’t condone copy cat advertising or blatant plagiarism.
Instead, Earls provides a pattern book, a term originally used in architecture, for copying previously used and successful strategies.
“We live in an agile age,” Earls said. “We’ve got to move faster than we’ve ever done before. Traditional strategy and creative strategy thinking isn’t yet equipped to do that. I found myself bemused by why it would take 6 months to come up with a fairly original and vague idea. That’s not good enough anymore. We have to work much harder.”
Here are three examples from Copy, Copy, Copy to show how copying an approach to problem solving can lead to unique insights for a brand problem:
“Dramatically Over-Engineer Better: This is one of the signature trends in modern marketing: 20 years ago, SUVs were a minority working vehicle, now few school runs are without vehicles capable of competing in and completing the Paris-Dakar Rally. The same is true of the wristwatch business – while the elegantly simple and the cheap and simple are still around, the explosion of diving or aviator watches worth thousands of dollars (often worth more than a car) is remarkable. Indeed, the over-engineering of leisure clothing is legion – from sportswear to expeditionary equipment. These ‘extreme’ outdoor clothing brands are popular at a local North London bus stop: North Face, Annapurna and Patagonia. Being good enough to climb mountains in or wade mighty rivers in makes them ideal for any challenges you might encounter on the 29 bus (or even the 253).”
“Promote an Unusual and Irrelevant Feature: The mainstream beer market has been prone to this for some time. In the US, there was a phase when the nature Appalachian water used to brew with was a point of difference. In the UK, we had ‘widgets’ in cans to recreate the qualities of draught beer.”
“Make Packaging a Badge of Identity: Few packaging designs have real social identity. Coke’s classic bottle shape is an exception. As Martin Lindstrom points out, it is unmistakeable, even when broken and denotes both product qualities and authenticity but more importantly the shared identity of Coke drinkers Gateway computers used Friesian-patterned boxes to signal a different kind of computer was being delivered to a different kind of user – someone who clearly knows what’s what. Department stores like Selfridges and Bloomingdales have both created highly visible (and expensive) bags in order to use the fashion-set as walking endorsements of their brands.”
He also suggests drawing as a way to come up with ideas or to reveal connections.
People — especially those in our industry — tend to rely on jargon and what he calls “verbal fireworks.” Drawing forces us to be precise and to show the steps and connections in a real way.
He writes:
Time and again in our work we come back to the truth of this – to the importance of drawing as a mode of thinking, rather than a complement to it, or an afterthought. Drawing and thinking are closely related. Indeed, in many important ways, it’s worth assuming drawing IS thinking.
In addition, these strategy frameworks and the mapping tool he provides make it possible for anyone on a team to be involved in ideation. You don’t need a psychology degree or an understanding of neuroscience.
“I think that anything that excludes the talent we’ve got in the room from making contributions should be stopped,” Earls said. “This approach seems to bring into the strategy that player who’s not normally been allowed a voice.”
Copy the Starting Problem for More Creative Results
Copying has long been the go-to tool for the most innovative and creative people — from scientists to athletes to artists to musicians.
Most problems are like other problems, which means most solutions requires similar approaches. It’s the errors, the small variations, made by the hands of a person newly approaching the issue, that makes anything truly unique.
As Earls’ writes, “It’s what we learn from each other — what we copy — that allows us to create new things.
7 Body Language Mistakes You Should Never Make in a Meeting
This post originally appeared on HubSpot’s Sales Blog. To read more content like this, subscribe to Sales.
Stop me if you’ve heard this one before.
“Mabel, Mabel, sweet and able, get your elbows off the table!”
Whether the lesson stuck with you or not, the rhyme’s message is clear: Etiquette and body language are important. And this is especially true in business.
Any time you’re in a face-to-face meeting with a customer, colleague, or partner, your body language is crucial. What you say is just as important as how you say it — and how you look when you say it. Don’t let these mistakes derail your next meeting or distract from your message.

Share This Image on Your Site
<p><strong>Please include attribution to Blog.HubSpot.com with this graphic.</strong><br /><br /><a href=’http://ift.tt/1Xax3wa’><img src=’http://ift.tt/1Qw5Gh5′ alt=’7 Cringeworthy Body Language Mistakes Salespeople Make During Meetings’ width=’600px’ border=’0′ /></a></p>
7 Essential Metrics Healthcare Marketers Need to Focus On
When we talk about data analytics and measuring ROI, there are several standards that we use to categorize success—website visits, number of new contacts and revenue gains or losses. These are all helpful metrics and should be taken into consideration in any marketing report. However, there are loads of different ways to measure success in digital marketing, and success looks different from industry to industry—particularly in the healthcare industry.
If you’re in healthcare, the majority of your marketing efforts are likely focused on gaining and keeping new patients. In order to effectively evolve your digital marketing strategy over time, your data analysis should also focus on customer (patient) acquisition and retention.
Here’s a breakdown of the top 7 metrics you should be analyzing on a regular basis.
1) Patient Acquisition Cost
This is probably the most relevant metric, as your whole marketing budget will be based around this number. How much does it cost to acquire a new patient? Take into account that different sources – referrals, paid search, social media, etc. – may have different costs per lead, but that all are valuable ways of generating new patients. Don’t forget to factor in the lifetime value of a patient, in order to see the full view. It may seem like a lot to spend $500 per acquisition, but if the patient’s lifetime value is over $10,000, then the initial investment is worth it.
How to calculate:
Traditional marketing would have you divide all the costs for marketing within a certain period of time by the number of new patients acquired. This method, though, only gives you a surface-level look and it doesn’t allow for a deep analysis into which activities are most effective at bringing in new patients. However, with digital marketing, you can actually track a lead from a PPC ad to a landing page conversion to becoming a patient. Or, from a social post to a “Contact Us” form submission to becoming a patient. Each of these activities will have different costs-per-customer and will allow you to see where you need to allocate your budget based on what’s most effective in your market.
2) Patient Retention
It’s not enough to gain a lot of new patients—you need to keep them coming back. One loyal patient will do more good for your bottom line than 10 new patients. Loyal patients not only spend more over their lifetime, they also are great brand evangelists and will likely recommend you to their friends and family if you continue to delight them with your treatment and services. In your analytics, be sure to highlight returning patients.
How to calculate:
To calculate patient retention rates, you’ll need to know how many existing patients you have and how many you gained or lost over a set period of time. If math isn’t your thing, Inc.com has a great formula to easily calculate your retention rate.
3) Customer Service Response Time
This is a metric that often trips healthcare organizations up. Customer service is for shopping, right? Wrong. Great customer service is the best way to make your healthcare organization stand out from the crowd. It’s especially important in today’s digital age as it becomes easier for complaints and bad reviews to be spread far and wide online.
Patients care about how they’re treated and their experiences at each of their appointments, but it doesn’t end there – they also care about how they’re treated outside of your office, through appointment reminders, follow-ups and response time to their questions and concerns. The level of service and treatment they receive can make or break your relationship with them. Give your staff goals and don’t simply think about email and phone call response times, make sure you’re taking social media response times into account, as well. And remember, social media users expect responses within an hour.
How to calculate:
Facebook is now starting to track customer service response time for brand pages. You can also have your digital team log the time of each incoming inquiry and the time of each response.
4) Engagement
Engagement metrics are often considered “soft metrics,” meaning they don’t show a definitive ROI. Yet, engagement metrics can be incredibly helpful in evaluating your overall brand awareness and message penetration into the market. Plus, with marketing automation platforms, you can attribute patients to certain sources and gain insight into how they originated in your database.
With HubSpot, for example, you can use the “Sources” report to show which social media leads became customers. You can also set up custom lead scoring to assign a certain number of points to each contact for certain actions they take – such as downloading a checklist or clicking on an email. This is another great way to measure engagement, as you can quickly see which leads are interacting with your content the most based on their score.
How to calculate:
Set up Lead Scoring in HubSpot, track leads and analyze their scores over time to see if there is an optimal score which signifies someone will soon become a patient or customer.
5) Effectiveness of Premium Content
Speaking of content, be sure to do ongoing analysis into your most effective pieces of premium content. Which ones are downloaded the most? Which ones have a higher lead-to-customer conversion rate? Knowing this will help guide your future content strategy. It can also help you pinpoint which resources should be reworked or retired.
If your checklist, “Things to Know Before Surgery,” brings you the most leads on social media, it might also be a good resource to test in PPC (pay per click) ads. If your infographic, “Top Tips for a Healthy Heart,” brought in hundreds of leads two years ago but has dropped off lately, it may be time to redesign it with fresh graphics.
How to calculate:
Track the submission rate for each landing page (percentage of views which resulted in a form submission). If you’re getting a ton of views but have a low submission rate, rethink the design of your landing page or analyze whether your copy aligns with what the resource actually offers.
New content is great, and you should always be thinking about creating new premium content pieces, but don’t forget to continue to optimize and refresh your existing pieces. To go even deeper, track the customer rate (the percentage of views that became customers) and run campaigns around your strongest performing content.
6) Search Engine Rankings
This is an important metric in any industry, but is especially important in healthcare, where local search ranking is key to attracting new patients. Monitor your ranking for branded and non-branded keywords relevant to your organization.
Additionally, keep your eye on each keyword’s difficulty and the number of monthly searches it collects. In some cases, there might be a keyword we like to call the “low hanging fruit” – one that has a low difficulty score and high number of monthly searches – that you can easily rank for. Then, adjust your website keyword optimization strategy as needed.
How to calculate:
There are several great tools out there which will allow you to see how you rank for keywords and how you stack up against your competition. Try HubSpot’s Keyword Tool or Moz Local.
7) Overall Campaign Evaluation
Think of this as almost a mini report unto itself. At the end of each campaign, do a recap to evaluate how successful it was. Different campaigns will have different goals. Some, such as an April “Heart Health” campaign, may be more about raising awareness around an issue, so metrics to track should be engagement-based.
Others, such as a “Schedule Your Annual Check-up” campaign, may be about raising awareness and about increasing the number of scheduled appointments, so the metrics you track should be both engagement- and revenue-based. Evaluating your campaign based on your original goals will help you to determine its success, as well as make suggestions for and strategize future campaigns.
Digital marketing has opened up a vast influx of data and the trick is making sense of it all. What metrics have you used in the past and how are you adapting your analysis?
To learn more about how to reach and engage with different audiences, download our Next Generation Healthcare Marketing white paper.
How to Design Graphics That’ll Boost Your Conversions [Free Ebook]
Gone are the days where “I’m not creative enough” or “I don’t have any design experience” serve as sound excuses for avoiding design entirely. Thanks to new technology, it’s possible for pretty much anyone to create optimized graphics to support their campaigns and lead generation efforts.
With photos in tweets averaging a 35% boost in retweets and captions under graphics being viewed 300X more than body copy on average, compelling graphics have become an increasingly important part of the marketing plan.
Need help getting started? We teamed up with the folks at Canva to create an awesome, free design guide, How to Design Graphics That Convert. We cover how to design graphics to promote your content on social media, landing pages, email marketing, CTAs, and paid ads. Designed to increase conversion rates, these graphics will help your content perform better, generate more leads, and reach a bigger audience.
In this guide, you’ll discover:
- How to create stunning graphics for promoting your content
- The science of CTA optimization
- How to boost conversions by tweaking your landing pages
- How to create high-performing paid graphics
Ready to start designing? Click here to download How to Design Graphics That Convert.
Want to spread the love? Share this resource with your network:
“How to increase leads from your graphics: design with conversion in mind http://hubs.ly/H01r2KD0 Awesome guide from @Canva @HubSpot.” [Click to Tweet]
“The experts @Canva & @HubSpot put together this visual guide on how to create graphics that convert! http://hubs.ly/H01r2M10” [Click to Tweet]
16 Captivating Data Visualization Examples
Data can be very powerful. If you can actually understand what it’s telling you, that is.
It’s not easy to get clear takeaways by looking at a slew of numbers and stats. You’ve got to have the data presented in a logical, easy-to-understand way.
Enter data visualization. The human brain processes visual information better than it processes text — so using charts, graphs, and design elements, data visualization can help you explain trends and stats much more easily.
But not all data visualization is created equal. (Just check out “Why Most People’s Charts and Graphs Look Like Crap” to see what I mean.)
So, how do organize data in a way that’s both compelling and easy to digest? Get inspired by the following 16 examples of data visualization that communicate interesting information with both style and substance.
Click here to download our free guide to data visualization for more data visualization examples and tips.
What is Data Visualization?
Data visualization refers to representing data in a visual context, like a chart or a map, to help people understand the significance of that data.
Whereas data in text form can be really confusing (not to mention bland), data represented in a visual format helps people extract meaning from that data much more quickly and easily. You can expose patterns, trends, and correlations that may otherwise go undetected.
Data visualization can be static or interactive. For centuries, people have been using static data visualization like charts and maps. Interactive data visualization is a little bit newer: It lets people drill down into the dirty details of these charts and graphs using their computers and mobile devices, and then interactively change which data they see and how it’s processed.
Ready to feel inspired? Let’s take a look at some great examples of interactive and static data visualization.
Examples of Interactive Data Visualization
1) Why Buses Bunch
Here’s a wonderful example of a complex data set boiled down into what that looks and feels like a game. In this visualization, the folks at Setosa are showing how “bus bunching” happens, i.e. when a bus gets delayed and later causes multiple buses to arrive at a single stop at the same time.
Telling this story in numbers alone would be pretty difficult, but instead, they turn it into an interactive game. While the buses rotate along a route, we can click and hold a button to delay a bus. Then, all we have to do is watch to see how even a short delay causes the buses to bunch together after a time.
2) Languages in the World
This interactive by DensityDesign does an impressive job of introducing the non-linguist (aka most of us) to the many world languages. All 2,678 of them.
This piece allows you to explore common languages families, see which languages are most spoken, and view where languages are spoken around the world. This is great visual storytelling: taking an in-depth subject and breaking it down in an easy-to-understand way.
3) Percent of U.S. Population by Age Group
This is a strong example of how to present a single data set in a compelling way. Pew Research created this animated GIF composite to show shifts in population demographics over time. It’s a great way to tell a larger story in a neat package.
Plus, this type of micro-content is easy to share on social or embed in blogs, extending the content’s reach. If you want to make a GIF of your own using Photoshop, here’s a step-by-step tutorial.
4) The Complete History of the NFL
The world of sports is rich with data, but that data isn’t always presented effectively (or accurately, for that matter). The folks over at FiveThirtyEight do it particularly well, though. In this interactive visualization below, they calculated what’s called an “Elo rating” — a simple measure of strength based on game-by-game results — for every game in the history of the National Football League. That’s over 30,000 ratings in total. Viewers can compare each team’s Elo to see how each team performed across decades of play.
5) U.S. Thanksgiving on Google Flights
Here’s a great way to visualize things moving around in space over a given time. This one is powered by Google Trends, which tracked flights as they few to, from, and across the United States on the day before Thanksgiving. The visualization starts at the very beginning of the day and plays like a movie as time goes on, showing flights moving around the country. Without showing any numbers beside the time, viewers can see which times of day are more popular for international flights, for domestic flights, and for flights to and from different hubs around the country.
6) What’s Really Warming the World?
Ever heard a version of the advice, “Don’t simply show the data; tell a story with it”? That’s exactly what this visualization from Bloomberg Business does — and it’s the interactive part that makes the story move along from beginning to end.
The point of the visualization is to disprove theories that claim that natural causes explain global warming. The first thing you’ll see is the observed temperature as it’s risen from 1880 to present day. As you scroll down, the visualization takes you through exactly how much different factors contribute to global warming in comparison to what’s been observed, adding a richer layer of storytelling. The conclusion the authors want viewers to draw is made very clear.
7) A Guide to Who is Fighting Whom in Syria
Relationships among many different groups can be difficult to understand — especially when there are 11 of them, many of which are on the same side as groups they’re normally at odds with, and vice versa. Now that’s confusing. But using a table format and familiar visuals and colors, the folks at Slate did a great job simplifying this data into a simple, digestible, and interactive format.
Viewers can click on any of the faces for a succinct description of the relationship.
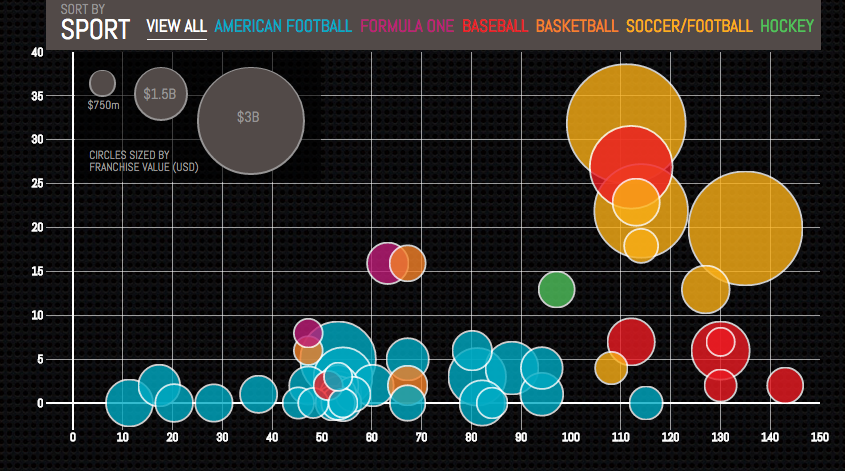
8) Most Valuable Sports Franchises
Here is an example of telling a deeper story by adding data. This interactive, created by Column Five, was inspired by Forbes’ “Top 50 Most Valuable Sports Franchises 2014” list. But instead of just visualizing the list, the interactive also lets users see the number of years each team has competed, as well as number of championships won. This offers a more comprehensive view of the each team’s history and success as a franchise.
9) U.S. Wind Map
Here’s a visualization similar to the Thanksgiving flights one, except this time, it shows all present wind speeds and directions in the U.S. in real time. It’s a great example of intuitive design: Speed is represented by lines moving slowly or quickly, and direction is represented by which way the lines are moving. It’s immediately clear what the general trends are without any need for numbers unless you click into the map itself. Plus, capping the number of variables at two makes it even easier to follow.
Examples of Static Data Visualization
10) Where News Audiences Fit on the Political Spectrum
Usually, when a designer has a lot of text that can’t be left out, they’ll usually organize that information into a data table in order to make it more compact, according to the folks at Pew Research Center. But they went for a distribution plot instead. Why? Because a distribution plot lets viewers see where each media outlet lies on a spectrum. On a spectrum, the distance between each media outlet is significant. If these outlets were just listed one after the other in a table, viewers wouldn’t be able to see where each one stood in context.
11) The Daily Routines of Famous Creative People
This data visualization is a simple concept executed fantastically. Using information from the book Daily Rituals by Mason Currey, the site showcases the daily schedules of famous creatives broken down by time and activity. Not only is this an example of engaging data (as you can explore the schedules by individual activity), it’s also a fantastic editorial piece for a brand.
12) The Year in News
The best data visualizations communicate information and do so in an intuitive and beautiful way. Echelon Insights nailed it with this piece, which visualizes the most talked-about news stories of 2014 on Twitter. What do 184.5 million tweets look like? Rad spin art.
13) The Depth of the Problem
When you want to illustrate scale, static data visualization can be a great way to make your point. The infographic below from The Washington Post is incredibly long … and that’s on purpose. In this case, they’re showing how crazy far a deep-sea signal from an airplane can be detected by comparing that depth to tall buildings, the maximum depth of known mammals, the depth of the Titanic wreck, and so on. It’s a great use of simple visuals and color gradients. Finally, adding data to a news story (in this case, the missing Malaysian airliner) is a great way to provide context.
(For the full size visualization, click here)
14) Funding the Final Frontier
While the infographic above is pretty simple, there are ways to create well-designed infographics that deliver a large amount of data. The secret? A simple and clean format that makes it easy for readers to understand the data. This infographic, created by GOOD Magazine and Column Five, breaks down NASA’s five-year budget to show how and where the money will be spent. Plus, it has an on-theme design — an all-around win.
15) Caritas Kontakladen Annual Report
Not all data visualizations need to be animated. When real-world data is visualized with real-life examples, the results can be stunning. Designer Marion Luttenberger took a unique approach to the data contained in Caritas Kontakladen’s annual report. The organization provides support to drug addicts in Austria, so Luttenberger focused on communicating the mission through real-life visuals. For example, this shopping cart visualization represents how much of life’s necessities a welfare recipient can afford each day.
16) Austria Solar Annual Report
While there are many ways to visualize data, using the information subject to actually create the data visualization (follow me here) can be pretty profound. This annual report from Austria Solar uses actual solar power to bring the company’s data to life through solar-activated inks on the page. In a word: Genius.
What are you favorite examples of data visualization? Share them with us in the comments.
Editor’s Note: This post was originally published in March 2015 and has been updated for freshness, accuracy, and comprehensiveness.