How to Boost a Post on Social Media [Instagram, Facebook, and Twitter]
In the social media marketing world, marketers reminisce about the times when they could fill up on organic reach like our parents reflect on their college years with that old saying, “those were the good old days.”
As time has flown by, social media’s purge of organic reach flung marketers onto a rollercoaster ride trying to figure out how to boost a post for customers to actually see — which is a challenge when you’re up against so many competitor ads.

With almost 3 billion social media users today, millions of brands have promoted their content on these platforms for years. But the popularity of social media has flooded each platform with hoards of articles, photos, and videos, skyrocketing the supply of content while the demand for it has plateaued. This has lowered the amount of opportunities that brands can leverage to interact naturally with customers.
Needless to say, social media marketing is a pay-to-play strategy now. And one of the most effective ways to leverage paid social media advertising is by boosting your posts. So let’s talk about what post boosting is and how to do it across different platforms.
How to Boost a Post on Social Media
1. Click the “Boost Post” button at the bottom of your post.
2. Select a goal.
Before you boost your post, Instagram will ask you whether you want to attract more profile visits, website traffic, or promotion views. Whatever your goal is for the specific post you want to boost, make sure you choose the option that best aligns with it.
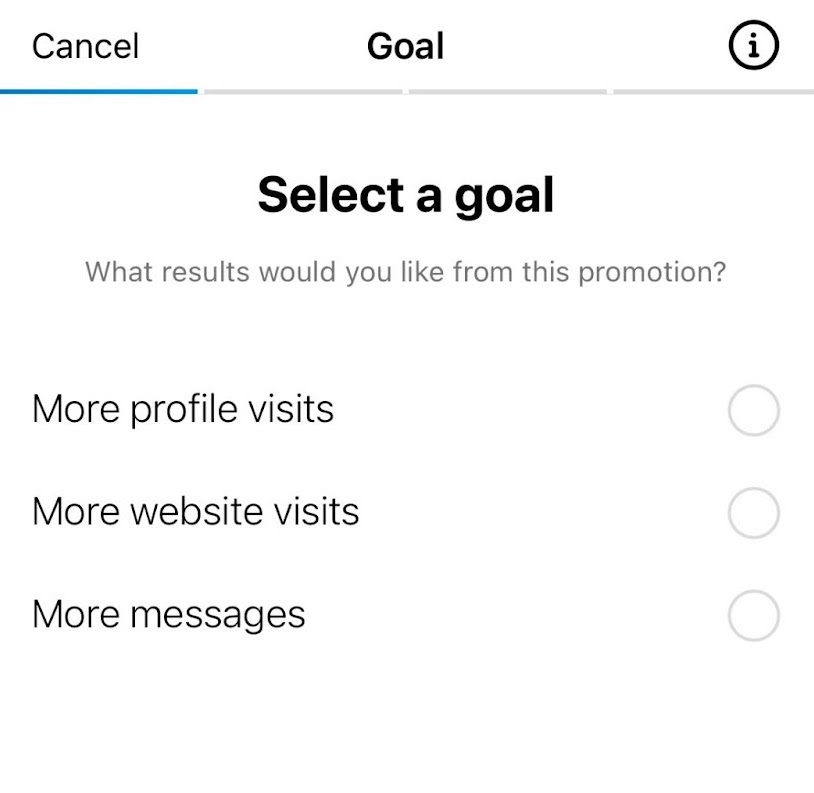
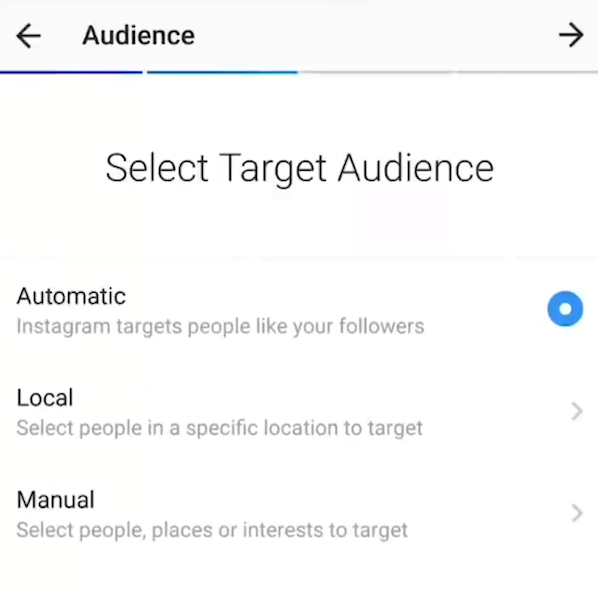
3. Choose an audience.
After choosing your goal, you can pick from three different targeting options: Automatic, Local, and Manual.
- Automatic tells Instagram to target people who are just like your followers.
- Local lets you target people in a specific location.
- Manual lets you target specific people, places, or interests.
4. Set your budget and duration.
Instagram will estimate the expected reach and clicks that your post will attract after you set your post’s budget and ad duration.

5. After review, boost your Instagram post.
After you’ve set your budget and duration, Instagram will prompt you to review the parameters you’ve set, and once you’re finished, you can boost your business’ Instagram post.
Next, let’s go over how to boost your post on Facebook.
1. Pick an existing post on your Facebook business page that you want to boost.
Log in to your Facebook business page and choose the pre-existing post you wish to promote.
2. Click “Boost Post” on the bottom right corner of your Facebook post.

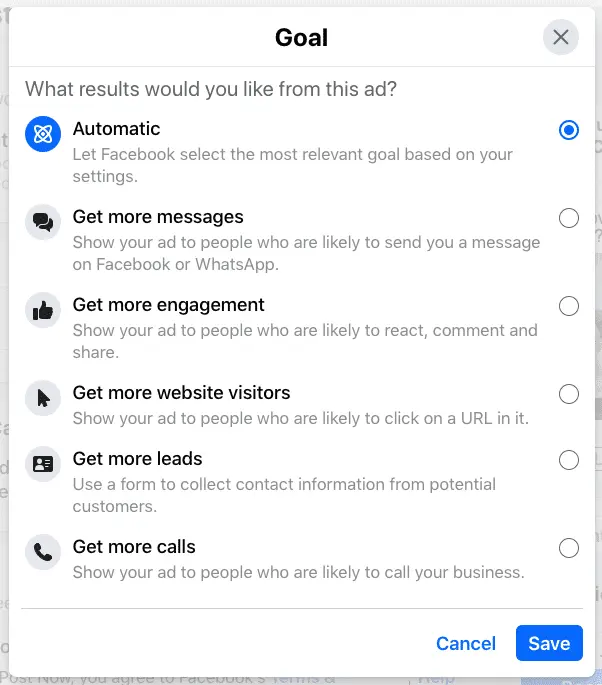
3. Set a goal.
You need to determine the intention or goal of your ad, and Facebook offers several different options to choose from.
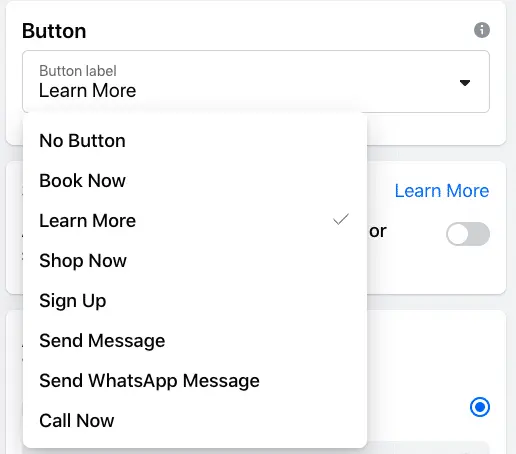
4. Choose your call-to-action.
This is what you want your audience to interact with and provide them with a way to engage with your business.
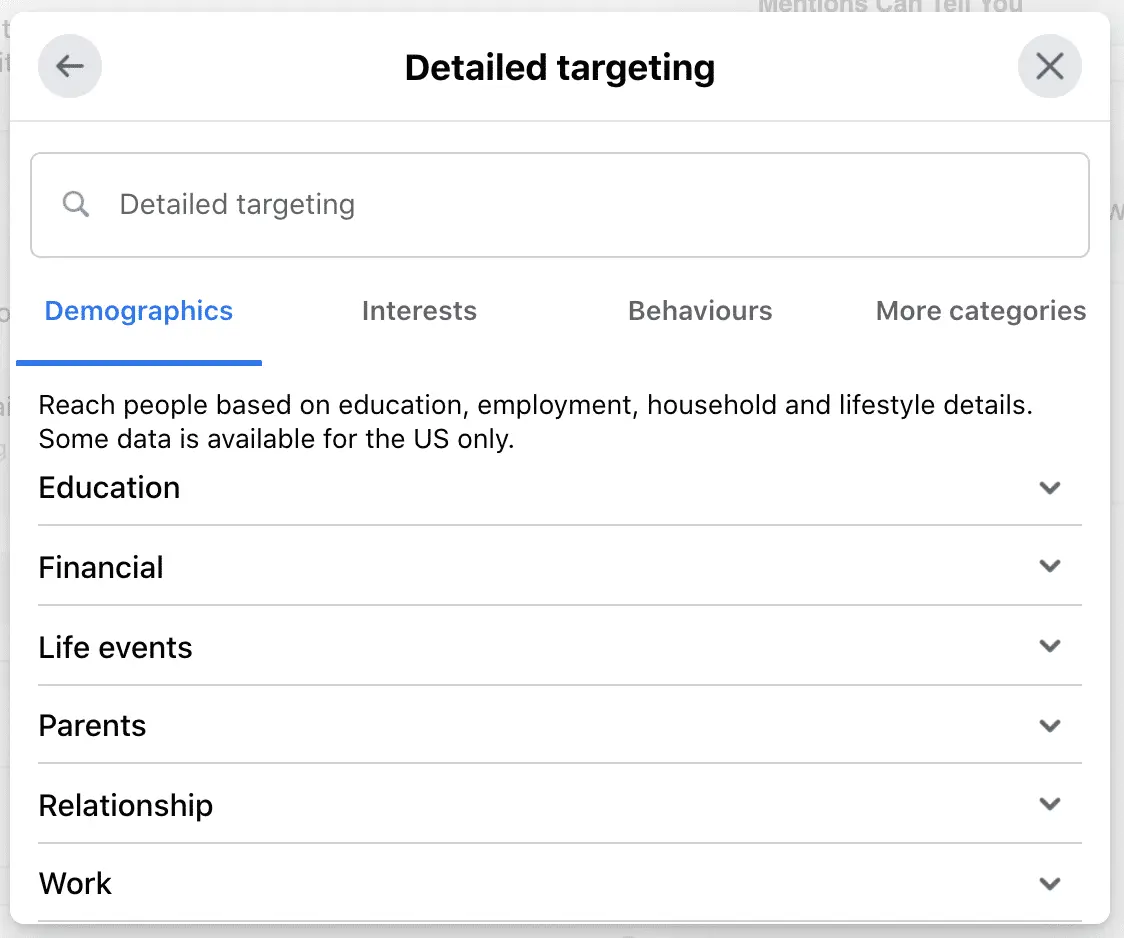
5. Choose your detailed targeting.
Before you boost your Facebook post, you can either distribute your post to a recommended audience that Facebook will make for you or create a new audience based on a robust set of targeting options and distribute your post to them.
6. Set your boosted post’s budget and duration.
Your budget is how much money you’ll spend to boost your post, and your duration is how long you’ll boost your post for. Facebook will estimate how many people your post will reach based on your budget and duration.
7. Review and boost your Facebook post.
When you’ve gone over the parameters set for the ad, click “Boost” and you’ve successfully boosted your Facebook post.
But if you followed these steps to boost your post and ran into an “Error”, there are a few reasons why.
Why can’t I boost my Facebook post?
If you find yourself unable to boost your Facebook post, the post may go against Facebook’s advertising policies page.
Here are two of the most common explanations:
- Your post includes language alluding to “personal attributes” like race, gender, sexual orientation, religion of specific groups of people.
- Your post makes assumptions about the person reading with phrases such as “Are you…” or “… in your area.”
Now that you know how to effectively boost a Facebook post, when should you do it?
When to Boost a Facebook Post
Even though there’s not an exact science to boosting posts, there’s a couple indicators to follow.
Oftentimes, Facebook will actually notify you to boost your post on your business page. When this happens, it’s in your best interest to do so, as it will push you to reach a more broad audience than you currently have.
But even if you aren’t directly notified, boosting a new post on Facebook will still yield increased engagement, but it’s not recommended to boost the same post more than seven days consecutively. You run the risk of making your audience bored or tired of your content.
Now let’s dive into how to boost your business’ Tweets.
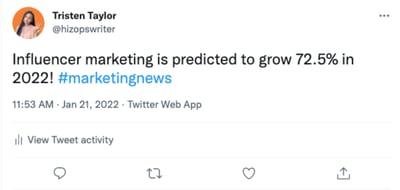
1. Click “View Tweet Activity” at the bottom of your Tweet.
2. Click “Promote Your Tweet”. 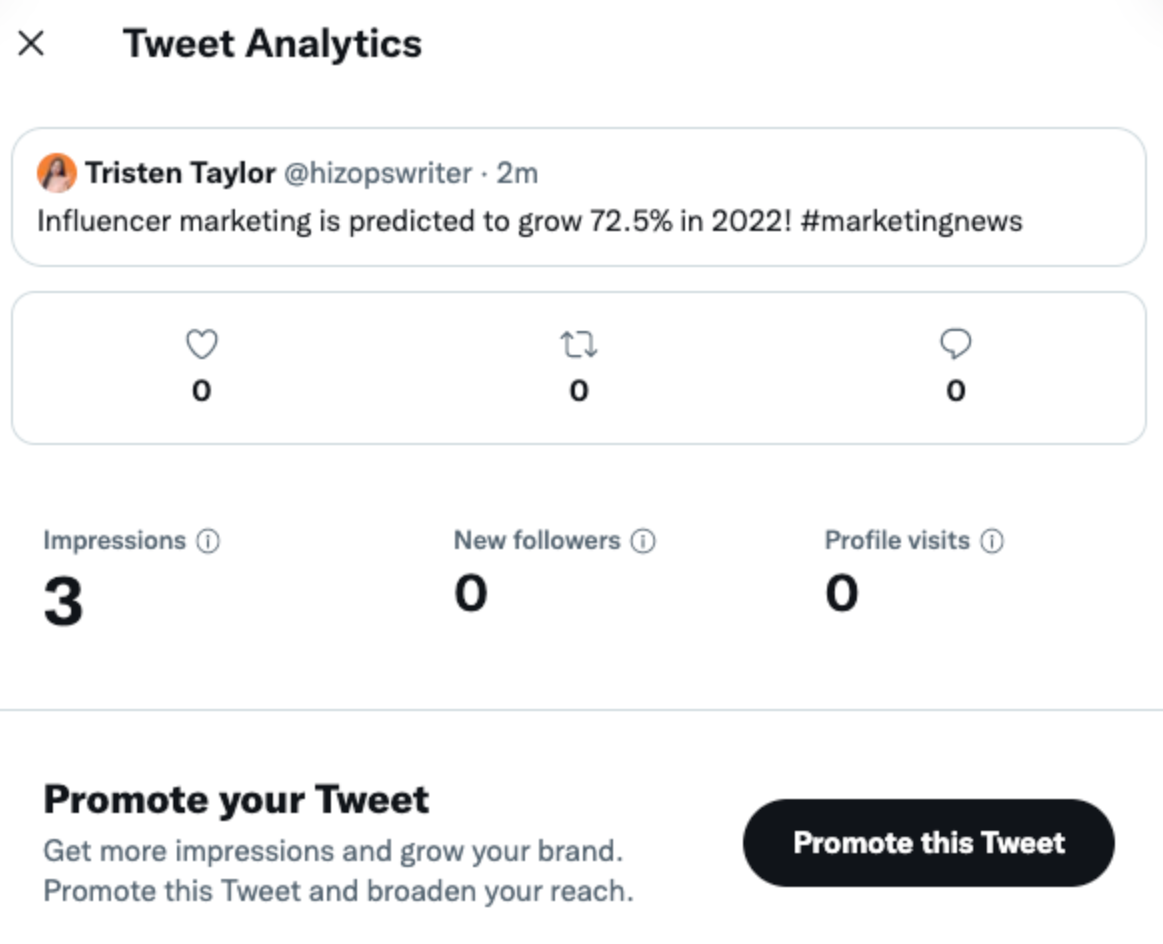
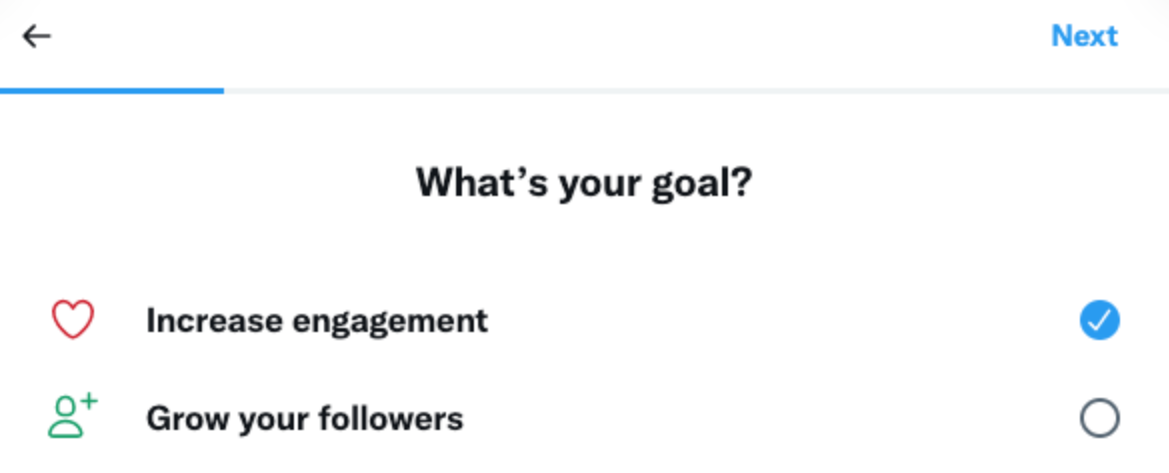
3. Determine your goal.
State the goal you’re boosting your Tweet for.
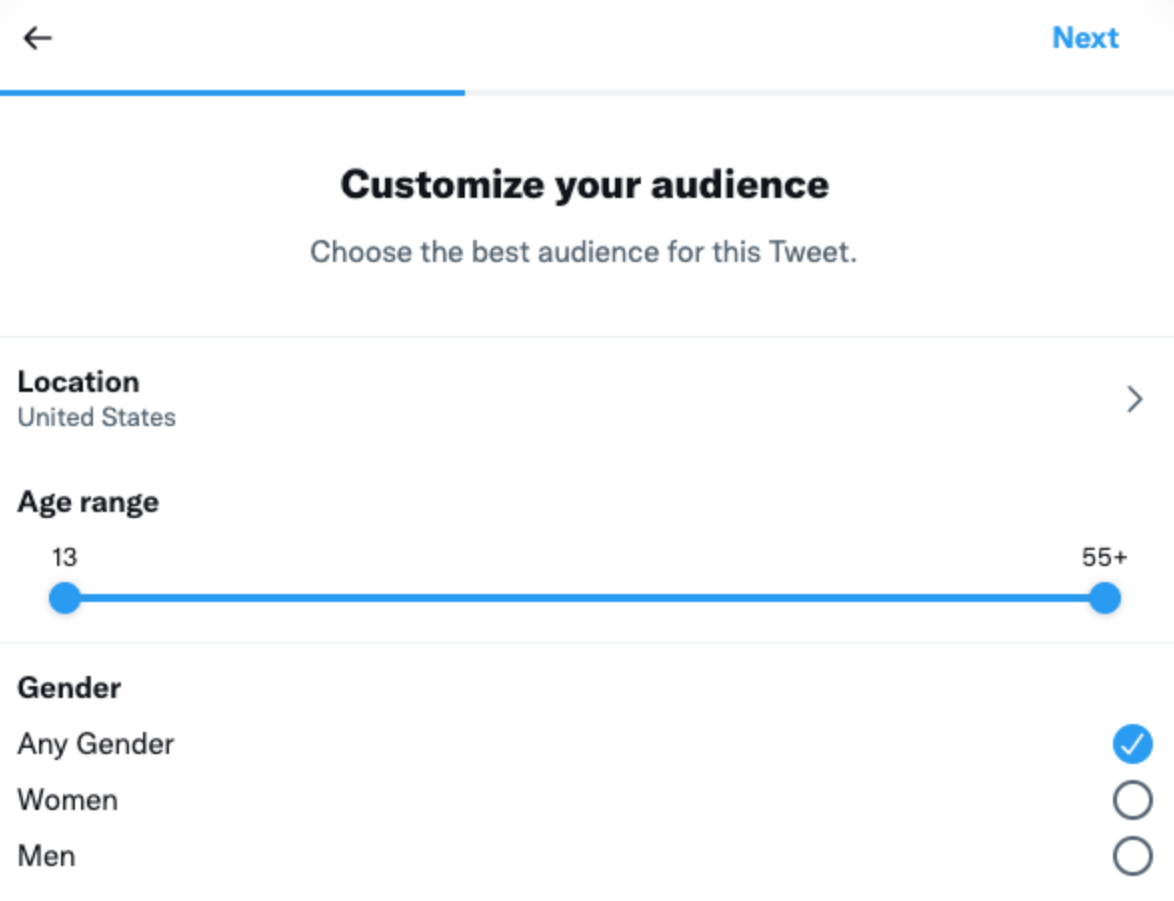
4. Customize your audience and targeting.
You can only target your audience based on:
- Location: Country, state/province/region, or metropolitan area
- Age: Ages 13 to 55+ years old
- Gender: Man, woman, or any identity
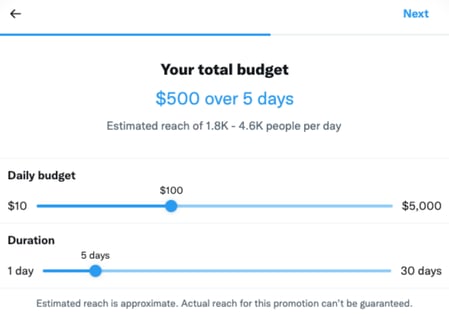
5. Set your budget.
After setting your budget, Twitter will estimate the amount of impressions and engagements your boosted Tweet will attract.
6. Review and create your promotion.
Twitter will then prompt you to review the parameters you’ve chosen, and once you’ve finished, you’re ready to create your promotion.
Now that you know how to boost your posts across different platforms, it’s time that we went over the benefits of boosting a social media post.
Why You Should Boost a Post
1. To reach your target demographic in a cost-effective way.
Boosting a post with parameters set to reach your target market, or people that fit your ideal buyer persona, saves you money from advertising to people who won’t derive value from the product or service you’re offering.
2. To increase brand awareness on a platform.
You can make your brand’s identity more well-known and recognizable with repetition coupled with engaging content. By boosting posts on social media platforms that your target audience frequents most, you can increase brand awareness.
3. To collect useful metrics to study for your marketing strategy.
For each post you boost, you can look at the metrics each platform will provide you in terms of traffic, engagement, and demographics reached. Use that information to study which posts performed the best, and build on those strengths for future marketing campaigns.
Give Your Content the Boost It Needs
Capturing the interests of your target audience may not be as easy as it used to be, but by using paid social media advertising like the boost feature, you’re increasing your chances of finding new clients. We hope this post gave you the information you needed to boost your social media ads to achieve your next business goals.
Editor’s note: This post was originally published in April 2019 and has been updated for comprehensiveness.

How to Create Detailed Buyer Personas for Your Business [Free Persona Template]
Marketing Margie. Sales Sam. IT Isabel. Accounting Alan.
Do you know who your business’s buyer personas are? And if so, how much do you know about them?
Buyer personas are semi-fictional representations of your ideal customers based on data and research. They help you focus your time on qualified prospects, guide product development to suit the needs of your target customers, and align all work across your organization (from marketing to sales to service).
As a result, you’ll be able to attract high-value visitors, leads, and customers to your business who you’ll be more likely to retain over time.
More specifically, having a deep understanding of your buyer persona(s) is critical to driving content creation, product development, sales follow up, and really anything that relates to customer acquisition and retention.
“Okay, so personas are really important to my business. But … how do I actually make one?”
Ahh … the million-dollar question. The good news is, they aren’t that difficult to create. It’s all about how you obtain your market research and customer data, and then present that information within your business.
Follow along with this guide and download these persona templates to simplify this process. Before you know it, you’ll have complete, well-planned buyer personas to show off to your entire company!
Before we dive into the buyer persona-creation process, let’s pause to understand the impact of well-developed buyer personas on your business (most specifically, your marketing efforts).
Why exactly are buyer personas so important to your business?
Buyer personas help you understand your customers (and prospective customers) better. This makes it easier for you to tailor your content, messaging, product development, and services to meet the specific needs, behaviors, and concerns of the members of your target audience.
For example, you may know your target buyers are caregivers, but do you know what their specific needs and interests are? What is the typical background of your ideal buyer? In order to get a full understanding of what makes your best customers tick, it’s critical to develop detailed personas for your business.
The strongest buyer personas are based on market research as well as insights you gather from your actual customer base (through surveys, interviews, etc.).
Depending on your business, you could have as few as one or two personas, or as many as 10 or 20. But if you’re new to personas, start small — you can always develop more personas later if needed.
What about “negative” buyer personas?
While a buyer persona is a representation of your ideal customer, a negative — or “exclusionary” — persona is a representation of who you don’t want as a customer.
For example, this could include professionals who are too advanced for your product or service, students who are only engaging with your content for research/ knowledge, or potential customers who are just too expensive to acquire (because of a low average sale price, their propensity to churn, or their unlikeliness to purchase again from your company).
How can buyer personas be used in marketing?
At the most basic level, developing personas allows you to create content and messaging that appeals to your target audience. It also enables you to target or personalize your marketing for different segments of your audience.
For example, instead of sending the same lead nurturing emails to everyone in your database, you can segment by buyer persona and tailor your messaging to what you know about those different personas.
Furthermore, when combined with lifecycle stage (i.e. how far along someone is in your sales cycle), buyer personas also allow you to map out and create highly targeted content. (You can learn more about how to do that by downloading our Content Mapping Template.)
And if you take the time to also create negative personas, you’ll have the added advantage of being able to segment out the “bad apples” from the rest of your contacts, which can help you achieve a lower cost-per-lead and cost-per-customer — and, therefore, see higher sales productivity.
Different Types of Buyer Personas
While beginning work on your personas, you may ask yourself, “What are the different types of buyer personas?” From there, it’d be simple to adjust one for your business — right?
Well, that’s not exactly how it works — there isn’t a set list of universally-recognized buyer personas to choose from, nor is there a standard for the number of personas you need. This is because each business (no matter how many competitors they have) is unique — and for that reason, their buyer personas should be unique to them, too.
For these reasons, identifying and creating your different buyer personas can, at times, be slightly challenging. This is why we recommend using HubSpot’s Make My Persona generator (as well as HubSpot’s persona templates) to simplify the process of creating different personas.
In general, companies may have the same, or similar, categories for their buyer personas (e.g. a marketer, an HR rep, an IT manager, etc.). But the different personas your business has and the number of them your business requires will be tailored to who your target audience includes and what you offer your customers.
Now, are you ready to start creating your buyer personas?
How to Create Buyer Personas
Buyer personas can be created through research, surveys, and interviews — all with a mix of customers, prospects, and those outside your contacts database who might align with your target audience.
Here are some practical methods for gathering the information you need to develop personas:
-
Look through your contacts database to uncover trends about how certain leads or customers find and consume your content.
-
Use form fields that capture important persona information when creating forms to use on your website. For example, if all of your personas vary based on company size, ask each lead for information about company size on your forms.
-
Consider your sales team’s feedback on the leads they’re interacting with most. What generalizations can they make about the different types of customers you serve best?
- Interview customers and prospects to discover what they like about your product or service.
Now, how can you use the above research to create your personas?
Once you’ve gone through the research process, you’ll have a lot of meaty, raw data about your potential and current customers. But what do you do with it? How do you distill all of it so it’s easy for everyone to understand all the information you’ve gathered?
The next step is to use your research to identify patterns and commonalities from the answers to your interview questions, develop at least one primary persona, and share that persona with the rest of the company.
Use our free, downloadable persona template to organize the information you’ve gathered about your persona(s). Then share these slides with the rest of your company so everyone can benefit from the research you’ve done and develop an in-depth understanding of the person (or people) they’re targeting every day at work.
Here’s how to work through the steps involved in creating your buyer personas in more detail.
1. Fill in your persona’s basic demographic information.
Ask demographic-based questions over the phone, in person, or through online surveys. (Some people are more comfortable disclosing personal information like this.)
It’s also helpful to include some descriptive buzzwords and mannerisms of your persona that you may have picked up on during your conversations to make it easier for people on your team to identify certain personas when they’re talking to prospects.
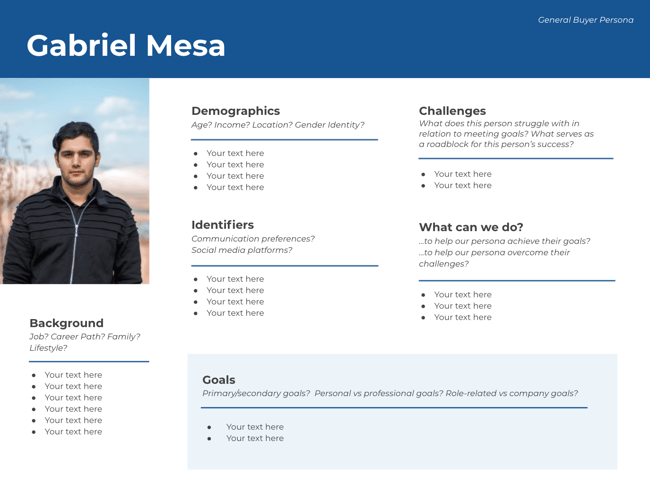
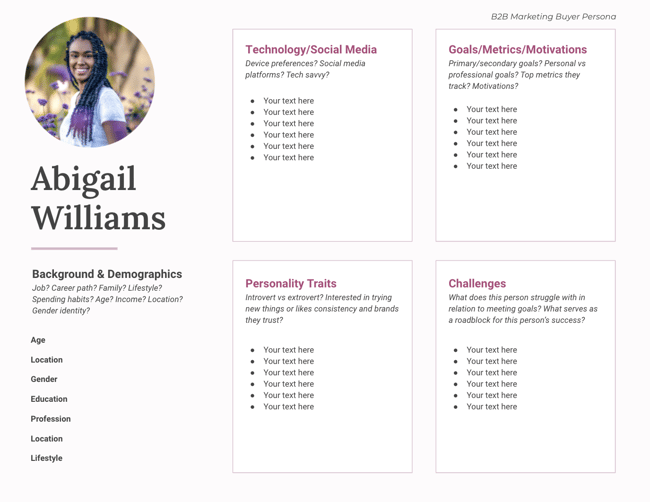
Here’s an example of how you might complete Section 1 in your template for one of your personas:
2. Share what you’ve learned about your persona’s motivations.
This is where you’ll distill the information you learned from asking “why” during those interviews. What keeps your persona up at night? Who do they want to be? Most importantly, tie that all together by telling people how your company can help them.
Download this Template
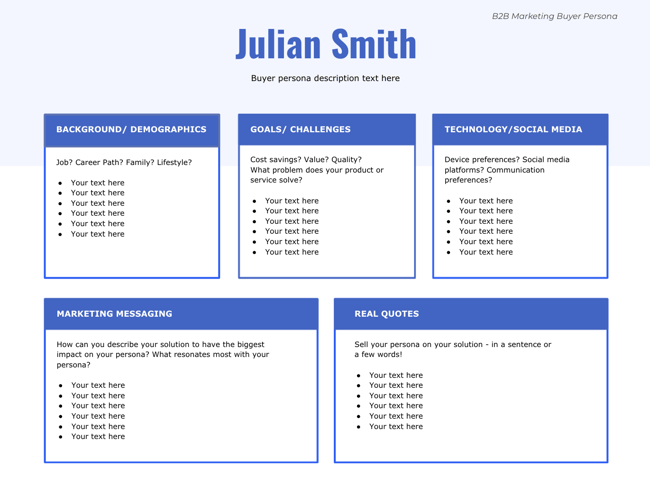
3. Help your sales team prepare for conversations with your persona.
Include some real quotes from your interviews that exemplify what your personas are concerned about, who they are, and what they want. Then create a list of the objections they might raise so your sales team is prepared to address those during their conversations with prospects.
Download this Template
4. Craft messaging for your persona.
Tell people how to talk about your products/ services with your persona. This includes the nitty-gritty vernacular you should use, as well as a more general elevator pitch that positions your solution in a way that resonates with your persona.
This will help you ensure everyone in your company is speaking the same language when they’re having conversations with leads and customers.
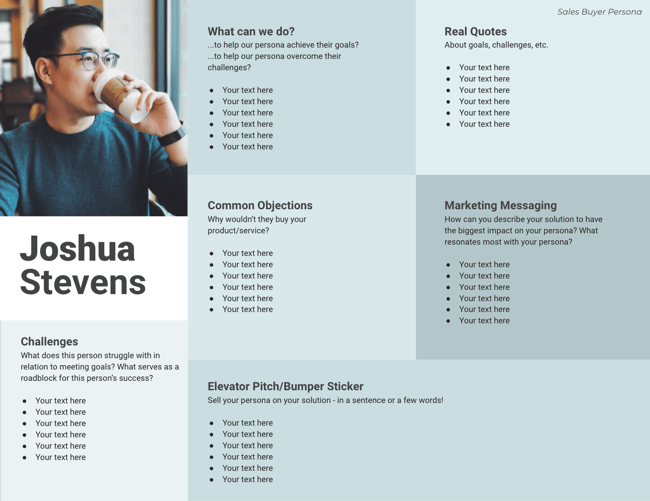
Finally, make sure you give your persona a name (e.g. Finance Manager Margie, IT Ian, or Landscaper Larry) so everyone internally refers to each persona the same way, allowing for cross-team consistency.
How to Find Interviewees for Researching Buyer Personas
One of the most critical steps to establishing your buyer persona(s) is finding some people to speak with to suss out, well, who your buyer persona is.
That means you’ll have to conduct some interviews to get to know what drives your target audience. But how do you find those interviewees? There are a few sources you should tap into:
1. Use your current customers.
Your existing customer base is the perfect place to start with your interviews because they’ve already purchased your product and engaged with your company. At least some of them are likely to exemplify your target persona(s).
Don’t just talk to people who love your product and want to spend an hour gushing about you (as good as that feels). Customers who are unhappy with your product will show other patterns that will help you form a solid understanding of your personas.
For example, you might find that some of your less happy customers have bigger teams and need greater collaboration functionality from your product. Or, you may find they find your product too technical and difficult to use. In both cases, you learn something about your product and what your customers’ challenges are.
Another benefit to interviewing current customers is that you may not need to offer them an incentive (e.g. gift card) to do so. Customers often like being heard — interviewing them gives them a chance to tell you about their world, their challenges, and what they think of your product.
Customers also like to have an impact on the products they use. So, as you involve them in interviews like this, you may find they become even more loyal to your company. When you reach out to customers, be clear that your goal is to get their feedback, and that their feedback is highly-valued by your team.
2. Use your prospects.
Be sure to interview people who have not purchased your product and don’t know much about your brand, too. Your current prospects and leads are a great option here because you already have their contact information.
Use the data you do have about them (i.e. anything you’ve collected through lead generation forms or website analytics) to figure out who might fit into your target personas.
3. Use your referrals.
You’ll probably also need to rely on some referrals to talk to people who may fit into your target personas, particularly if you’re heading into new markets or don’t have any leads or customers yet.
Use your network — such as your coworkers, existing customers, social media contacts — to find people you’d like to interview and be introduced to. It may be tough to get a large volume of people this way, but you’ll likely get some very high-quality interviews out of it.
If you don’t know where to start, try searching on LinkedIn for people who may fit into your target personas and see which results have any connections in common with you. Then, reach out to your common connections for introductions.
4. Use third-party networks.
For interviewees who are completely removed from your company, there are a few third-party networks you can recruit from. Craigslist allows you to post ads for people interested in any kind of job and UserTesting.com allows you to run remote user testing (with some follow-up questions).
You’ll have less control over sessions run through UserTesting.com, but it’s a great resource for quick user testing recruiting.
Now that how to identity interviewees, let’s look at some tips for recruiting them.
Tips for Recruiting Interviewees
As you reach out to potential interviewees, here are a few ideas to improve your response rates.
1. Use incentives.
While you may not need them in all scenarios (e.g. customers who already want to talk to you), incentives give people a reason to participate in an interview if they don’t have a relationship with you. A simple gift card is an easy option.
2. Be clear that this isn’t a sales call.
This is especially important when dealing with non-customers. Be clear that you’re doing research and that you just want to learn from them. You are not getting them to commit to a one-hour sales call; you’re getting them to commit to telling you about their lives, jobs, and challenges.
3. Make it easy to say yes.
Take care of everything for your potential interviewee — suggest times but be flexible, allow them to pick a time right off the bat, and send a calendar invitation with a reminder to block off their time.
4. Decide how many people you need to interview.
Unfortunately, the answer is, it depends. Start with at least three-to-five interviews for each persona you’re creating. If you already know a lot about your persona, then that may be enough. You may need to do multiple interviews in each category of interviewees (customers, prospects, people who don’t know your company).
The rule of thumb is when you start accurately predicting what your interviewee is going to say, it’s probably time to stop. Through these interviews, you’ll naturally start to notice patterns.
Once you start expecting and predicting what your interviewee is going to say, that means you’ve interviewed enough people to find and internalize these patterns.
5. Determine which questions you’ll ask interviewees.
It’s time to conduct the interview! After the normal small talk and thank-you’s, it’s time to jump into your questions. There are several categories of questions you’ll want to ask in persona interviews to create a complete persona profile.
20 Questions to Ask in Persona Interviews
The following questions are organized into eight categories, but, feel free to customize this list and remove or add more questions that may be appropriate for your target customers.
1. Role Questions
- What is your job role? Your title?
- How is your job measured?
- What does a typical day look like?
- What skills are required to do your job?
- What knowledge and tools do you use in your job?
- Who do you report to? Who reports to you?
2. Company Questions
-
In which industry or industries does your company work?
- What is the size of your company (revenue, employees)?
3. Goal Questions
- What are you responsible for?
- What does it mean to be successful in your role?
4. Challenge Question
- What are your biggest challenges?
5. Watering Hole Questions
- How do you learn about new information for your job?
- What publications or blogs do you read?
- What associations and social networks do you participate in?
6. Personal Background Questions
- Describe your personal demographics (if possible, ask their age, whether they’re married, and if they have children).
- Describe your educational background. What level of education did you complete, which schools did you attend, and what did you study?
- Describe your career path. How did you end up where you are today?
7. Shopping Preference Questions
- How do you prefer to interact with vendors (e.g. email, phone, in person)?
- Do you use the internet to research vendors or products? If yes, how do you search for information?
- Describe a recent purchase. Why did you consider a purchase, what was the evaluation process, and how did you decide to purchase that product or service?
8. The “Why?” Question
This is the number one tip for a successful persona interview.
The follow-up question to pretty much every question in the above list should be “why?” Through these interviews, you’re trying to understand your customers’ (or potential customers’) goals, behaviors, and motivators. But keep in mind that people aren’t always great at reflecting on their behaviors to tell you what drives them at their core.
You don’t care that they measure the number of visits to their website, for example. What you care about is that they measure these visits as a way to show their higher-ups that they’re doing a good job.
Start with a simple question — for instance, “What is your biggest challenge?” Then spend a good amount of time diving deeper into that one question to learn more about that person. You learn more by asking, “why?” than more superficial questions.
Buyer Persona Examples
Let’s go over some examples of completed buyer personas to get a better understanding of what they look like.
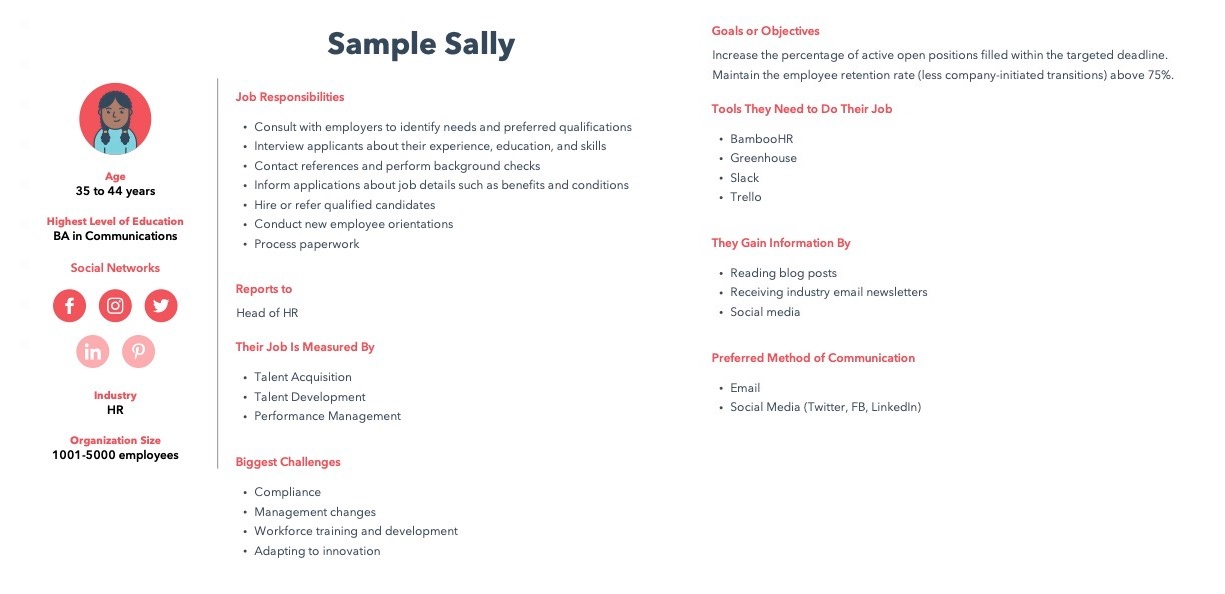
B2B Buyer Persona Example
The image below is a B2B buyer persona for someone who works in HR. The persona paints a clear picture of the target customer’s struggles and how the business can best meet those needs which, in this case, is HR recruiting tools that streamline processes, make recruiting easier, and help HR expertly manage their overall job duties.
B2C Buyer Persona Example
The image below is a B2C buyer persona for a music streaming service.
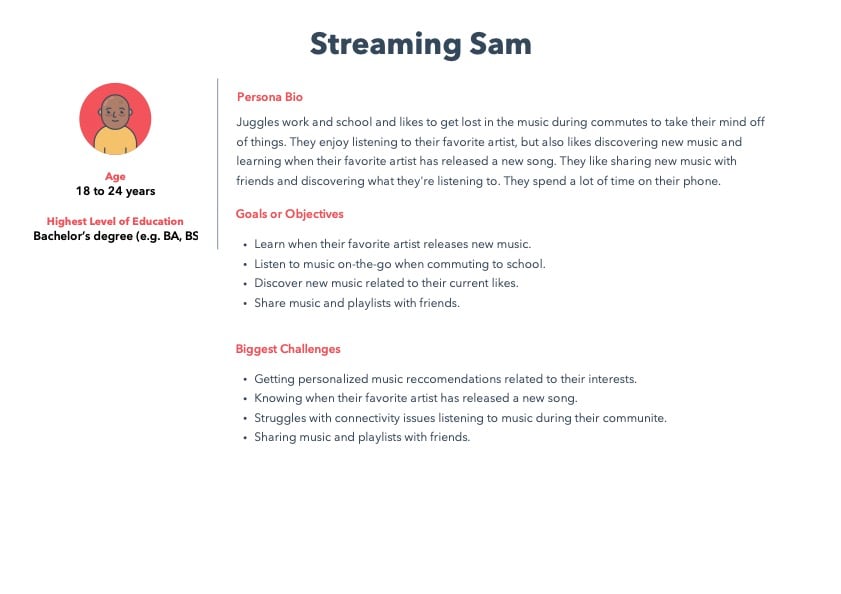
Based on this persona, a streaming service would want to ensure that it has a mobile app that is user-friendly, sends new music notifications, and makes it easy for users to discover new music related to their interests and share content with friends.
Create Your Buyer Personas
Create your buyer personas to understand your target customers on a deeper level and ensure everyone on your team knows how to best target, support, and work with your customers. This will help you improve reach, boost conversions, and increase loyalty.
And if you’re a HubSpot customer, add your persona to your HubSpot Marketing Platform by following this step-by-step setup guide.
Editor’s note: This post was originally published in May 2015 and has been updated for comprehensiveness.


What Are Brand Assets? 6 Examples to Inspire You
All companies that want to attract customers and stand out against competitors need strong brand assets. These elements help build an identity, maintain consistency, and create trust. Considering that trust is the second most important factor in buying from a new brand, it’s essential for companies to design brand assets that highlight their values, strengths, offerings, and identities.
Brand assets let you create customer touchpoints that are immediately recognizable. Think of Amazon packaging, the Pixar lamp, or Apple’s minimalist design.
But branding assets aren’t simply logos and slogans. They’re the combination of several elements that come together to create a unique, distinguishable identity. If well-designed, brand assets can build brand awareness, increase marketing ROI, create customer loyalty, and give you a competitive edge in the market.
Any company can develop distinct assets that draw in customers and increase sales conversations. To start, let’s walk through the basics of brand assets before jumping into examples that show you how to leverage these essential branding elements.
What are Brand Assets?
Brand assets are recognizable elements that embody a company’s identity. From logos and typography to taglines, brand assets make it easy to identify a business, help it stand out from competitors, and cue customer associations.
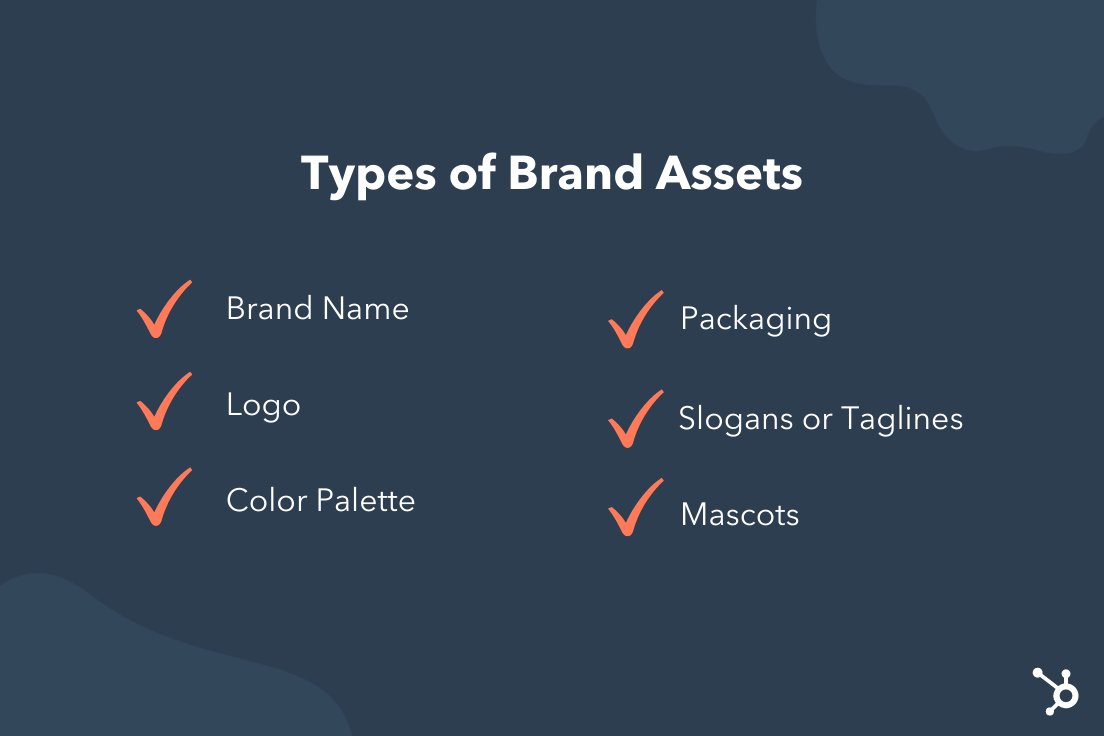 Brand assets can include the following elements:
- Brand name
- Logo
- Color palette
- Packaging
- Slogans or taglines
- Songs or sounds
- Brand guidelines
- Mascots
- Typography
- Design elements
- Voice and tone
- Videos
Well-designed brand assets can help you deliver a consistent, unified experience and bring your business to the top of customers’ minds. But it should never be mistaken for a competitor’s brand. You want every element to reflect your company so it’s immediately recognizable. If you can do that, your assets will work well with one another to build your unique brand identity.
Every company has different needs and thus, different assets. For some, a mascot may be more important than packaging. But all businesses must have a few essential branding assets to distinguish themselves from competitors.
Top Three Brand Assets
- Logo: A logo is the most significant representation of a business. Research shows that people retain information better when it’s paired with a relevant image, and a logo is the thing that helps customers recognize your brand and begin to build an emotional connection.
- Color palette: Up to 90% of an initial impression is based on color alone. Considering that people form an opinion about people or products within the first 90 seconds, it’s easy to see why a color palette is a top brand asset. When choosing colors, research the psychology of color to see what may resonate best with your audience.
- Tagline: “Can you hear me now? Good.” “Just do it,” and “What’s in your wallet?” are all famous taglines. A catchy slogan, when combined with a specific logo and color palette, can be a powerful brand asset for unifying marketing campaigns and turning your company into a household name. Just think of all the jingles you still remember from childhood!
Brand Assets Examples
When building out your company’s brand assets, it can be helpful to see how other businesses stand out from the crowd. Take a look through these incredibly organized and thoughtful brand assets examples for inspiration.
Zendesk

One of my favorite collections of branding assets is Brandland, the Zendesk hub for all things brand. Not only can you discover the history and attributes behind the customer support software, but you can get information on specific assets like typography, color, and voice. It truly is a magical display.
Wistia

The video hosting platform outlines its brand assets in a clear, concise way. Anyone with an interest in portraying the Wistia brand can learn how to use the logo and color palette, which comes with instructions on how to combine the two. It’s simple, yet effective.
Vimeo

Compiled in a brand guideline, Vimeo shares its branding assets alongside detailed instructions on how to use them. This includes how to reference Vimeo, how to use logo color and spacing, and how to share its unique Staff Pick graphics.
Mailchimp

Freddie is the mascot and logo for Mailchimp, which plays up the brand’s offbeat humor and conversational tone. The major brand assets are shared on Mailchimp’s website, as well as its content style guide — an important element for people who want to understand the brand’s voice and values in an in-depth way.
HubSpot

It’s easy to access HubSpot brand assets through its style guide, which outlines elements like logo, color palette, tagline, graphics, and more. People can also dive into specific branding requirements so every page, product, and tool stays on-brand.
Uber

Whether someone is looking for the Uber logo or specific templates for a marketing campaign, Uber has it all in its brand playbook. The company makes it incredibly simple to understand how to use and create brand assets, which is essential for a global company that operates worldwide.
With these brand assets examples in hand, you’re ready to start designing elements that showcase your identity. If you’re wondering how assets play into your overall brand, look to this branding guide for tips on how to create a brand people know, love, and share.


What is a Web Crawler? (In 50 Words or Less)
When it comes to technical SEO, it can be difficult to understand how it all works. But it’s important to gain as much knowledge as we can to optimize our websites and reach larger audiences. One tool that plays a large role in search engine optimization is none other than the web crawler.
In this post, we’ll learn what web crawlers are, how they work, and why they should crawl your site.

You might be wondering, “Who runs these web crawlers?”
Usually, web crawlers are operated by search engines with their own algorithms. The algorithm will tell the web crawler how to find relevant information in response to a search query.
A web spider will search (crawl) and categorize all web pages on the internet that it can find and is told to index. So you can tell a web crawler not to crawl your web page if you don’t want it to be found on search engines.
To do this, you’d upload a robots.txt file. Essentially, a robots.txt file will tell a search engine how to crawl and index the pages on your site.
For example, let’s take a look at Nike.com/robots.txt.

Nike used its robot.txt file to determine which links in its website would be crawled and indexed.

In this portion of the file, it determined that:
- The web crawler Baiduspider was allowed to crawl the first seven links
- The web crawler Baiduspider was disallowed to crawl the remaining three links
This is beneficial for Nike because some pages the company has aren’t meant to be searched, and the disallowed links won’t affect its optimized pages that help them rank in search engines.
So now that we know what web crawlers are, how do they do their job? Below, let’s review how web crawlers work.
A search engine’s web crawler most likely won’t crawl the entire internet. Rather, it will decide the importance of each web page based on factors including how many other pages link to that page, page views, and even brand authority. So, a web crawler will determine which pages to crawl, what order to crawl them in, and how often they should crawl for updates.
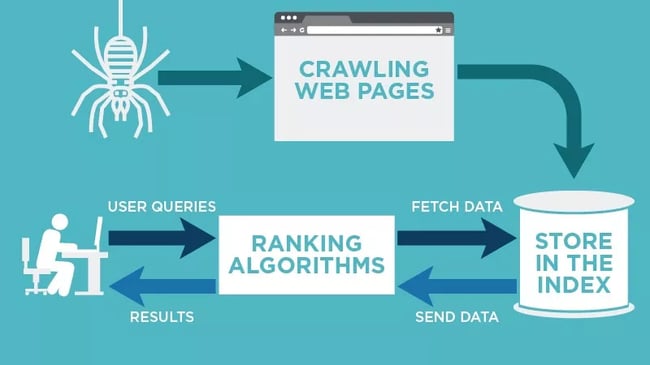
For example, if you have a new web page, or changes were made on an existing page, then the web crawler will take note and update the index. Or, if you have a new web page, you can ask search engines to crawl your site.
When the web crawler is on your page, it looks at the copy and meta tags, stores that information, and indexes it for Google to sort through for keywords.
Before this entire process is started, the web crawler will look at your robots.txt file to see which pages to crawl, which is why it’s so important for technical SEO.
Ultimately, when a web crawler crawls your page, it decides whether your page will show up on the search results page for a query. It’s important to note that some web crawlers might behave differently than others. For example, some might use different factors when deciding which web pages are most important to crawl.
Now that we’ve gone over how web crawlers work, we’ll discuss why they should crawl your website.
Why is website crawling important?
If you want your website to rank in search engines, it needs to be indexed. Without a web crawler, your website won’t be found even if you search for over a paragraph directly taken from your website.
In a simple sense, your website cannot be found organically unless it’s crawled once.
To find and discover links on the web across search engines, you must give your site the ability to reach the audience it’s meant for by having it crawled — especially if you want to increase your organic traffic.
If the technical aspect of this is confusing, I understand. That’s why HubSpot has a Website Optimization Course that puts technical topics into simple language and instructs you on how to implement your own solutions or discuss them with your web expert.
How and Why to Crawl Your Site
If your site has errors making it difficult to crawl, it could fall lower in SERP rankings. You work hard on your business and content, but – as mentioned above – no one will know how great your site is if they can’t find it online.
Luckily there are crawling tools like Screaming Frog and Deepcrawl that can shed light on the health of your website. Performing a site audit with a crawling tool can help you find common errors and identify issues such as:
-
Broken links: When links go to a page that no longer exists, it doesn’t just provide a poor user experience, but it also can harm your rankings in the SERPs.
-
Duplicate content: Duplicate content across different URLs makes it difficult for Google (or other search engines) to choose which version is the most relevant to a user’s search query. One option to remedy this is to combine them using a 301 redirect.
-
Page titles: Duplicate, missing, too long, or too short title tags all affect how your page ranks.
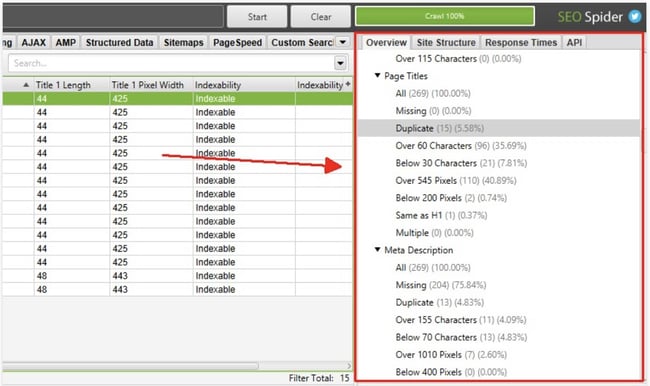
You can’t fix problems on your site unless you know what they are. Using a web crawling tool takes the guesswork out of evaluating your site.
Types of Web Crawling Tools
There are plenty of tools on the market to choose from with various features, but they all fall into two categories:
-
Desktop: These tools are installed and stored on your computer.
-
Cloud: These tools use cloud computing and don’t have to be stored locally on your computer.
The type of tool you use will depend on your team’s needs and budget. Generally, choosing a cloud-based option will allow for more collaboration since the program won’t need to be stored on an individual’s device.
Once installed, you can set crawlers to run at a given interval and generate reports as needed.
Benefits of Using Web Crawling Tools
Having your site crawled properly is essential to SEO. In addition to diagnosing site errors, benefits of using a web crawling tool include:
1. Doesn’t Affect Site Performance
Site crawlers run in the background and won’t slow down your site when in use. They won’t interfere with your day-to-day tasks or have an effect on those browsing your site.
2. Built-in Reporting
Most crawlers have built-in reporting or analytics features and allow you to export these reports into an excel spreadsheet or other formats. This feature saves time and allows you to quickly dig into the results of your audit.
3. Utilizes Automation
A great feature of web crawlers is that you can set a cadence to have them crawl your site. This allows you to regularly track site performance without having to manually pull a crawl report each time.
Performing regular site audits with a crawling tool is a great way to ensure your site is in good health and ranking as it should.
Expand Your Reach With Web Crawling
Web crawlers are responsible for searching and indexing content online for search engines. They work by sorting and filtering through web pages so search engines understand what every web page is about. Understanding web crawlers is just one part of effective technical SEO that can improve your website’s performance significantly.
This article was originally published July 15, 2021, and has been updated for comprehensiveness.


How to Use Excel Like a Pro: 19 Easy Excel Tips, Tricks, & Shortcuts
Sometimes, Excel seems too good to be true. All I have to do is enter a formula, and pretty much anything I’d ever need to do manually can be done automatically.
Need to merge two sheets with similar data? Excel can do it.
Need to do simple math? Excel can do it.
Need to combine information in multiple cells? Excel can do it.
In this post, I’ll go over the best tips, tricks, and shortcuts you can use right now to take your Excel game to the next level. No advanced Excel knowledge required.

What is Excel?
Microsoft Excel is powerful data visualization and analysis software, which uses spreadsheets to store, organize, and track data sets with formulas and functions. Excel is used by marketers, accountants, data analysts, and other professionals. It’s part of the Microsoft Office suite of products. Alternatives include Google Sheets and Numbers.
Find more Excel alternatives here.
Excel is primarily used for creating financial documents because of its strong computational powers. You’ll often find the software in accounting offices and teams because it allows accountants to automatically see sums, averages, and totals. With Excel, they can easily make sense of their business’ data.
While Excel is primarily known as an accounting tool, professionals in any field can use its features and formulas — especially marketers — because it can be used for tracking any type of data. It removes the need to spend hours and hours counting cells or copying and pasting performance numbers. Excel typically has a shortcut or quick fix that speeds up the process.
You can also download Excel templates below for all of your marketing needs.
After you download the templates, it’s time to start using the software. Let’s cover the basics first.
Excel Basics
If you’re just starting out with Excel, there are a few basic commands that we suggest you become familiar with. These are things like:
- Creating a new spreadsheet from scratch.
- Executing basic computations like adding, subtracting, multiplying, and dividing.
- Writing and formatting column text and titles.
- Using Excel’s auto-fill features.
- Adding or deleting single columns, rows, and spreadsheets. (Below, we’ll get into how to add things like multiple columns and rows.)
- Keeping column and row titles visible as you scroll past them in a spreadsheet, so that you know what data you’re filling as you move further down the document.
- Sorting your data in alphabetical order.
Let’s explore a few of these more in-depth.
For instance, why does auto-fill matter?
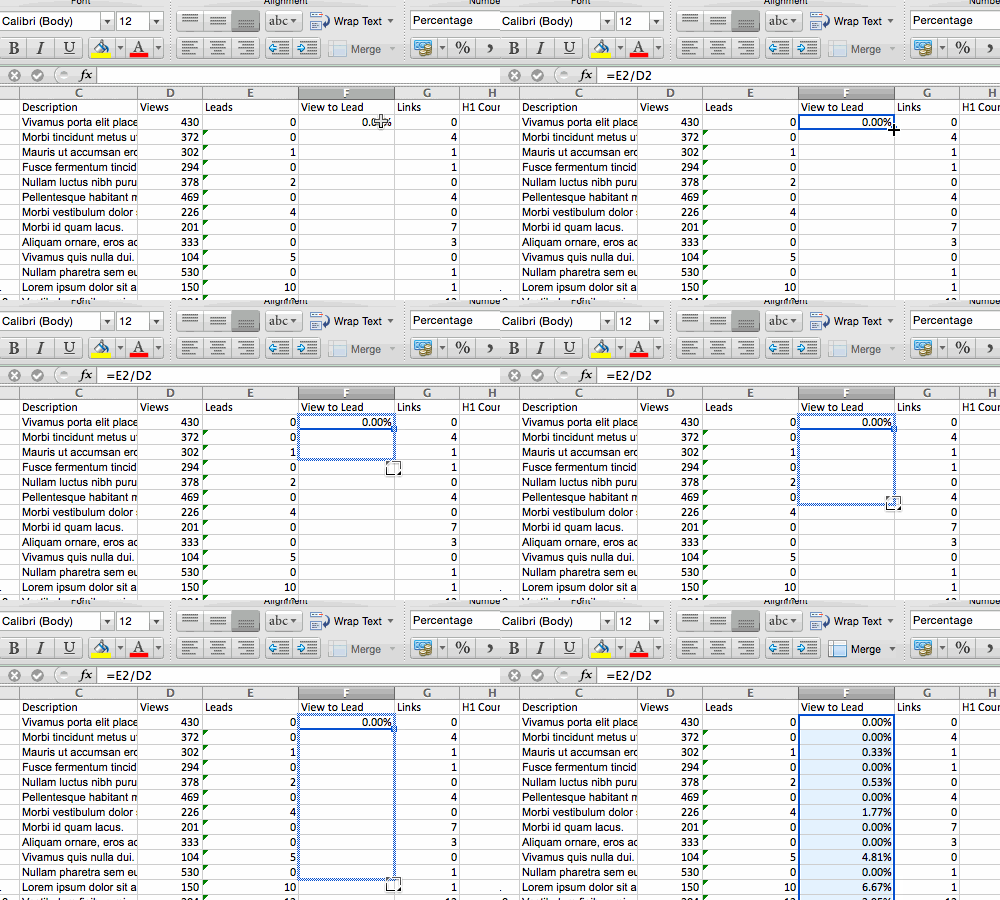
If you have any basic Excel knowledge, it’s likely you already know this quick trick. But to cover our bases, allow me to show you the glory of autofill. This lets you quickly fill adjacent cells with several types of data, including values, series, and formulas.
There are multiple ways to deploy this feature, but the fill handle is among the easiest. Select the cells you want to be the source, locate the fill handle in the lower-right corner of the cell, and either drag the fill handle to cover cells you want to fill or just double click:
 Similarly, sorting is an important feature you’ll want to know when organizing your data in Excel.
Sometimes you may have a list of data that has no organization whatsoever. Maybe you exported a list of your marketing contacts or blog posts. Whatever the case may be, Excel’s sort feature will help you alphabetize any list.
Click on the data in the column you want to sort. Then click on the “Data” tab in your toolbar and look for the “Sort” option on the left. If the “A” is on top of the “Z,” you can just click on that button once. If the “Z” is on top of the “A,” click on the button twice. When the “A” is on top of the “Z,” that means your list will be sorted in alphabetical order. However, when the “Z” is on top of the “A,” that means your list will be sorted in reverse alphabetical order.
Let’s explore more of the basics of Excel (along with advanced features) next.
How to Use Excel
To use Excel, you only need to input the data into the rows and columns. And then you’ll use formulas and functions to turn that data into insights.
We’re going to go over the best formulas and functions you need to know. But first, let’s take a look at the types of documents you can create using the software. That way, you have an overarching understanding of how you can use Excel in your day-to-day.
Documents You Can Create in Excel
Not sure how you can actually use Excel in your team? Here is a list of documents you can create:
- Income Statements: You can use an Excel spreadsheet to track a company’s sales activity and financial health.
- Balance Sheets: Balance sheets are among the most common types of documents you can create with Excel. It allows you to get a holistic view of a company’s financial standing.
- Calendar: You can easily create a spreadsheet monthly calendar to track events or other date-sensitive information.
Here are some documents you can create specifically for marketers.
- Marketing Budgets: Excel is a strong budget-keeping tool. You can create and track marketing budgets, as well as spend, using Excel. If you don’t want to create a document from scratch, download our marketing budget templates for free.
- Marketing Reports: If you don’t use a marketing tool such as Marketing Hub, you might find yourself in need of a dashboard with all of your reports. Excel is an excellent tool to create marketing reports. Download free Excel marketing reporting templates here.
- Editorial Calendars: You can create editorial calendars in Excel. The tab format makes it extremely easy to track your content creation efforts for custom time ranges. Download a free editorial content calendar template here.
- Traffic and Leads Calculator: Because of its strong computational powers, Excel is an excellent tool to create all sorts of calculators — including one for tracking leads and traffic. Click here to download a free premade lead goal calculator.
This is only a small sampling of the types of marketing and business documents you can create in Excel. We’ve created an extensive list of Excel templates you can use right now for marketing, invoicing, project management, budgeting, and more.
In the spirit of working more efficiently and avoiding tedious, manual work, here are a few Excel formulas and functions you’ll need to know.
Excel Formulas
It’s easy to get overwhelmed by the wide range of Excel formulas that you can use to make sense out of your data. If you’re just getting started using Excel, you can rely on the following formulas to carry out some complex functions — without adding to the complexity of your learning path.
- Equal sign: Before creating any formula, you’ll need to write an equal sign (=) in the cell where you want the result to appear.
- Addition: To add the values of two or more cells, use the + sign. Example: =C5+D3.
- Subtraction: To subtract the values of two or more cells, use the – sign. Example: =C5-D3.
- Multiplication: To multiply the values of two or more cells, use the * sign. Example: =C5*D3.
- Division: To divide the values of two or more cells, use the / sign. Example: =C5/D3.
Putting all of these together, you can create a formula that adds, subtracts, multiplies, and divides all in one cell. Example: =(C5-D3)/((A5+B6)*3).
For more complex formulas, you’ll need to use parentheses around the expressions to avoid accidentally using the PEMDAS order of operations. Keep in mind that you can use plain numbers in your formulas.
Excel Functions
Excel functions automate some of the tasks you would use in a typical formula. For instance, instead of using the + sign to add up a range of cells, you’d use the SUM function. Let’s look at a few more functions that will help automate calculations and tasks.
- SUM: The SUM function automatically adds up a range of cells or numbers. To complete a sum, you would input the starting cell and the final cell with a colon in between. Here’s what that looks like: SUM(Cell1:Cell2). Example: =SUM(C5:C30).
- AVERAGE: The AVERAGE function averages out the values of a range of cells. The syntax is the same as the SUM function: AVERAGE(Cell1:Cell2). Example: =AVERAGE(C5:C30).
- IF: The IF function allows you to return values based on a logical test. The syntax is as follows: IF(logical_test, value_if_true, [value_if_false]). Example: =IF(A2>B2,”Over Budget”,”OK”).
- VLOOKUP: The VLOOKUP function helps you search for anything on your sheet’s rows. The syntax is: VLOOKUP(lookup value, table array, column number, Approximate match (TRUE) or Exact match (FALSE)). Example: =VLOOKUP([@Attorney],tbl_Attorneys,4,FALSE).
- INDEX: The INDEX function returns a value from within a range. The syntax is as follows: INDEX(array, row_num, [column_num]).
- MATCH: The MATCH function looks for a certain item in a range of cells and returns the position of that item. It can be used in tandem with the INDEX function. The syntax is: MATCH(lookup_value, lookup_array, [match_type]).
- COUNTIF: The COUNTIF function returns the number of cells that meet a certain criteria or have a certain value. The syntax is: COUNTIF(range, criteria). Example: =COUNTIF(A2:A5,”London”).
Okay, ready to get into the nitty-gritty? Let’s get to it. (And to all the Harry Potter fans out there … you’re welcome in advance.)
Note: The GIFs and visuals are from a previous version of Excel. When applicable, the copy has been updated to provide instruction for users of both newer and older Excel versions.
1. Use Pivot tables to recognize and make sense of data.
Pivot tables are used to reorganize data in a spreadsheet. They won’t change the data that you have, but they can sum up values and compare different information in your spreadsheet, depending on what you’d like them to do.
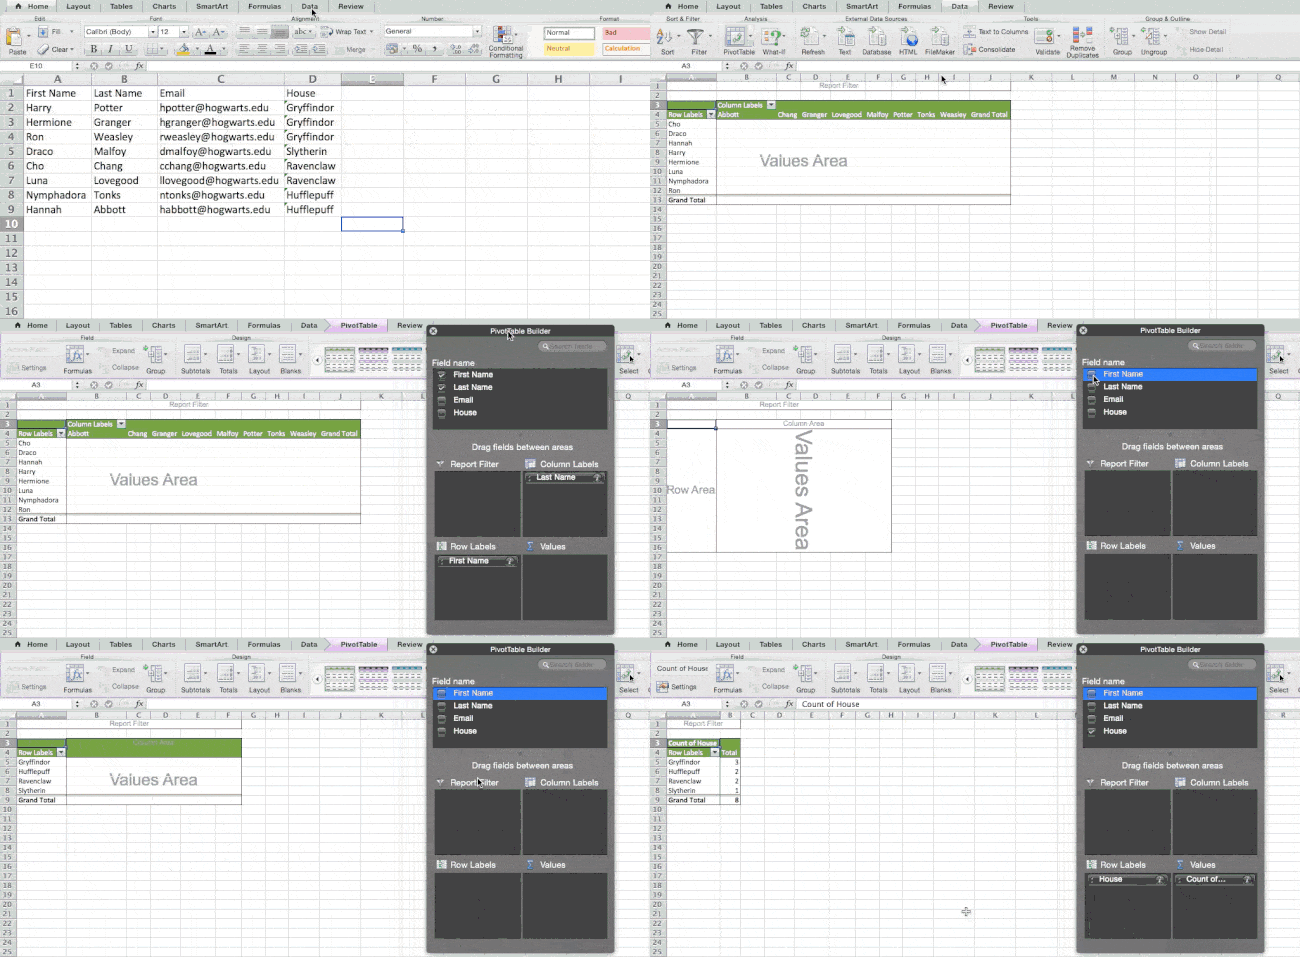
Let’s take a look at an example. Let’s say I want to take a look at how many people are in each house at Hogwarts. You may be thinking that I don’t have too much data, but for longer data sets, this will come in handy.
To create the Pivot Table, I go to Data > Pivot Table. If you’re using the most recent version of Excel, you’d go to Insert > Pivot Table. Excel will automatically populate your Pivot Table, but you can always change around the order of the data. Then, you have four options to choose from.
- Report Filter: This allows you to only look at certain rows in your dataset. For example, if I wanted to create a filter by house, I could choose to only include students in Gryffindor instead of all students.
- Column Labels: These would be your headers in the dataset.
- Row Labels: These could be your rows in the dataset. Both Row and Column labels can contain data from your columns (e.g. First Name can be dragged to either the Row or Column label — it just depends on how you want to see the data.)
- Value: This section allows you to look at your data differently. Instead of just pulling in any numeric value, you can sum, count, average, max, min, count numbers, or do a few other manipulations with your data. In fact, by default, when you drag a field to Value, it always does a count.
Since I want to count the number of students in each house, I’ll go to the Pivot table builder and drag the House column to both the Row Labels and the Values. This will sum up the number of students associated with each house.
2. Add more than one row or column.
As you play around with your data, you might find you’re constantly needing to add more rows and columns. Sometimes, you may even need to add hundreds of rows. Doing this one-by-one would be super tedious. Luckily, there’s always an easier way.
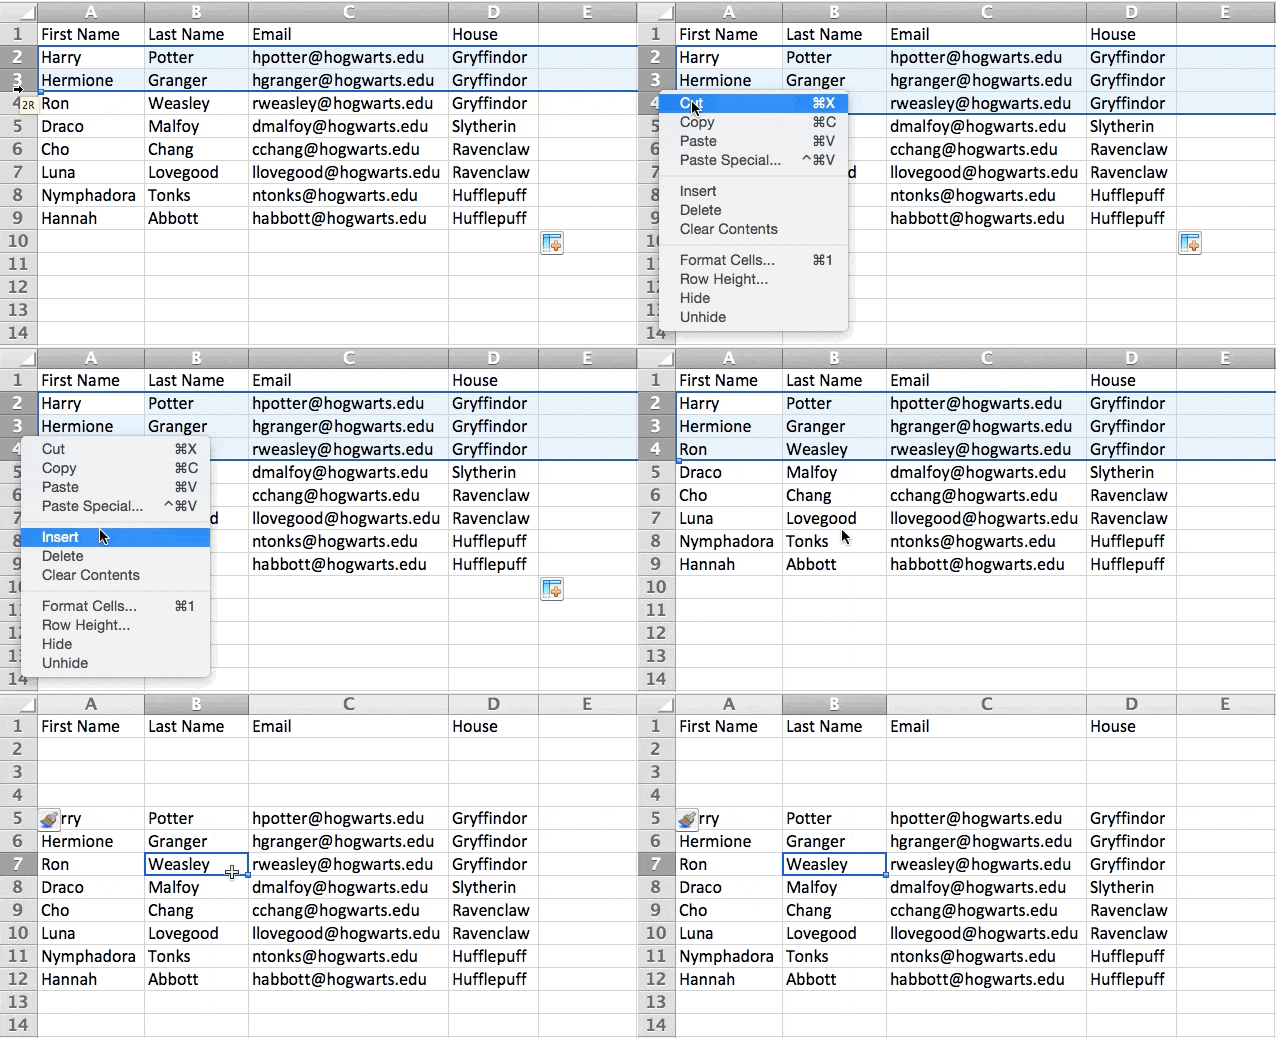
To add multiple rows or columns in a spreadsheet, highlight the same number of preexisting rows or columns that you want to add. Then, right-click and select “Insert.”
In the example below, I want to add an additional three rows. By highlighting three rows and then clicking insert, I’m able to add an additional three blank rows into my spreadsheet quickly and easily.
3. Use filters to simplify your data.
When you’re looking at very large data sets, you don’t usually need to be looking at every single row at the same time. Sometimes, you only want to look at data that fit into certain criteria.
That’s where filters come in.
Filters allow you to pare down your data to only look at certain rows at one time. In Excel, a filter can be added to each column in your data — and from there, you can then choose which cells you want to view at once.
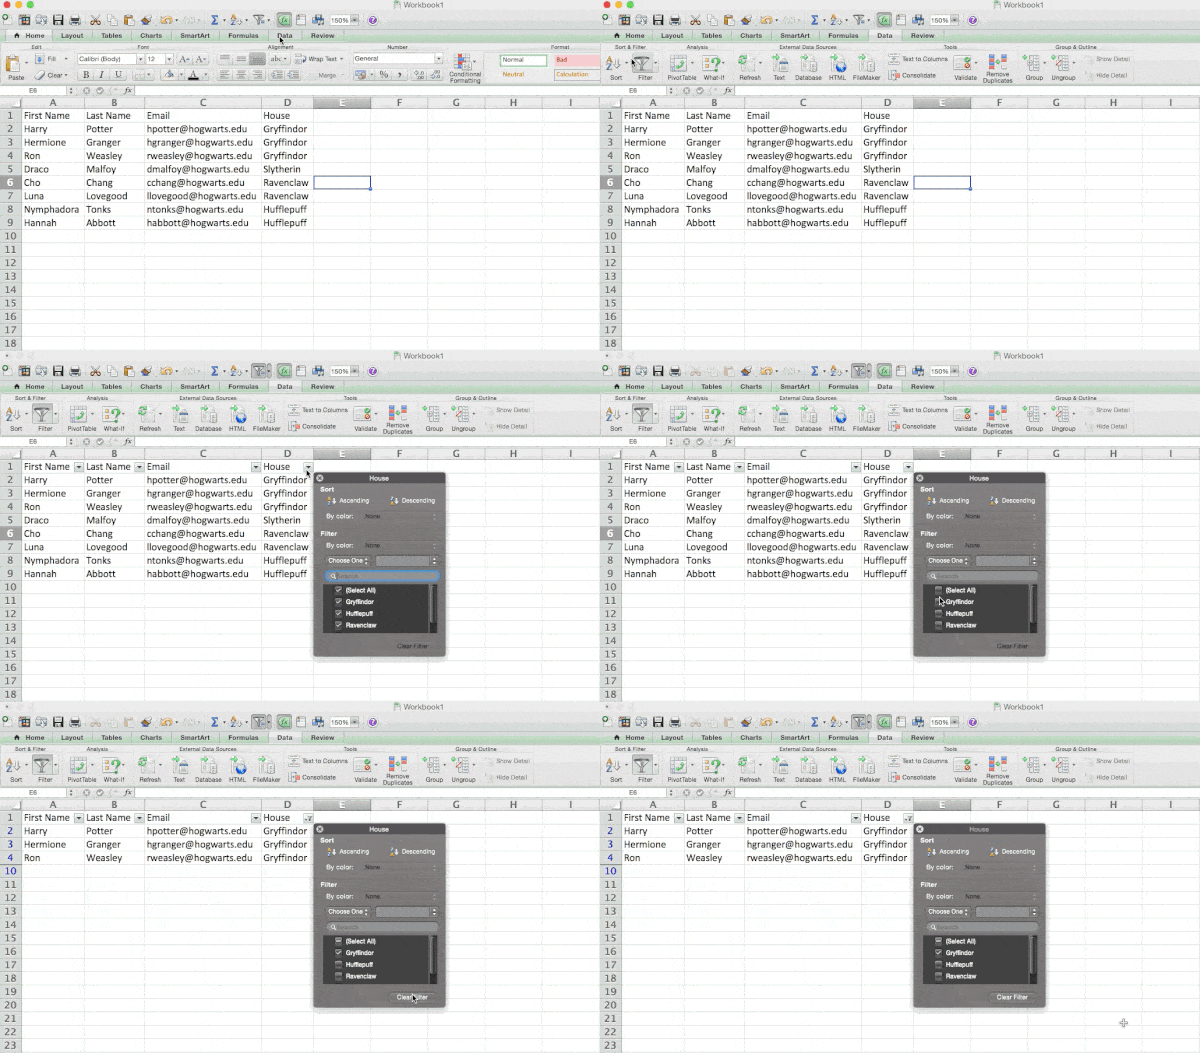
Let’s take a look at the example below. Add a filter by clicking the Data tab and selecting “Filter.” Clicking the arrow next to the column headers and you’ll be able to choose whether you want your data to be organized in ascending or descending order, as well as which specific rows you want to show.
In my Harry Potter example, let’s say I only want to see the students in Gryffindor. By selecting the Gryffindor filter, the other rows disappear.
 Pro Tip: Copy and paste the values in the spreadsheet when a Filter is on to do additional analysis in another spreadsheet.
4. Remove duplicate data points or sets.
Larger data sets tend to have duplicate content. You may have a list of multiple contacts in a company and only want to see the number of companies you have. In situations like this, removing the duplicates comes in quite handy.
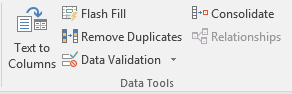
To remove your duplicates, highlight the row or column that you want to remove duplicates of. Then, go to the Data tab and select “Remove Duplicates” (which is under the Tools subheader in the older version of Excel). A pop-up will appear to confirm which data you want to work with. Select “Remove Duplicates,” and you’re good to go.
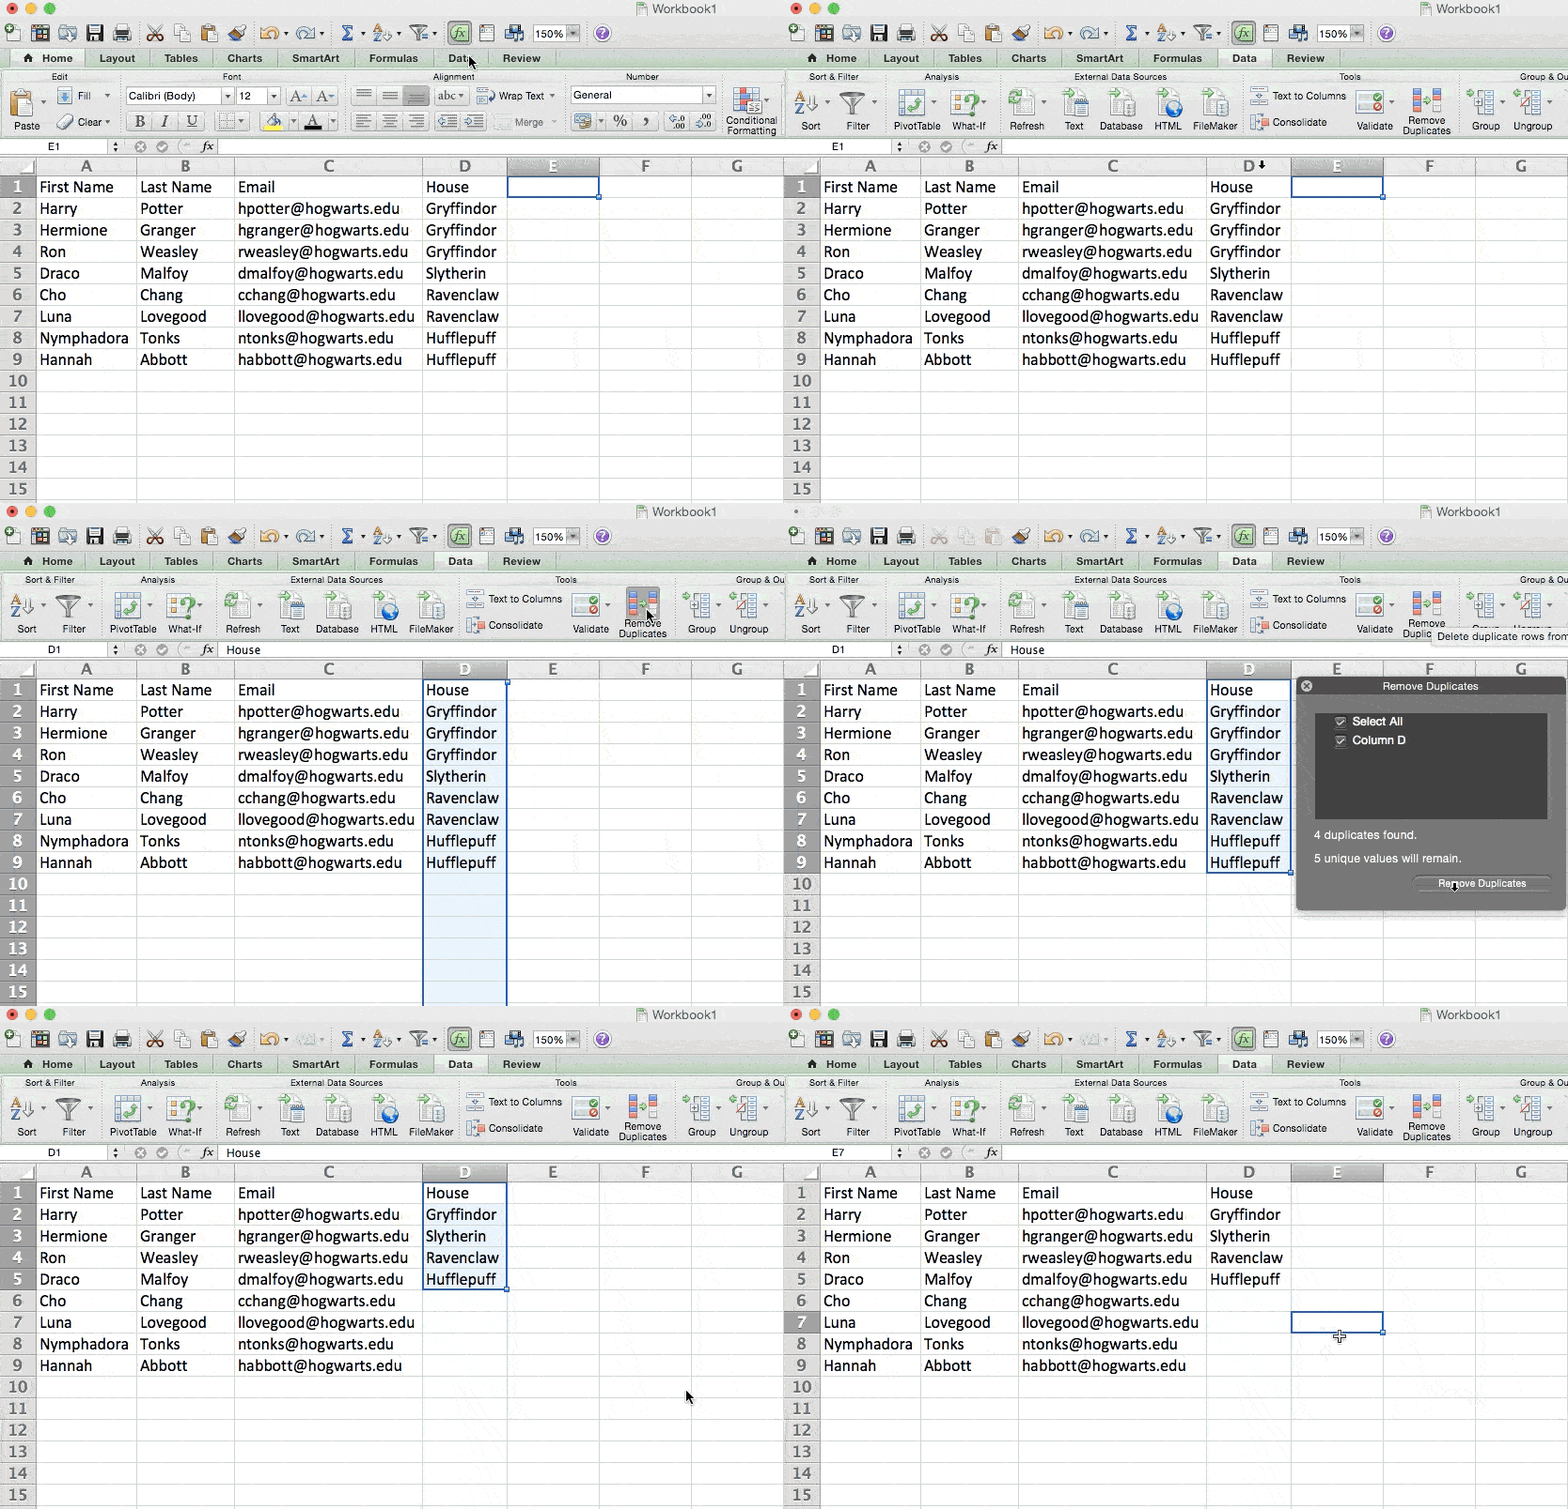
You can also use this feature to remove an entire row based on a duplicate column value. So if you have three rows with Harry Potter’s information and you only need to see one, then you can select the whole dataset and then remove duplicates based on email. Your resulting list will have only unique names without any duplicates.
5. Transpose rows into columns.
When you have rows of data in your spreadsheet, you might decide you actually want to transform the items in one of those rows into columns (or vice versa). It would take a lot of time to copy and paste each individual header — but what the transpose feature allows you to do is simply move your row data into columns, or the other way around.
Start by highlighting the column that you want to transpose into rows. Right-click it, and then select “Copy.” Next, select the cells on your spreadsheet where you want your first row or column to begin. Right-click on the cell, and then select “Paste Special.” A module will appear — at the bottom, you’ll see an option to transpose. Check that box and select OK. Your column will now be transferred to a row or vice-versa.
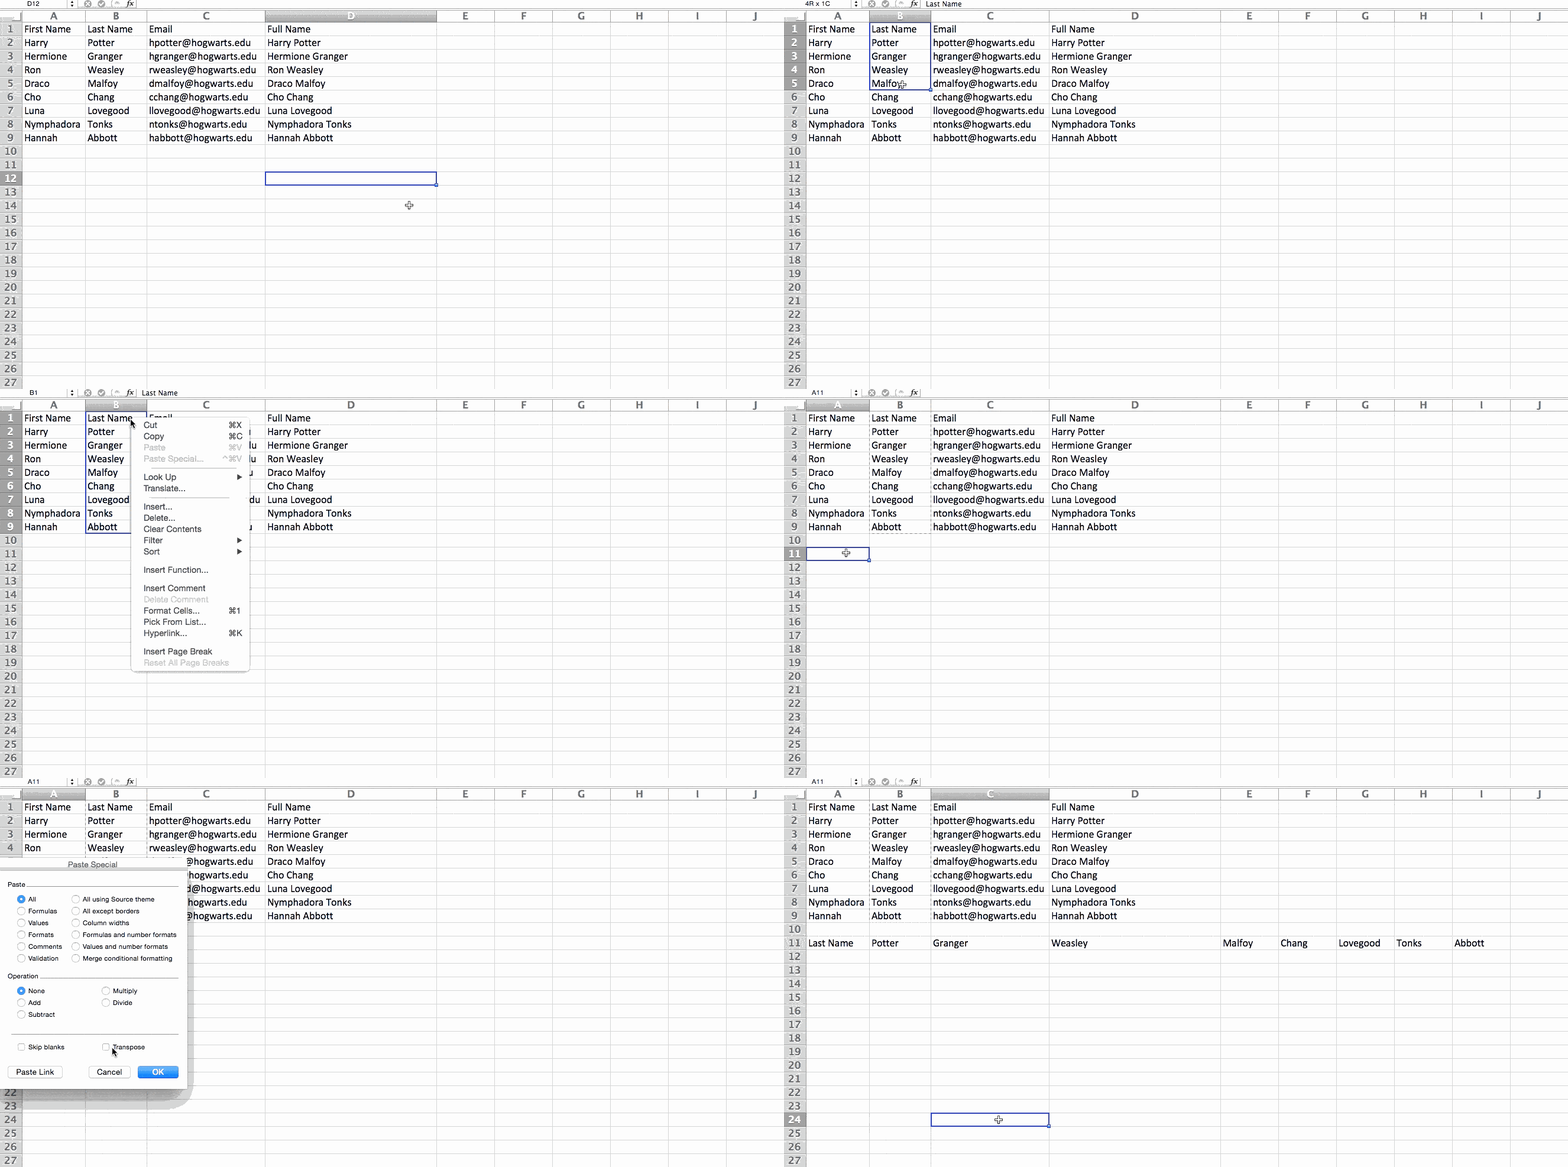
On newer versions of Excel, a drop-down will appear instead of a pop-up.

6. Split up text information between columns.
What if you want to split out information that’s in one cell into two different cells? For example, maybe you want to pull out someone’s company name through their email address. Or perhaps you want to separate someone’s full name into a first and last name for your email marketing templates.
Thanks to Excel, both are possible. First, highlight the column that you want to split up. Next, go to the Data tab and select “Text to Columns.” A module will appear with additional information.
First, you need to select either “Delimited” or “Fixed Width.”
- “Delimited” means you want to break up the column based on characters such as commas, spaces, or tabs.
- “Fixed Width” means you want to select the exact location on all the columns that you want the split to occur.
In the example case below, let’s select “Delimited” so we can separate the full name into first name and last name.
Then, it’s time to choose the Delimiters. This could be a tab, semi-colon, comma, space, or something else. (“Something else” could be the “@” sign used in an email address, for example.) In our example, let’s choose the space. Excel will then show you a preview of what your new columns will look like.
When you’re happy with the preview, press “Next.” This page will allow you to select Advanced Formats if you choose to. When you’re done, click “Finish.”

7. Use formulas for simple calculations.
In addition to doing pretty complex calculations, Excel can help you do simple arithmetic like adding, subtracting, multiplying, or dividing any of your data.
- To add, use the + sign.
- To subtract, use the – sign.
- To multiply, use the * sign.
- To divide, use the / sign.
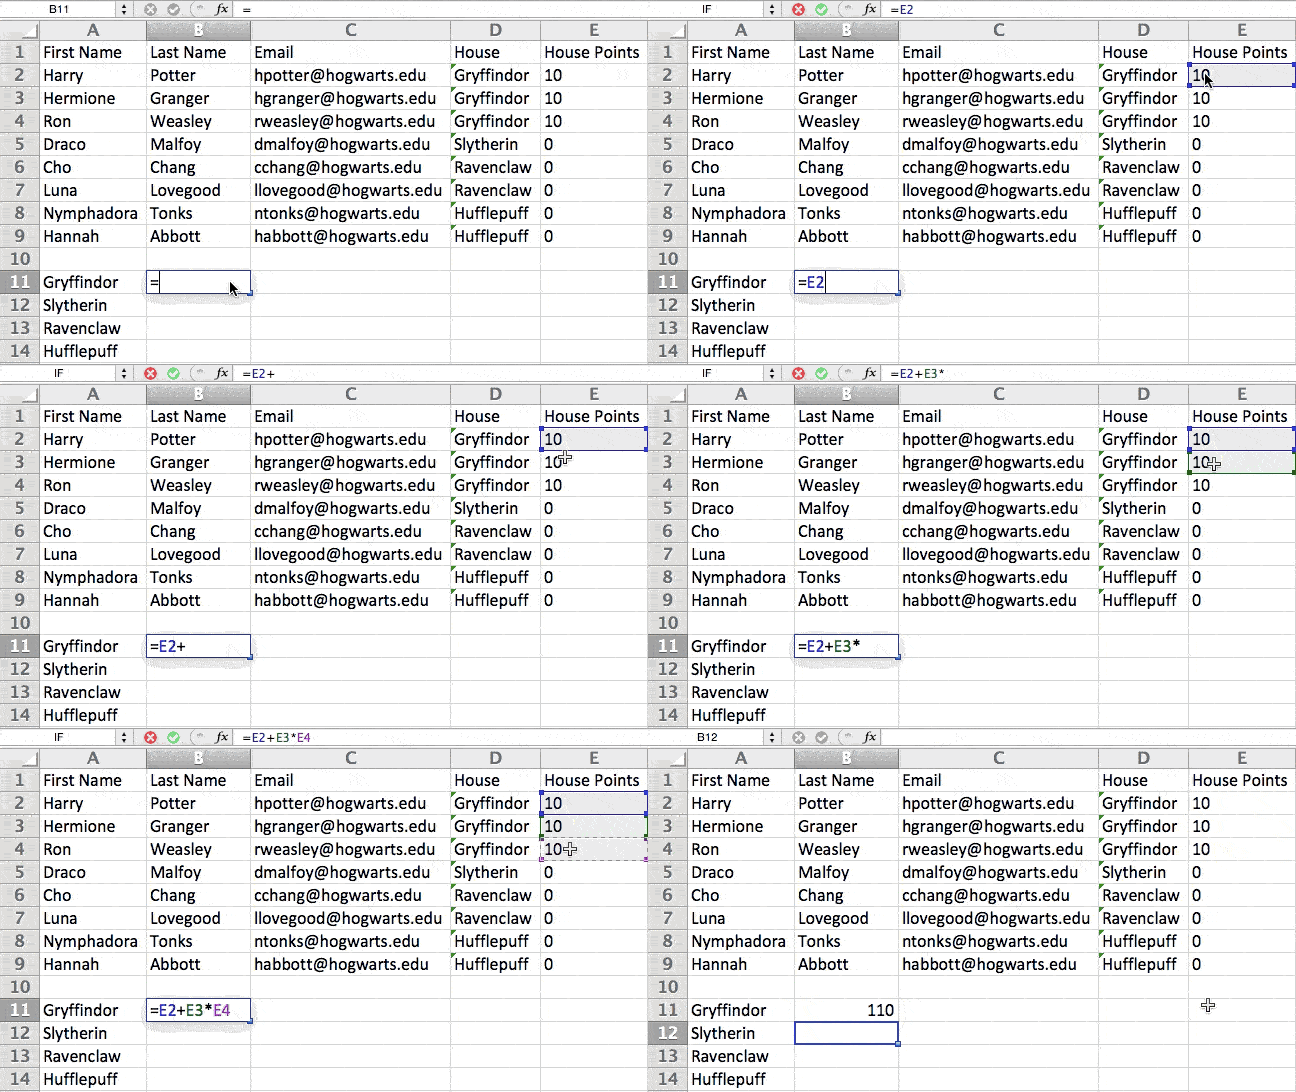
You can also use parentheses to ensure certain calculations are done first. In the example below (10+10*10), the second and third 10 were multiplied together before adding the additional 10. However, if we made it (10+10)*10, the first and second 10 would be added together first.
8. Get the average of numbers in your cells.
If you want the average of a set of numbers, you can use the formula =AVERAGE(Cell1:Cell2). If you want to sum up a column of numbers, you can use the formula =SUM(Cell1:Cell2).
9. Use conditional formatting to make cells automatically change color based on data.
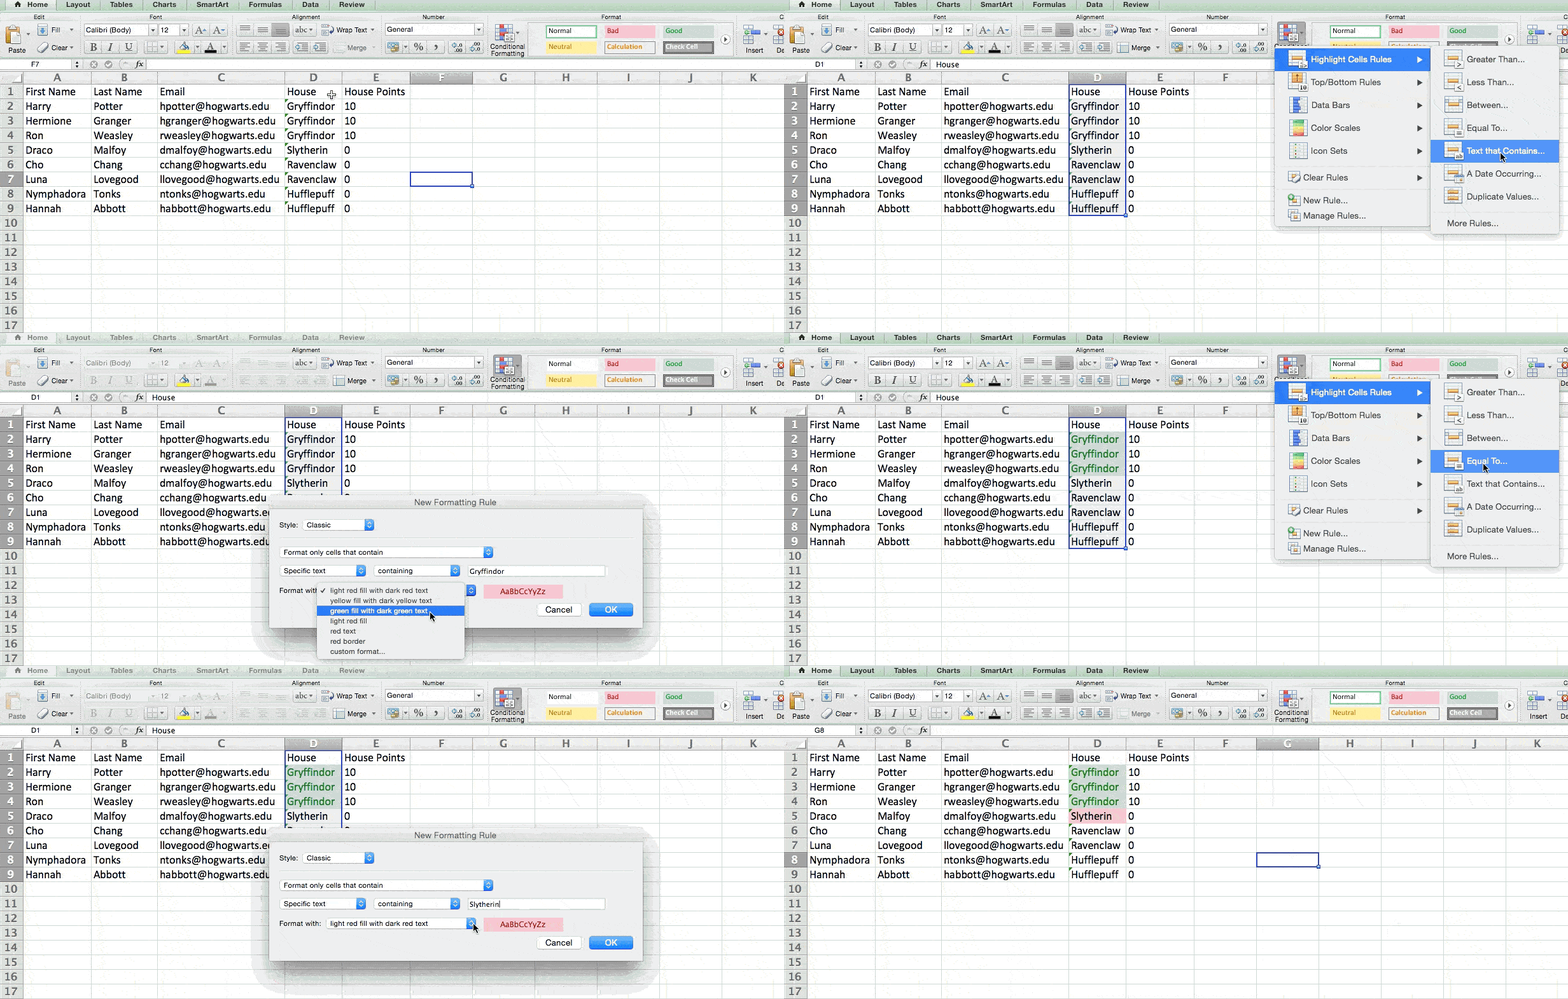
Conditional formatting allows you to change a cell’s color based on the information within the cell. For example, if you want to flag certain numbers that are above average or in the top 10% of the data in your spreadsheet, you can do that. If you want to color code commonalities between different rows in Excel, you can do that. This will help you quickly see information that is important to you.
To get started, highlight the group of cells you want to use conditional formatting on. Then, choose “Conditional Formatting” from the Home menu and select your logic from the dropdown. (You can also create your own rule if you want something different.) A window will pop up that prompts you to provide more information about your formatting rule. Select “OK” when you’re done, and you should see your results automatically appear.
10. Use the IF Excel formula to automate certain Excel functions.
Sometimes, we don’t want to count the number of times a value appears. Instead, we want to input different information into a cell if there is a corresponding cell with that information.
For example, in the situation below, I want to award ten points to everyone who belongs in the Gryffindor house. Instead of manually typing in 10’s next to each Gryffindor student’s name, I can use the IF Excel formula to say that if the student is in Gryffindor, then they should get ten points.
The formula is: IF(logical_test, value_if_true, [value_if_false])
Example Shown Below: =IF(D2=”Gryffindor”,”10″,”0″)
In general terms, the formula would be IF(Logical Test, value of true, value of false). Let’s dig into each of these variables.
- Logical_Test: The logical test is the “IF” part of the statement. In this case, the logic is D2=”Gryffindor” because we want to make sure that the cell corresponding with the student says “Gryffindor.” Make sure to put Gryffindor in quotation marks here.
- Value_if_True: This is what we want the cell to show if the value is true. In this case, we want the cell to show “10” to indicate that the student was awarded the 10 points. Only use quotation marks if you want the result to be text instead of a number.
- Value_if_False: This is what we want the cell to show if the value is false. In this case, for any student not in Gryffindor, we want the cell to show “0”. Only use quotation marks if you want the result to be text instead of a number.
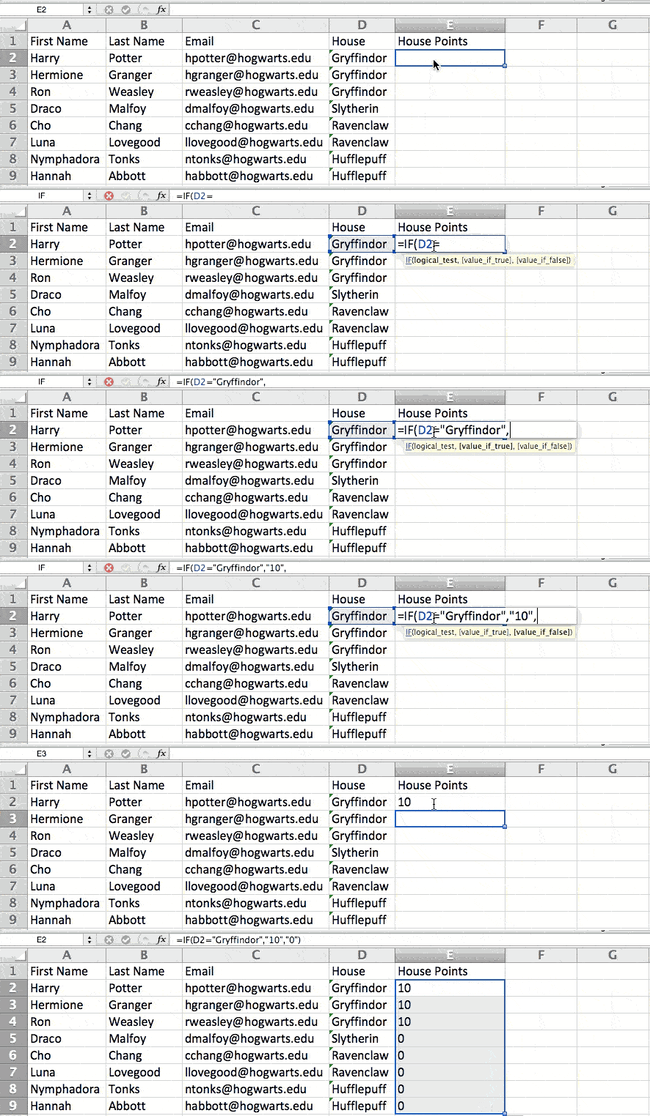
Note: In the example above, I awarded 10 points to everyone in Gryffindor. If I later wanted to sum the total number of points, I wouldn’t be able to because the 10’s are in quotes, thus making them text and not a number that Excel can sum.
The real power of the IF function comes when you string multiple IF statements together, or nest them. This allows you to set multiple conditions, get more specific results, and ultimately organize your data into more manageable chunks.
Ranges are one way to segment your data for better analysis. For example, you can categorize data into values that are less than 10, 11 to 50, or 51 to 100. Here’s how that looks in practice:
=IF(B3<11,“10 or less”,IF(B3<51,“11 to 50”,IF(B3<100,“51 to 100”)))
It can take some trial-and-error, but once you have the hang of it, IF formulas will become your new Excel best friend.
11. Use dollar signs to keep one cell’s formula the same regardless of where it moves.
Have you ever seen a dollar sign in an Excel formula? When used in a formula, it isn’t representing an American dollar; instead, it makes sure that the exact column and row are held the same even if you copy the same formula in adjacent rows.
You see, a cell reference — when you refer to cell A5 from cell C5, for example — is relative by default. In that case, you’re actually referring to a cell that’s five columns to the left (C minus A) and in the same row (5). This is called a relative formula. When you copy a relative formula from one cell to another, it’ll adjust the values in the formula based on where it’s moved. But sometimes, we want those values to stay the same no matter whether they’re moved around or not — and we can do that by turning the formula into an absolute formula.
To change the relative formula (=A5+C5) into an absolute formula, we’d precede the row and column values by dollar signs, like this: (=$A$5+$C$5). (Learn more on Microsoft Office’s support page here.)
12. Use the VLOOKUP function to pull data from one area of a sheet to another.
Have you ever had two sets of data on two different spreadsheets that you want to combine into a single spreadsheet?
For example, you might have a list of people’s names next to their email addresses in one spreadsheet, and a list of those same people’s email addresses next to their company names in the other — but you want the names, email addresses, and company names of those people to appear in one place.
I have to combine data sets like this a lot — and when I do, the VLOOKUP is my go-to formula.
Before you use the formula, though, be absolutely sure that you have at least one column that appears identically in both places. Scour your data sets to make sure the column of data you’re using to combine your information is exactly the same, including no extra spaces.
The formula: =VLOOKUP(lookup value, table array, column number, Approximate match (TRUE) or Exact match (FALSE))
The formula with variables from our example below: =VLOOKUP(C2,Sheet2!A:B,2,FALSE)
In this formula, there are several variables. The following is true when you want to combine information in Sheet 1 and Sheet 2 onto Sheet 1.
- Lookup Value: This is the identical value you have in both spreadsheets. Choose the first value in your first spreadsheet. In the example that follows, this means the first email address on the list, or cell 2 (C2).
- Table Array: The table array is the range of columns on Sheet 2 you’re going to pull your data from, including the column of data identical to your lookup value (in our example, email addresses) in Sheet 1 as well as the column of data you’re trying to copy to Sheet 1. In our example, this is “Sheet2!A:B.” “A” means Column A in Sheet 2, which is the column in Sheet 2 where the data identical to our lookup value (email) in Sheet 1 is listed. The “B” means Column B, which contains the information that’s only available in Sheet 2 that you want to translate to Sheet 1.
- Column Number: This tells Excel which column the new data you want to copy to Sheet 1 is located in. In our example, this would be the column that “House” is located in. “House” is the second column in our range of columns (table array), so our column number is 2. [Note: Your range can be more than two columns. For example, if there are three columns on Sheet 2 — Email, Age, and House — and you still want to bring House onto Sheet 1, you can still use a VLOOKUP. You just need to change the “2” to a “3” so it pulls back the value in the third column: =VLOOKUP(C2:Sheet2!A:C,3,false).]
- Approximate Match (TRUE) or Exact Match (FALSE): Use FALSE to ensure you pull in only exact value matches. If you use TRUE, the function will pull in approximate matches.
In the example below, Sheet 1 and Sheet 2 contain lists describing different information about the same people, and the common thread between the two is their email addresses. Let’s say we want to combine both datasets so that all the house information from Sheet 2 translates over to Sheet 1.
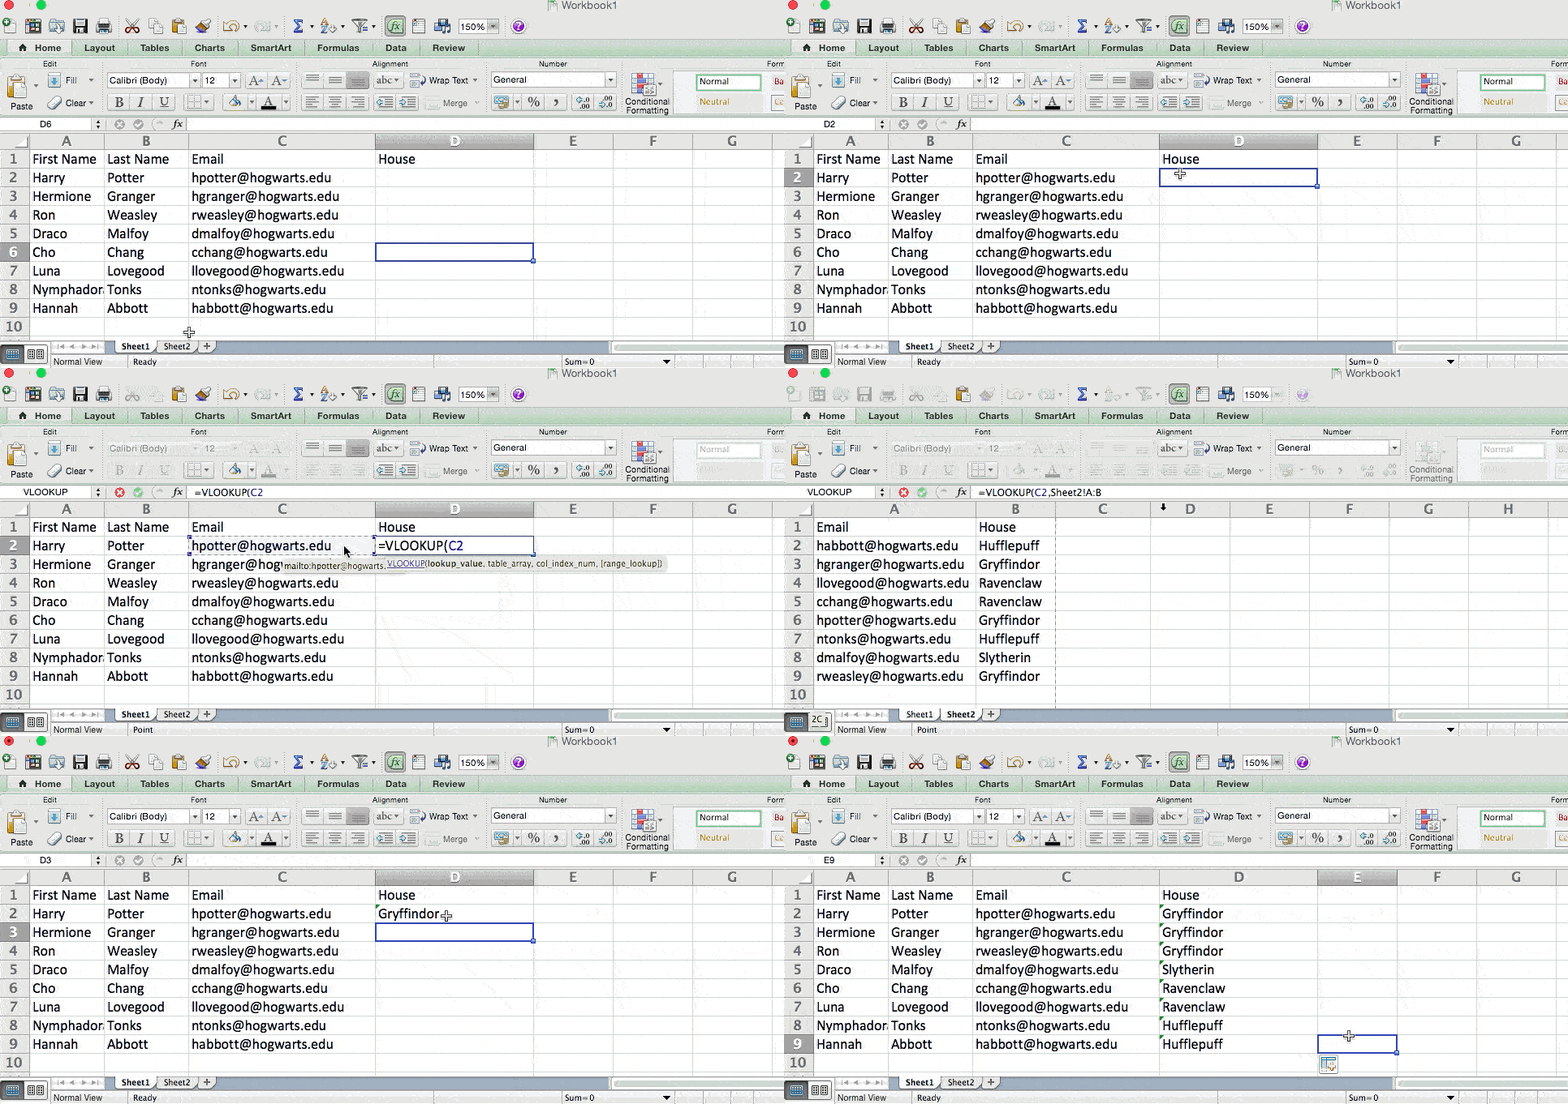
So when we type in the formula =VLOOKUP(C2,Sheet2!A:B,2,FALSE), we bring all the house data into Sheet 1.
Keep in mind that VLOOKUP will only pull back values from the second sheet that are to the right of the column containing your identical data. This can lead to some limitations, which is why some people prefer to use the INDEX and MATCH functions instead.
13. Use INDEX and MATCH formulas to pull data from horizontal columns.
Like VLOOKUP, the INDEX and MATCH functions pull in data from another dataset into one central location. Here are the main differences:
- VLOOKUP is a much simpler formula. If you’re working with large data sets that would require thousands of lookups, using the INDEX and MATCH function will significantly decrease load time in Excel.
- The INDEX and MATCH formulas work right-to-left, whereas VLOOKUP formulas only work as a left-to-right lookup. In other words, if you need to do a lookup that has a lookup column to the right of the results column, then you’d have to rearrange those columns in order to do a VLOOKUP. This can be tedious with large datasets and/or lead to errors.
So if I want to combine information in Sheet 1 and Sheet 2 onto Sheet 1, but the column values in Sheets 1 and 2 aren’t the same, then to do a VLOOKUP, I would need to switch around my columns. In this case, I’d choose to do an INDEX and MATCH instead.
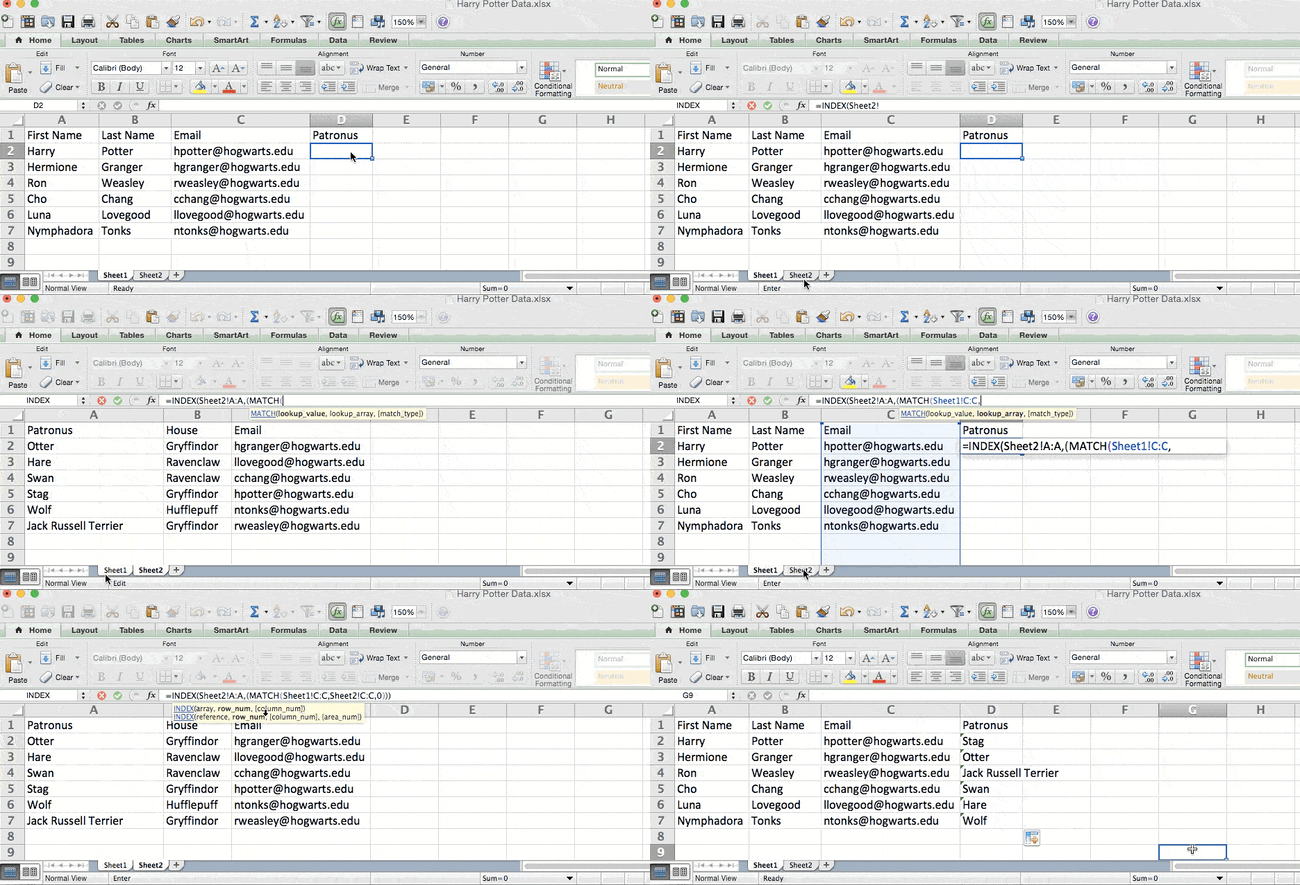
Let’s look at an example. Let’s say Sheet 1 contains a list of people’s names and their Hogwarts email addresses, and Sheet 2 contains a list of people’s email addresses and the Patronus that each student has. (For the non-Harry Potter fans out there, every witch or wizard has an animal guardian called a “Patronus” associated with him or her.) The information that lives in both sheets is the column containing email addresses, but this email address column is in different column numbers on each sheet. I’d use the INDEX and MATCH formulas instead of VLOOKUP so I wouldn’t have to switch any columns around.
So what’s the formula, then? The formula is actually the MATCH formula nested inside the INDEX formula. You’ll see I differentiated the MATCH formula using a different color here.
The formula: =INDEX(table array, MATCH formula)
This becomes: =INDEX(table array, MATCH (lookup_value, lookup_array))
The formula with variables from our example below: =INDEX(Sheet2!A:A,(MATCH(Sheet1!C:C,Sheet2!C:C,0)))
Here are the variables:
- Table Array: The range of columns on Sheet 2 containing the new data you want to bring over to Sheet 1. In our example, “A” means Column A, which contains the “Patronus” information for each person.
- Lookup Value: This is the column in Sheet 1 that contains identical values in both spreadsheets. In the example that follows, this means the “email” column on Sheet 1, which is Column C. So: Sheet1!C:C.
- Lookup Array: This is the column in Sheet 2 that contains identical values in both spreadsheets. In the example that follows, this refers to the “email” column on Sheet 2, which happens to also be Column C. So: Sheet2!C:C.
Once you have your variables straight, type in the INDEX and MATCH formulas in the top-most cell of the blank Patronus column on Sheet 1, where you want the combined information to live.
14. Use the COUNTIF function to make Excel count words or numbers in any range of cells.
Instead of manually counting how often a certain value or number appears, let Excel do the work for you. With the COUNTIF function, Excel can count the number of times a word or number appears in any range of cells.
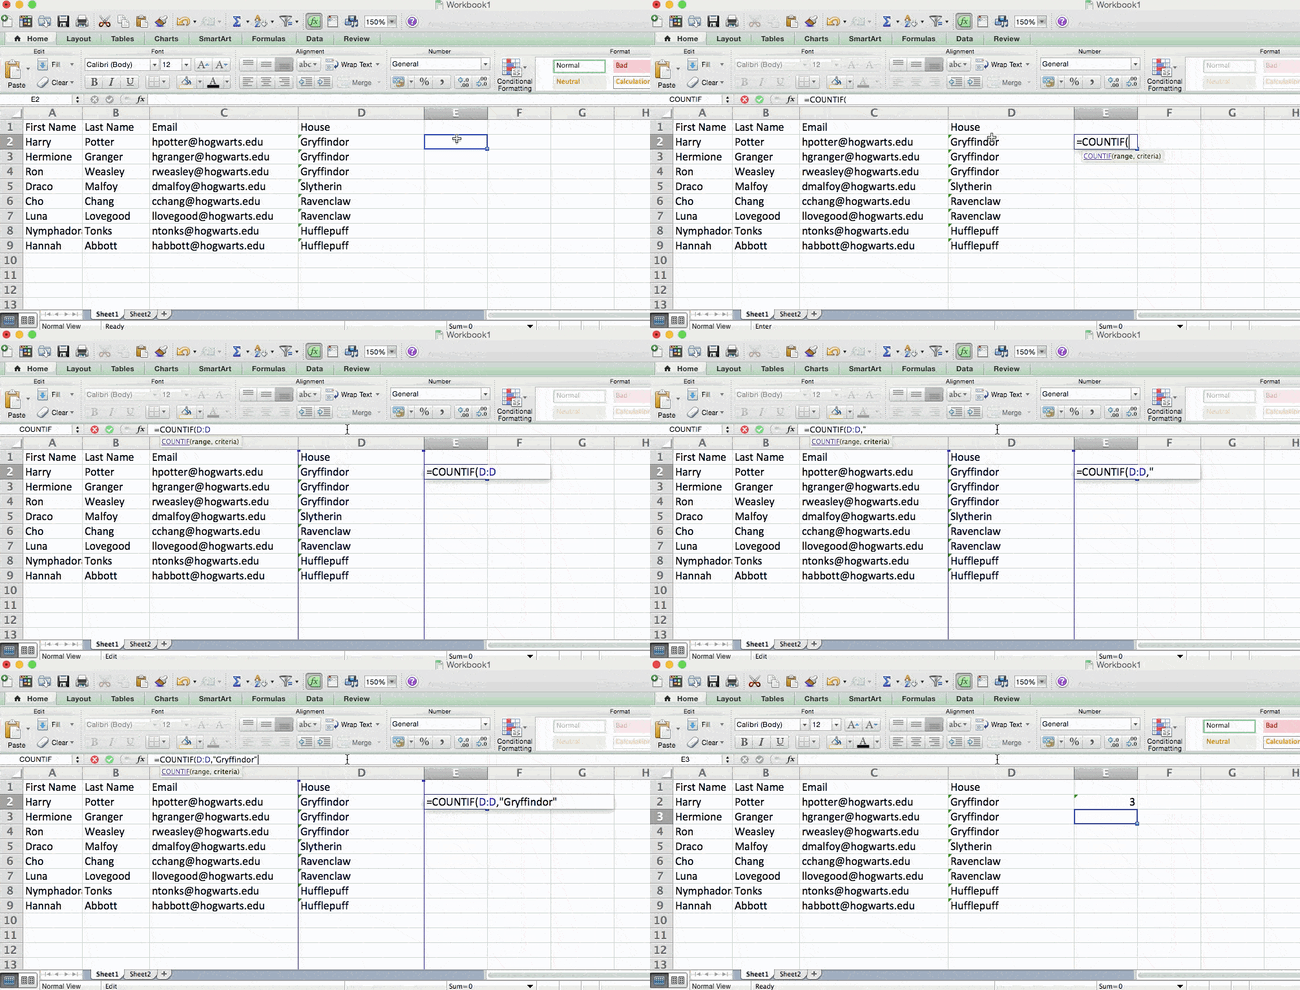
For example, let’s say I want to count the number of times the word “Gryffindor” appears in my data set.
The formula: =COUNTIF(range, criteria)
The formula with variables from our example below: =COUNTIF(D:D,”Gryffindor”)
In this formula, there are several variables:
- Range: The range that we want the formula to cover. In this case, since we’re only focusing on one column, we use “D:D” to indicate that the first and last column are both D. If I were looking at columns C and D, I would use “C:D.”
- Criteria: Whatever number or piece of text you want Excel to count. Only use quotation marks if you want the result to be text instead of a number. In our example, the criteria is “Gryffindor.”
Simply typing in the COUNTIF formula in any cell and pressing “Enter” will show me how many times the word “Gryffindor” appears in the dataset.
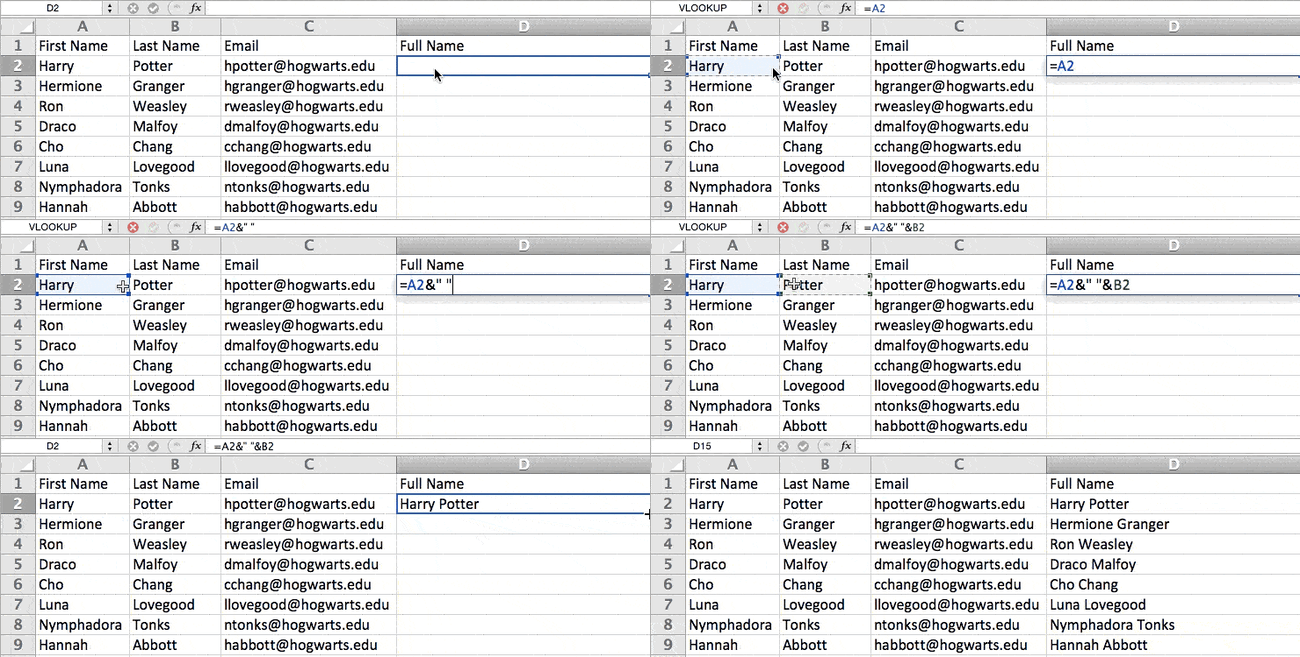
15. Combine cells using &.
Databases tend to split out data to make it as exact as possible. For example, instead of having a column that shows a person’s full name, a database might have the data as a first name and then a last name in separate columns. Or, it may have a person’s location separated by city, state, and zip code. In Excel, you can combine cells with different data into one cell by using the “&” sign in your function.
The formula with variables from our example below: =A2&” “&B2
Let’s go through the formula together using an example. Pretend we want to combine first names and last names into full names in a single column. To do this, we’d first put our cursor in the blank cell where we want the full name to appear. Next, we’d highlight one cell that contains a first name, type in an “&” sign, and then highlight a cell with the corresponding last name.
But you’re not finished — if all you type in is =A2&B2, then there will not be a space between the person’s first name and last name. To add that necessary space, use the function =A2&” “&B2. The quotation marks around the space tell Excel to put a space in between the first and last name.
To make this true for multiple rows, simply drag the corner of that first cell downward as shown in the example.
16. Add checkboxes.
If you’re using an Excel sheet to track customer data and want to oversee something that isn’t quantifiable, you could insert checkboxes into a column.
For example, if you’re using an Excel sheet to manage your sales prospects and want to track whether you called them in the last quarter, you could have a “Called this quarter?” column and check off the cells in it when you’ve called the respective client.
Here’s how to do it.
Highlight a cell you’d like to add checkboxes to in your spreadsheet. Then, click DEVELOPER. Then, under FORM CONTROLS, click the checkbox or the selection circle highlighted in the image below.
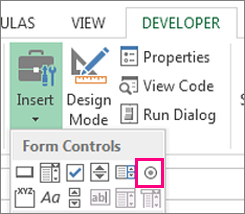
Once the box appears in the cell, copy it, highlight the cells you also want it to appear in, and then paste it.
17. Hyperlink a cell to a website.
If you’re using your sheet to track social media or website metrics, it can be helpful to have a reference column with the links each row is tracking. If you add a URL directly into Excel, it should automatically be clickable. But, if you have to hyperlink words, such as a page title or the headline of a post you’re tracking, here’s how.
Highlight the words you want to hyperlink, then press Shift K. From there a box will pop up allowing you to place the hyperlink URL. Copy and paste the URL into this box and hit or click Enter.
If the key shortcut isn’t working for any reason, you can also do this manually by highlighting the cell and clicking Insert > Hyperlink.
18. Add drop-down menus.
Sometimes, you’ll be using your spreadsheet to track processes or other qualitative things. Rather than writing words into your sheet repetitively, such as “Yes”, “No”, “Customer Stage”, “Sales Lead”, or “Prospect”, you can use dropdown menus to quickly mark descriptive things about your contacts or whatever you’re tracking.
Here’s how to add drop-downs to your cells.
Highlight the cells you want the drop-downs to be in, then click the Data menu in the top navigation and press Validation.
From there, you’ll see a Data Validation Settings box open. Look at the Allow options, then click Lists and select Drop-down List. Check the In-Cell dropdown button, then press OK.
19. Use the format painter.
As you’ve probably noticed, Excel has a lot of features to make crunching numbers and analyzing your data quick and easy. But if you ever spent some time formatting a sheet to your liking, you know it can get a bit tedious.
Don’t waste time repeating the same formatting commands over and over again. Use the format painter to easily copy the formatting from one area of the worksheet to another. To do so, choose the cell you’d like to replicate, then select the format painter option (paintbrush icon) from the top toolbar.
Excel Keyboard Shortcuts
Creating reports in Excel is time-consuming enough. How can we spend less time navigating, formatting, and selecting items in our spreadsheet? Glad you asked. There are a ton of Excel shortcuts out there, including some of our favorites listed below.
Create a New Workbook
PC: Ctrl-N | Mac: Command-N
Select Entire Row
PC: Shift-Space | Mac: Shift-Space
Select Entire Column
PC: Ctrl-Space | Mac: Control-Space
Select Rest of Column
PC: Ctrl-Shift-Down/Up | Mac: Command-Shift-Down/Up
Select Rest of Row
PC: Ctrl-Shift-Right/Left | Mac: Command-Shift-Right/Left
Add Hyperlink
PC: Ctrl-K | Mac: Command-K
Open Format Cells Window
PC: Ctrl-1 | Mac: Command-1
Autosum Selected Cells
PC: Alt-= | Mac: Command-Shift-T
Other Excel Help Resources
- How to Make a Chart or Graph in Excel [With Video Tutorial]
- Design Tips to Create Beautiful Excel Charts and Graphs
- Totally Free Microsoft Excel Templates That Make Marketing Easier
- How to Learn Excel Online: Free and Paid Resources for Excel Training
Use Excel to Automate Processes in Your Team
Even if you’re not an accountant, you can still use Excel to automate tasks and processes in your team. With the tips and tricks we shared in this post, you’ll be sure to use Excel to its fullest extent and get the most out of the software to grow your business.
Editor’s Note: This post was originally published in August 2017 but has been updated for comprehensiveness.

Waterfall Charts: The Marketing Graph You Need to Hit Your Goals
Last November, my husband and I were on our honeymoon in Maui. One of the main activities we wanted to do was a hiking tour near the waterfalls. We dreamt of swimming in the cascading water at sunrise.
When you hear the word “waterfall,” that’s typically what you imagine. However, today, we’re going to talk about a different kind of waterfall — the waterfall chart.

Waterfall charts are a data visualization resource that can help you gather and track important data such as traffic goals and lead generation. Below, let’s review what a waterfall chart is, how to read one, and how to create one.
In marketing, a waterfall chart could display the number of leads, traffic sources, or blog views over a period of time. More specifically, you could use a waterfall chart to showcase how your blog traffic has increased or decreased in the last year, giving values month over month.
You could potentially use line charts, bar charts, and even bullet graphs to show this type of data. But waterfall charts have the advantage of showing your gains as they’re impacted by losses over time.
Why use a waterfall chart?
You should use a waterfall chart instead of other types of charts when trying to visualize data that experiences both gains and losses. It’s especially useful if you want to see how a loss affects a subsequent value.
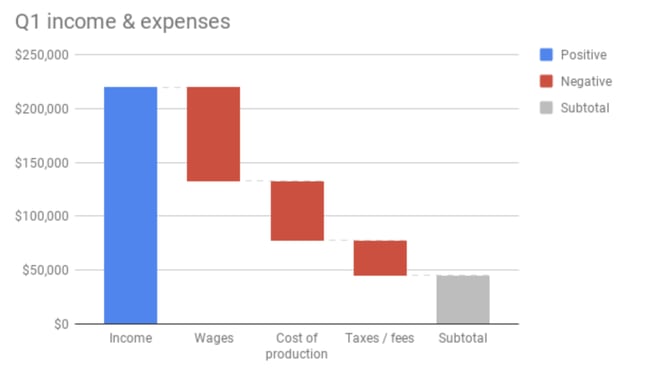
One of the reasons that waterfall charts are effective in marketing is because they give context to the data it’s reporting. Most data visualizations suffer from ignoring circumstances that result in a fall or rise in numbers, such as seasonality.
For instance, let’s say you create a waterfall chart of your Twitter followers over time. Rather than using a line graph that shows your total number of users over time, a waterfall chart shows how many you lost — and how that impacts subsequent figures.
At first glance, these charts can be difficult to read. Below, let’s review how to read a waterfall chart.
How to Read a Waterfall Chart
Reading a waterfall chart will seem foreign at first if you’ve never done it.
However, it’s important to remember that you’re reading it sequentially, from left to right.
For instance, let’s say you’re tracking blog traffic from month to month. On the far left, you’ll have the total traffic from the previous year. Then, you’ll include the gains and losses month over month for the entire year. At the end of the chart, you’ll see the total traffic for the year.
Here’s what that looks like:
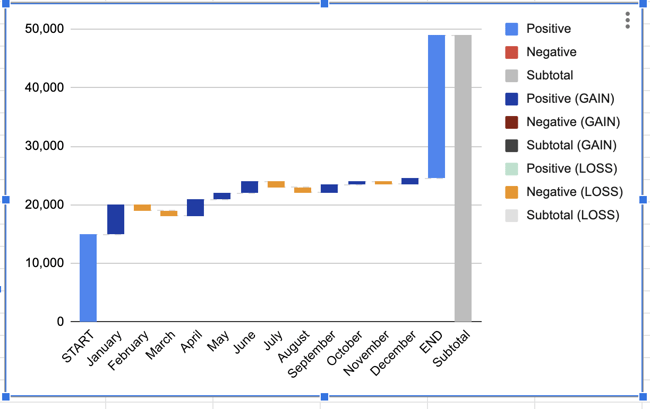
Notice how each value ends either where the previous value ended or began. In January, there was a gain of 5,000 visitors, but in February and March, there was a loss of 2,000. April’s traffic value takes that into account by starting from the -2,000 figure and going up from there.
Essentially, a waterfall chart is supposed to show you where you started and where you ended up, with details of how you got there. In this example, you can see which months gained the most traffic compared to the months that lost traffic. This could help you see seasonal adjustments, while also keeping the big picture in mind.
Now, you might be wondering, “That chart looks difficult to make. How can I make my own in Excel?” Below, we’ll review the simple process of creating your own waterfall chart.
Not sure how to actually get it done? Below, we include a template and further instructions.
Bonus: You’ll also find instructions for creating waterfall charts in Google Sheets, in case that’s your preferred spreadsheet software.
Waterfall Excel Template
1. Gather your data.
Before creating your chart, you’ll need to compile the data you’d like to use.
For example, are you tracking blog traffic numbers? Or perhaps you’re looking at leads generated from a certain marketing campaign? Either way, before you can create a waterfall chart, you’ll need to gather your data.
2. Create a table with four columns.
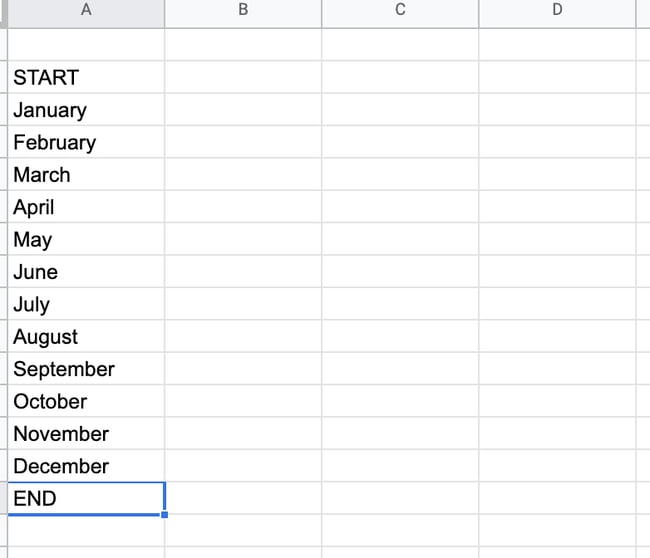
For this template, we’ll track blog traffic. Create a table with four columns. The first two columns will have no headings. In cells A2 to A15, write START, then all 12 months, then END.
3. Enter your data in Sheets or Excel.
Open Excel or Google Sheets, and begin manually entering your data. When you enter your data, make sure you denote the difference between positive and negative values. To denote a negative value, just add a minus sign in front of the number.
Note: all numbers in this example are arbitrary and not reflective of traffic to any blog.
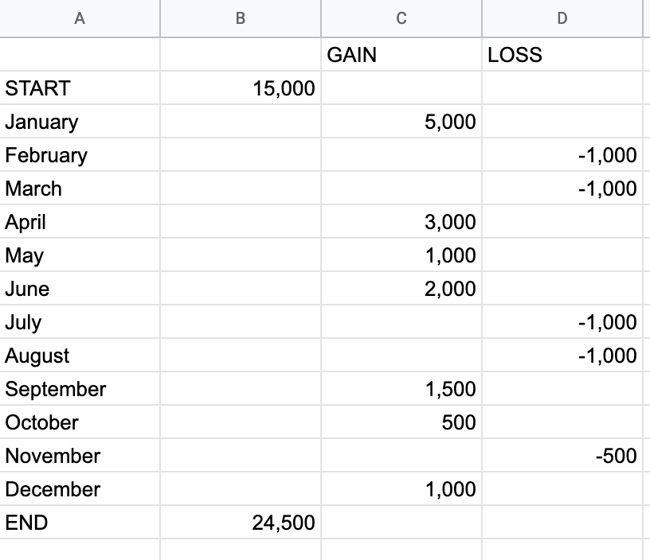
In cell C1, write “GAIN,” and in cell D1, write “LOSS.”
From there, place your traffic numbers. How much traffic are you starting with? Write that in cell B2, next to START. Then, for each month, write how much you gained or lost.
4. Add up your values.
Add everything together, including negative values, and place them in cell B15, next to END.
5. Highlight all of your data.
Now that you have your values, highlight the table you just created.
6. Insert your waterfall chart.
If using Google Sheets, go to Insert → Chart → Waterfall chart.
This will create a waterfall chart and the Chart Editor will show up on the right-hand side. When the Chart Editor comes up, make sure that “Waterfall Chart” is selected under Chart Type.
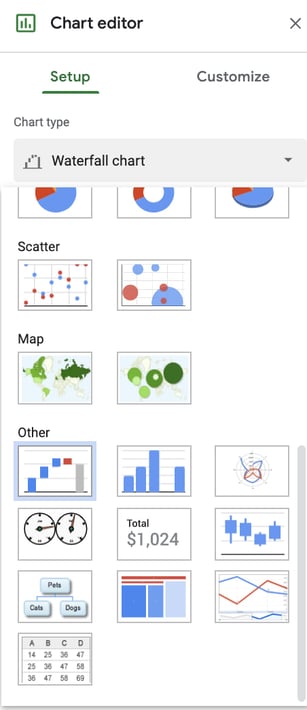
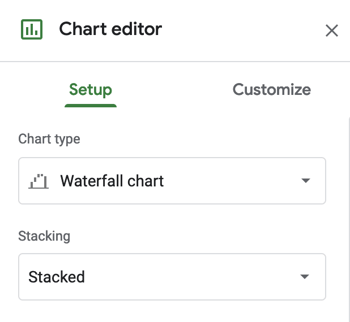
If using Excel, go to Insert → [Waterfall chart symbol] → Waterfall.
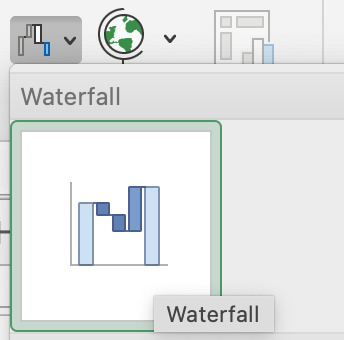
Your chart will automatically be created based on the values in our template.
7. Format your waterfall chart.
At this point, all the hard work is done. All you have to do is format your chart and make sure it looks how you want.
In Google Sheets, click on the three dots in the upper right-hand corner of the chart and hit Edit Chart. You’ll get to the Chart Editor. Here, you can choose the colors of your bars, adjust your legend, or add gridlines. Most likely, the main thing you’ll want to do here is to adjust your legend.
In Excel, you’ll click on the chart, then choose “Chart Design” and “Format” on the top ribbon to make the chart look the way you want it to.
The process of creating a waterfall chart manually can be a hassle. Luckily, you can also create a waterfall chart using a dedicated dashboard tool. For example, HubSpot offers marketing dashboard and reporting software that you can use to create charts. Here’s how.
How to Create a Chart in HubSpot
1. Go to Analytics Tools.
Once you log in to your portal, hover over the Reports tab and click into the Analytics Tools.
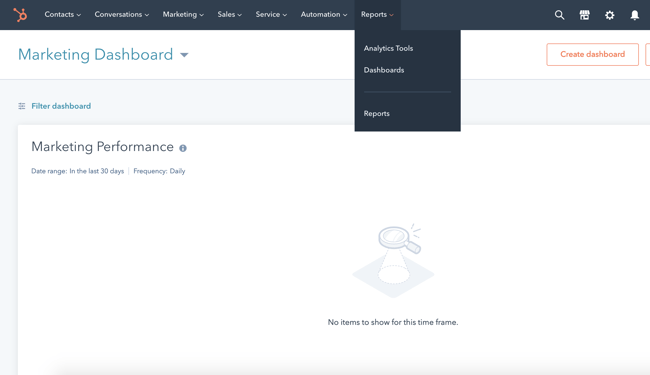
2. Choose what you want to track.
Next, you’ll choose what you want to track. Perhaps you want to analyze blog traffic like we did in the example above. Or maybe you want to review analytics for a certain campaign.
Either way, you can choose what you want to track in the Analytics Tools.
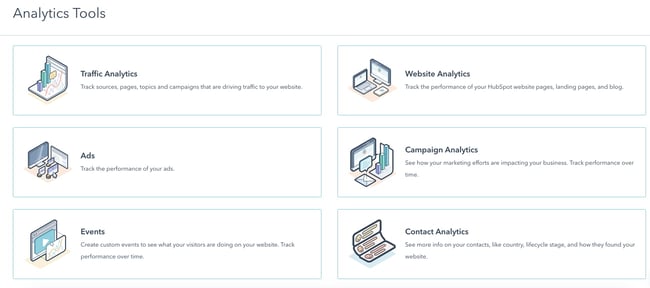
3. Choose the chart type.
Lastly, all you have to do is choose the style chart you want. Right now, you can choose between an Area chart, Column chart, Line chart, or Combination chart. You’ll want to choose “Column,” which is closest to the waterfall chart format.
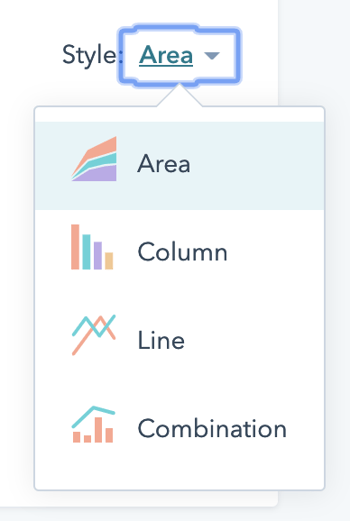
Waterfall Analysis
To recap, here’s how to understand your waterfall chart:
A waterfall chart shows a series of negative and positive values. Each value impacts the value after it.
Example:
If one week you lose 3 leads, the next value will take that into account. If you gain 5 leads, the waterfall chart will use -3 value as a starting point, so that your ending point is a gain of 2 leads.
Each column is color-coded to distinguish positive from negative values.
Now that we have refreshed how to read and understand a waterfall chart, let’s dig into how to analyze it.
1. Examine the time ranges with the greatest losses.
Which months or weeks did you see the greatest losses? It’s important to see and understand these figures to get the most out of your chart. From there, you can troubleshoot or come up with a new strategy for those months.
2. Examine the time ranges with the greatest gains.
Conversely, look at the time ranges that saw the greatest gains. You’ll want to emulate what you did during those months — or research trends that gave you a boost during those times.
3. Examine the net change over the entire time range.
From start to end, how big of a difference did you see? Was it a positive or negative difference? Could your business have seen better results?
4. Look at week-to-week gains and losses after implementing a new strategy.
After creating a new strategy, it’ll be helpful to use a waterfall chart to see how it impacts you from week to week — whether you’re seeing more positive or negative results.
Use a waterfall chart to better analyze your performance.
To ensure you’re examining the full scope of your analytics, we recommend creating a waterfall chart. It’s a worthwhile data visualization tool that can help you understand your analytics sequentially. No longer do you have to rely on typical line graphs — with a waterfall chart, you’ll understand your gains and losses over time at a much more granular level.
Editor’s Note: This post was originally published in May 2011 and has been updated for freshness, accuracy, and comprehensiveness.

How to Improve Your Communication Skills in 5 Simple Steps
In the workplace, each employee may have their own tasks and targets, but together, you are all working toward the same end goal.
But with so many different people coming together, there’s bound to be some friction on how to implement ideas and strategies best. The key to helping your team succeed is communication.
Communication is a collaborative effort, and everyone can stand to work on their communication skills. While some workers may feel shy and won’t share their brilliant ideas, other team members may struggle to see or understand different points of view.

No matter where you are with your communication skills, you can improve them with five simple steps, leading to a more collaborative and productive team.
How to Improve Communication Skills in the Workplace
 Improving communication skills in the workplace can involve many different elements. Whether you want to be a better listener or check in with each employee, there are several ways to help your team communicate more effectively with each other. Here are five easy ways to start bettering your communication skills.
1. Be an active listener.
Are you truly listening to your team members? If you’re doodling away in a meeting, writing emails during a Zoom call, or interrupting with your own ideas or solutions, you’re not actively listening. Luckily, there are plenty of ways to improve your listening skills to ensure your co-workers feel heard.
- Make eye contact when others are speaking.
- Put away distractions. You can take notes, but don’t doodle, send emails, or type out texts when someone is trying to speak with you.
- Pay attention to the other person’s tone and body language.
- Hold your thoughts until the person is completely done speaking. When it is your turn, respond appropriately and reflect back the information just shared with you to show your attentiveness.
- Nod and smile as appropriate while the other person is talking. If possible, try to avoid tugging at your hair, fingers, or other nearby objects.
- Don’t plan out what to say next in your head. You can quickly become consumed by these thoughts and miss what the other person is saying.
- Hold judgments and opinions to yourself. Avoid jumping to conclusions, and instead, let the person share everything they have to say.
- Once the person has finished speaking, ask questions to clarify any points you are unsure about.
2. Hold effective meetings.
If you just start adding meetings to the calendar every other day, you’re probably going to have a lot of groaning and grumbling employees. Improving communication doesn’t mean hosting more meetings. The trick is to host efficient and meaningful meetings instead.
- First thing’s first. Determine what meetings are necessary, and which ones would be better off as emails. Wasting time in unproductive meetings leaves employees with less time and energy to get their essential tasks completed.
- Create outlines for each meeting. This helps keep everyone on topic, and you can divert back to the outline any time the conversation starts to stray.
- Invite only the people who truly need to attend the meeting. While communication company-wide is important, it’s counterproductive to invite people to a meeting who have no need to be there. If there are a few points that pertain to someone, but they don’t need to be there for the whole meeting, invite them to attend and start with those points. Better yet, send it in an email.
- Leave the meeting with defined action items. This helps make the meeting worthwhile.
- Follow up with the team after the meeting. Send notes on what the meeting covered, and end with the action items expected of the team.
3. Explain the why.
When you ask an employee to start doing research for a new project or download reports, try explaining why you’re asking them to do the task. You may ask an employee to download reports for something they worked on last month.
With no explanation, they may worry that their performance was poor and they are in trouble when really you just want to apply the numbers to a new company initiative you’re working toward.
Regardless of the task and reason, share why you are asking for certain things. This can also help avoid misunderstandings and miscommunications among the team.
4. Check-in with employees.
Even if you have an open-door policy that invites employees to speak their minds to you at any time, not everyone will take advantage of this open communication line. Some employees may feel nervous to share their thoughts or prefer to keep to themselves.
Host one-on-one meetings periodically, perhaps once a month or per quarter, to check in with each team member. Ask them about the progress on their tasks, check if they are feeling overwhelmed, and invite them to share their ideas and goals.
5. Ask for feedback.
Communication is a two-way street. In addition to leading productive meetings and checking in with employees on their tasks and project progress, you should also welcome feedback on your own performance and the company as a whole.
This can happen during one-on-one meetings, or offer regular surveys for employees to fill out. Offer an option to submit feedback anonymously as well, which can help some employees feel more comfortable speaking up.
When you receive feedback, don’t just push it to the side and forget about it. Make an action plan to work on improving your own weaknesses. If you receive feedback that applies to the company, make sure to share that information with your management as well.
Additional Options for Better Communication Skills
While these five steps are a great place to start, there are other ways to boost communication skills in the workplace. Utilize technology, such as Google Chat or Slack, to create communication channels.
If you do use an app or other communication tools, consider applying limits to when those lines are open. Constant 3 a.m. messages about a work project can lead many employees to feel burnt out if they can never switch off from work mode.
Ask your co-workers about their communication preferences, too. Surely there will be times where you have to have a meeting for everyone, but keep communication preferences in mind when you need to reach out to just one or two people. Some people retain information best when they can read it in an email, while others prefer to talk out ideas in person.
When you’re establishing effective communication among your team, make sure you include everyone. Of course, you only want to loop people into an email when it is relevant to them, but as a whole, include everyone — even if they aren’t in your section of the office or even in the same city — in your communication policies.
Finally, consider establishing an open-door policy to let employees stop by your office to discuss concerns or thoughts at any time.
Benefits of Strong Communication Skills
The benefits of improving your communication skills are seemingly endless. When everyone feels heard, there are fewer chances of tense confrontations. Plus, your team will spend less time fixing misunderstandings that happened because one person wasn’t actively listening or someone else was interrupting a meeting. That means boosted productivity and more time spent on meaningful tasks.
When your team communicates effectively across the board, you’re likely to improve the customer experience, too. Employees can meet client needs more efficiently when they can work through challenges together, and they can make sure there are minimal miscommunications that leave tasks falling through the cracks.
Better communication skills mean that every employee feels heard and more comfortable sharing their ideas. That means your team can bring more ideas to the table, which will help your company set and achieve new goals.
Communication Is Key In the Workplace
Your team is only as strong as their communication skills are. Taking time to utilize communication tools, review feedback, set meeting agendas, and conduct one-on-one sessions with employees will result in more employee engagement and productivity across the board.
Communication works both ways, so be sure to work on your own communication skills and help your team improve their communication. In the end, your company will be all the better for it.


The Ultimate Guide to Advertising in 2022
When you hear the word advertising, what comes to mind?
Do you think of banner ads on your favorite website? Those hilarious Super Bowl commercials? The billboards along the highway or posters in the subway stations?
While most of us have a pretty good idea of what advertising looks like, we often struggle to nail down exactly what it means — and how to do it well.
From the printing press to pop-up ads, advertising has certainly changed with the times. Despite this, though, the need for advertising hasn’t changed, and neither have the techniques and best practices that make for quality advertising. That’s what we’ll cover in this guide.

Advertising is one of the oldest types of marketing and aims to influence the actions of its audience to buy, sell, or do something else.
Good advertising is designed to be extremely influential, memorable, and, at times, risqué.
But, how does advertising work?
How does advertising work?
Advertising has a simple principle — get people interested in a product being sold.
After arousing interest, the goal is to persuade people to purchase the product, even if they hadn’t previously thought about buying it. Ads work by using psychology to influence the way people think and feel about a product or service.
Depending on the goals of your ad campaign, advertising can go to work for your company in a variety of ways:
- To raise awareness of your brand
- To drive potential customers to your business
- To promote sales for both new and existing products
- To introduce a new product or service to the market
- To differentiate your product from your competitors’
Advertising can also be executed in various ways. Radio commercials, billboards, branded t-shirts, and social media endorsements all count as advertising — as we’ll discuss later on in this guide.
What are advertisers?
Advertisers are the people at a company who are responsible for advertising a product or service. They promote messages about a brand’s products and services to build public preference for the brand.
“Advertiser” can also refer to the entity that’s paying for advertising on a billboard, in a magazine, or through a website or mobile application.
Advertisers are important because the whole business of advertising is dependent on them. It’s the advertiser that incurs the cost of advertisements, so if they decide it’s not worth running ads, then the advertisement industry will be in big trouble.
All advertisers are marketers, but not all marketers are advertisers. Let’s dig deeper into the differences between advertising and marketing.
Advertising is a subset of marketing, which is the umbrella term for communicating with your audience.
Marketing includes a number of different channels, such as:
- social media
- email marketing
- public relations
- SEO
- paid advertising.
Alternatively, advertising is just one component of marketing.
A company’s overarching marketing strategy will typically include an advertising plan. The advertising portion zooms in on the specific process of creating and publishing the persuasive messages to get customers to take action.
A Brief History of Advertising
Advertising is one of the oldest segments of business, save for currency and trade. Once products and services arose, so did the need to make them known.
The oldest confirmed piece of advertising dates back to 3,000 B.C. Technically, it was a print ad from ancient Egypt promoting the capture and return of an escaped slave.
Incidentally, the ad also mentioned the slave owner’s shop — a rug business — which inherently advertised his storefront, too. The slave was never caught, but the rug owner did discover a brand new method of bringing in traffic: advertising.
Let’s fast-forward about 4,000 years. Here’s a brief look at the past five centuries of advertising:
1472: The first poster advertisement is placed on church doors in London.
1650: The first newspaper ad — a reward for 12 stolen horses — is published. (What’s with these reward-based advertisements?)
1704: The Boston News-Letter prompts its readers to place ads in its paper.
1870: The Powers style of ad copy is born. This style packed a punch — it was short, to-the-point, truthful, and convincing. Powers said the focus should be on why the consumer should buy your product or service — a message that still resonates for good reason today.
1880: Postcards become one of the hottest new ways to reach customers.
1902: Unilever creates the “longest client-agency relationship in advertising history” when it hires J. Walter Thompson Company to advertise its Lifebuoy Soap.

1902: Mellins Food advertises its brand on 25 airship flights, becoming the first brand to take this approach.

1904: The Campbell’s Kids are created, piloting the change in advertisement focus from a single ad to an entire campaign.
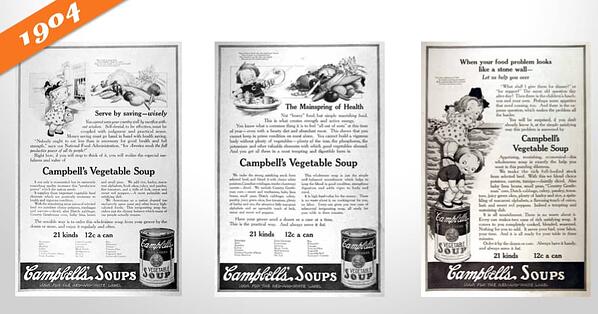
1922: Radio ads are born, and businesses purchase 10 mins for $100. Two years later brands would increase their investment by sponsoring an entire radio show, a concept that would eventually become known as “sponsored content.”
1925: Advertisers start to appeal to emotions, focusing on what pleasure customers would receive from their product or service. This old Ford ad exemplifies this perfectly.

1975: VCRs are introduced, and consumers begin to record shows and, therefore, skip advertisements.
1990: Computers become more popular and accessible at home, with over 5 million homes connected to the internet.
1994: The first email spam campaign launches. Banner ads are also introduced.
1995: Search engines like Yahoo! and Alta Vista are born. Ask Jeeves and Google would follow in 1997 and 1998, respectively.
2005: YouTube and Facebook (for college students only) launch.
2008: Brands start to realize the importance of having an online presence for their potential customers. Procter and Gamble pilot the concept of the content hub with BeingGirl.com.
2012: Online videos reach almost 170 million viewers.
2013: Sites like Pinterest and Instagram join the social network scene.
2020: Advertising soars on digital platforms including social media, podcasts, pay-per-click (PPC), and more. Customer data plays a larger role in advertising targeting and retargeting. Lastly, a rapid increase in mobile devices sees a boost in mobile ads and SMS marketing.
History teaches us that advertising is an ever-changing concept, just like shopping habits and how and where consumers spend their time.
Whereas almost 140 years ago, postcards were the newest form of advertising, brands today are building chatbots for Facebook Messenger and integrating artificial intelligence into their marketing and sales platforms.
Things in the advertising world move fast. Now, let’s take a look at how advertising methods have changed and what marketers and advertisers are using today.
Advertising can look like many different things. Here are the different advertising types and channels advertisers have been using over the years.
1. Print Advertising
Print advertising refers to posters, bulletins, flyers, and other physically-printed promotions. It also refers to newspaper and magazine ads.
How we design and consume print advertising has changed over the years, but it’s been a steadfast advertising medium — especially as digital advertising has evolved (which we’ll cover next).
Unlike digital media, print advertising can’t be tracked and analyzed as clearly. Fortunately, brands have found brilliant ways to incorporate print advertising into broader digital campaigns.
2. Billboards and Public Transit Ads
Billboard advertising encompasses print advertising on a much larger scale. Due to their size, the design, placement, and cost of billboard and public transit ads are different from typical print advertising.
For example, billboards are typically designed with few to no words so that viewers have time to process the message while passing by in a car or train. Also, these ads are used for brand awareness, so they usually only include a brand name or phone number (versus a website).
3. TV Commercials
TV commercials are short advertisements developed and paid for by companies and organizations looking to capture the audience of a TV show or network program. TV ads have been around since the invention of the television and have since changed drastically with the birth of streaming TV.
TV ads have a wide reach (millions) and provide viewers with a multi-sensory ad experience — something print ads and some digital ads can’t quite do. Alternatively, TV ads are expensive, avoidable by your audience, and hard to target as accurately as other channels.
4. Radio
Radio advertising refers to spoken advertising spots aired on radio channels between music and other programs. This method dates back to 1920 when commercial radio first aired.
Radio advertising is particularly powerful for local and regional advertising. Nowadays, podcast advertising is a similar but more effective method, especially for national audiences.
5. Event Advertising
Events (both in-person and virtual) are opportunities to connect with your audience while promoting your brand and products. You can host your own event (as HubSpot does with INBOUND) in the form of a conference, webinar, roundtable, or luncheon.
Another form of event advertising is by sponsoring an event or purchasing a booth at a conference or trade show. This is less expensive than hosting your own event, but you still get to engage audience members and promote your brand.
6. Direct Mail
Direct mail advertising includes postcards, pamphlets, and catalogues mailed directly to the homes of your target audience. A direct mail advertising strategy is more personal than others on this list, but it’s also very costly. (Consider the cost of postage alone.)
Another direct mail strategy is electronic mail, typically through the form of email newsletters or promotions. This overlaps with our next section — digital advertising. That’s what we’ll unpack next.
Digital Advertising: How to Advertise Online
As of today, there are over 4 billion people using the internet. This number is up 300% from 2005. Point being, internet usage is skyrocketing, and it’s not stopping.
If you’re not advertising online, you’re behind the curve. Not only does the internet offer you direct access to more than half the global population — including more than half of your target audience — but it also provides so many different advertising types and channels on which to advertise.
Marketers now have the flexibility to reach their target audiences on multiple fronts, in multiple ways, for multiple budgets. There are also a number of tools (many of which are free) that can help you execute your advertising strategy.
Here are the most common ways to advertise online:
Paid Search Advertising
Whether Google, Yahoo, or Bing, all search engines have their own paid advertising. This is referred to as pay-per-click, or PPC, and involves bidding on keywords and placing ads at the top or sides of search results.
When someone performs a query using one of those search engines, advertisers have the ability to display ads above organic search results. That’s what makes PPC so powerful — it gives your advertisements prime real estate in front of people already searching for relevant topics.
Here’s an example on Google:
The top listings in the red box are advertisements. Organic search results, those that came up as a result of SEO, were below the map snippet.
Social Media Advertising
Social media platforms know how valuable their content is, and that’s why they offer the option to sponsor or boost posts. Social media ads> put your message in front of your target audience and encourage them to engage, click-through, and buy.
More and more, social media sites are prioritizing ad space over organic content because, well, it brings in more revenue.
Whether you’re a budding or brand new business, consider running some social media advertisements. These will not only advertise your products and services but also promote your social media pages and grow your following.
Platforms like Facebook, Instagram, LinkedIn, and Twitter each have their own version of ads like these.
Here’s how they appear on their respective feeds:
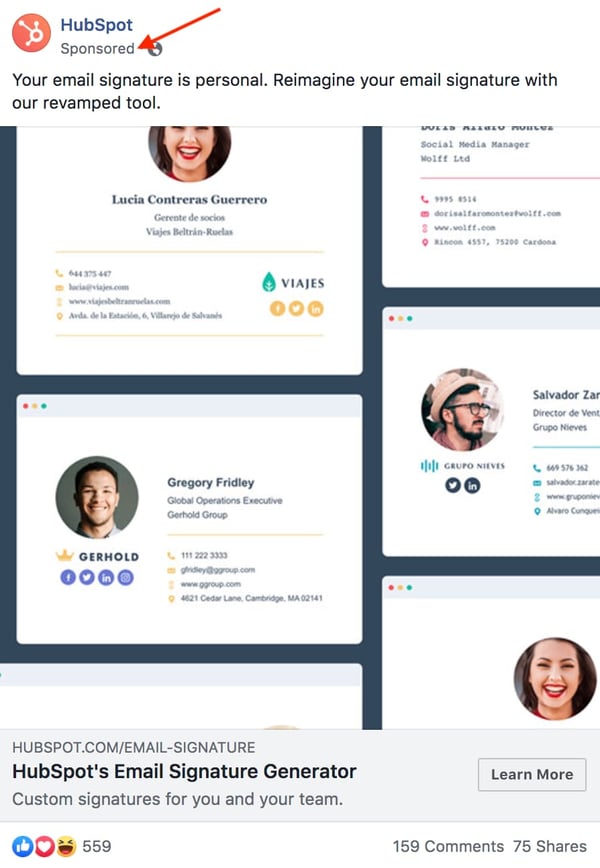
Download our free lookbook of 50 Facebook Ad Examples We Actually Clicked.

Download our free guide on How to Run Successful LinkedIn Ads.
Download our free guide on How to Use Twitter for Business.
Native Ads and Sponsored Content
Sponsored content has been around since 1922, when brands would sponsor entire radio shows. Today, sponsored content refers more to native ads and blog or article content subsidized by brands.
Have you ever read a Buzzfeed article that heavily referenced or recommended a certain product or service? It was likely sponsored by a certain brand.
Check out this article, 10 Reasons To Put Away Your Phone On Your Next Trip, promoted by agoda, a hotel or destination booking site. Does it blatantly promote agoda’s services? No. Its primary purpose is to entertain and inform, although agoda is referenced a few times throughout the content.
At the top, the byline reflects agoda’s sponsorship, just before the content starts. And, as you scroll down the page, another ad sits within the content.
Sponsored content is a great way to promote your brand in content your audience is already familiar with.
Banner and Display Ads
Banner and display ads are an extension of search ads and follow a similar PPC model. But instead of a text-based ad, consumers see a more visual advertisement.
Banner ads are typically the horizontal boxes on top of a web page, whereas display ads are smaller in nature and shown on the side (like in the screenshot above).
Whether you opt for traditional print ads in magazines or subway stations or choose online promotion on social media or search engines, there are a few rules that make for great advertising. Below are some advertising best practices to apply to all your ads.
Advertising Best Practices
There are a lot of best practices, tips, and tricks when it comes to advertising. It’s an art that’s been perfected over the years, and with the rise of modern types of advertising channels and new media, best practices continue to manifest.
These advertising best practices are:
- Appeal to emotions
- Create positive associations
- Establish a bandwagon effect
- Focus on benefits over features
- Leverage storytelling
In this section, though, we’re going to cover these five famous advertising concepts that still work today — regardless of what type of advertising method or medium you’re using.
When used correctly, these advertising techniques will do wonders for your brand and products.
Appeal to emotions.
While you may not consider the ASPCA a business, their unforgettable Sarah McLachlan commercial is the perfect example of using emotional appeal to entice people to take action.
For most of us, the images in that commercial are hard to watch — we may even turn away. But since it tugs at our heartstrings, we’re more likely to donate to animals in need after seeing the horrors they’re going through.
Create positive associations.
When consumers associate your product with a feeling of happiness, state of achievement, or accomplished goal, they’re more likely to take notice, remember your product or service, and make a purchase.
Actually, you’ve probably been on the receiving end of this before without even realizing it. Have you ever seen your favorite celebrity or Instagram influencer posing with a product or brand and found that you wanted to be, do, or look the same? Companies create this subconscious connection in advertising hoping that you associate your positive feelings with the product or service they’re promoting.
For example, Under Armour uses Dwayne “The Rock” Johnson to create a subconscious connection with customers. It apparently works, since his Rock Delta shoes were the fastest-selling Under Armour shoes of 2017.

Catchy songs like “Nationwide is on your side” is an example of helping people associate friendliness with the Nationwide brand. Coca-Cola has a brand advertising campaign that associates their product with friends, family, and fun. When you consider what refreshments to serve at a party or bring on a picnic, Coca-Cola wants you to think of them.
As you create your advertisements, consider what feelings, desires, or goals with which you want your brand to be associated. Weave these feelings or goals into your advertisements through stories or videos. Look for influencers who align with your brand’s core values and demeanor and include them to promote positive association.
People want to fit in. It’s human nature. Neither you nor I are immune to it.
And it’s this base human desire that makes the bandwagon effect so effective. People don’t want to be left out. They find value in their peers’ opinions, and they certainly don’t want to be the only ones not using the latest and greatest product.
Brands like Maybelline understand this concept well and use it to their advertising advantage. One tube of their top-selling mascara is purchased every two seconds, a statistic that establishes social proof and further supports their claim of “America’s Favorite Mascara.”

Use customer testimonials, survey data, or shareable content to advertise your brand as one worth following or buying into. Take another approach by promoting a discount for sharing your brand with a friend or family member — so your audience will do the selling for you. Either way, use your advertising to create an inclusive environment people will want to join.
Focus on benefits over features.
Features and benefits are two very different things. Features are the details of the product or service you’re selling, such as the measurements of a couch or the ingredients of a protein bar. Benefits, on the other hand, explain why a person should buy a couch or protein bar from you and how their life would, well, benefit from such a purchase.
Advertising should focus on the benefit your product or service brings, not explain what you’re physically selling.
Consider how Southwest Airlines advertises. Instead of explaining, line by line, what a Business Select ticket offers, Southwest paints a picture of what life would be like if you made a purchase. In this advertisement, they focus on the benefits.

Rather than wasting precious ad space on your product specifications or service details, talk about the ways a purchase might positively impact your customers. If you do it right, your creative, benefit-packed advertisement would then inspire them to research the features on their own.
Leverage storytelling.
Not unlike our desire to fit in is our penchant for a good story. Storytelling helps paint a bigger picture of a brand or company, not simply promote a single product or service. Also, when stories resonate with someone, it’s far easier to motivate him or her to take action.
Storytelling is the one technique you should try to infuse in all your advertising. In fact, if you haven’t started crafting your brand’s overall story, you should definitely do so. Research shows that stories that illustrate a brand as “necessary, believable, and integral” are the most effective for engaging and influencing consumers.
Dove employs storytelling in its campaign partnership with Operation Homefront. The videos feature real stories of military men and their families being reunited. The advertisements don’t directly promote Dove products but instead tell the Dove brand story (and pull on a few heartstrings, too).
Determining your brand story will help you learn how to best discuss your brand in all marketing efforts, not just advertising.
Next, let’s take a look at some of the most memorable ad campaigns, a few of which put these best practices in action.
Five Memorable Ad Campaigns
The best advertisements are the best teachers. Whether it’s the copywriting, design, medium, or target audience, well-executed campaigns can always teach you something new about advertising or positioning.
(Consider Westinghouse Electric’s “We Can Do It” ad …)
Here are five campaigns that left a noticeable mark on advertising history.
1. Nike: Just Do It
In the late 1980s, Nike launched its “Just Do It” campaign.
At the time, Reebok was outselling Nike, and Nike needed to act fast to compete against the sneaker conglomerate.
But it wasn’t just the three-word phrase that earned global attention. Their new ad campaign also focused on real people wearing and working out in their products, as opposed to simply featuring clothes and sneakers themselves.

This powerful combination of people plus product helped Nike go from $800 million in 1988 to $9.2 billion just 10 years later.
2. The Absolut Vodka Bottle
Did you know Absolut’s “Bottles in the Wild” ad series is the longest uninterrupted campaign in history?
The campaign was Absolut’s attempt to grow their name internationally, especially throughout the United States. It featured the Absolut bottle in different cities and countries worldwide.

It launched in 1985 and ran until 2000 — lasting an impressive 25 years.
Absolut’s campaign helped grow the company from a tiny slice of the vodka market share (2.5%) to over half the U.S. imported market share.
To this day, the Absolut brand is the fourth largest spirit company, thanks to its focus on the overall story, not just the product itself.
3. Miller Lite
The folks at Miller Lite used differentiation to reach their goal: to get “real men” to willingly drink light beers. With their “Great Taste, Less Filling” campaign, they maintained a leading position in the light beer market for several decades after this first campaign aired.

4. Volkswagen
Though Volkswagen has officially discontinued its production of Beetles, its iconic “Think Small” campaign will be forever ingrained in advertising history.
Doyle Dane & Bernbach (DDB) advertising agency knew it had to change the mind of consumers if it wanted to compete with industry leaders. So, VW admitted that though the Beetle was, in fact, tiny, it was still a force to be reckoned with and worth a purchase.

Authenticity and honesty went a long way in this seemingly small campaign.
5. Dos Equis
With its edgy, cool, and sophisticated aesthetic, it’s no surprise “The Most Interesting Man in the World” campaign put Dos Equis on the map.
This campaign created a positive association between the Dos Equis beer and the feeling of sophistication and poise. Sales quickly jumped by 22% after the campaign launched.

Even more impressive was how Dos Equis found success in a time when craft beers grabbed a foothold in the market and imported beer took a 4% hit. This campaign was a major component of that success.
To learn how to grab the attention of your audience, learn from the professionals. These campaigns are a great example of how brands have used real stories, real people, and real talk to grow their businesses.
Advertising Helps You Grow Better
Equipped with a dense, dynamic history, advertising is an incredible tool to add to your marketing toolbox.
Between print ads, radio sponsorship, TV commercials, and social media promotion, the opportunities to advertise and promote your brand are endless.
To best connect and engage with your audience, speak your customer’s language, appeal to their emotions, and tap into their desire to be a part of a community, create a clear and authentic brand story to illustrate how your brand aligns with their values.
By applying these tried and true practices to your advertising, you’ll build a magnetic brand that attracts customers, establishes a following, and generates revenue.
Do this and your brand will grow into a household name that stands the test of time — just like advertising itself.
Editor’s note: This post was originally published in July 2018 and has been updated for comprehensiveness.


Brand Logos: 19 Logo Examples, Samples, & Sources of Inspiration
When it comes to your business’ branding strategy, establishing a logo is one of the most critical tasks.
Your logo will be pervasive throughout your marketing campaigns, and it’s one of the most prominent branding elements people will think of when someone mentions your company.

Mounting research backs up how important a logo can be to your brand. In fact, a recent study from the Journal of Marketing Research found that an effectively designed logo can “influence brand evaluations, purchase intentions, and brand performance.”
Not sure what it takes to create a killer brand logo? To give you a better idea, check out our list of stand-out logos below.
Logo Examples
1. Geometric Logos
Geometric shapes are highly effective at creating stylish and fun designs. Some can even evoke feelings of movement. It’s particularly popular amongst big brands from Google to Adidas — also proving that you don’t need to belong to a specific industry to use it. The final result is often a clean and modern design.
2. Negative Space Logos
Negative space logos are all about leveraging what you don’t see. Because these logos take more thought to execute, you can typically spot subtle meanings. For instance, you may see hidden letters, icons, or names. A great example is the FedEx logo which uses negative space to create an arrow between the “e” and “x” letters.

You don’t have to be super obvious with your negative space. Often, these logos use it to add small details that complement the main visual.
3. Typography-Based Logos

Typography can add a clever spin on traditional logos. We often see two varieties — one where typography enhances the imagery (see Hatchet), and the other where typography is incorporated within the imagery, giving it structure (see Burger King).
In the examples above, we see the text and graphics working in harmony — in other words, you can’t have one without the other.
4. Hand-Drawn Logos

Hand-drawn logos feel similar to a personal signature. It gives brands an authentic, rustic, down-to-earth, and even child-like feeling. Most incorporate a sketch of a scene, object, idea, or symbol. Because no two hand-drawn designs are alike, this style almost guarantees a unique and original logo.
5. Overlapping Logos
By using multiple layers, you can create more complex and colorful logos without overwhelming the viewer. It’s an effective strategy that “interrupts” visual elements — or even text — within a design. That said, these logos can be hard to pull off without a designer, so we recommend leaving this trend to the professionals.
Logo Examples in Ads
6. McDonald’s

McDonald’s “Follow the Arches” campaign highlights the power of logos — even if you can’t see all of it.
It features a portion of its golden arches logo along with a simple line of text — such as “On your left” and “On your right.” With the creative use of its logo and signature colors, consumers instantly recognize the brand — and know that it’s just around the corner.
7. Curtis

Curtis brings the smell and taste of fruit to life. Add the steam on top, and your mouth begins to water. The yellow logo on the tea label also brings a nice contrast to an otherwise monotone color scheme.
8. Nescafé

This black-and-white ad for Nescafé features rows and rows of zig-zags. It seems confusing at first, until you read the tagline, “Nothing wakes you up as Nescafé.”
Suddenly, these zig-zags become Z’s to represent sleep, and they eventually “wake up” and transform into the Nescafé logo. It’s a playful ad that uses symbols to illustrate the relationship between sleep and coffee.
Logo Examples in Literature
9. Underhill Press

Here’s another example of an ad that uses the power of symbolism in its logo. Books are born from trees — which is an obvious comparison. But trees also symbolize wisdom, growth, and learning — which artfully plays into the brand’s ethos. Trees are also a critical resource to the environment, as books are to people.
10. Rosebery

You can see a logo a hundred times without recognizing its full meaning — which is why I like this logo in particular.
Not only does it depict a child reading, but the book also doubles as wings. You can interpret it in multiple ways — for example, books can give kids wings to unleash their imagination or understand the world around them. It’s an effective logo that calls for a second — or even third — glance.
Sources for Logo Inspiration
Arguably the hardest part of creating a logo is knowing where to start. To light your creative spark, we’ve compiled a list of logo inspiration to get the ball rolling.
1. Creative Market

Creative Market is a designer’s playground with over 3 million unique fonts, graphics, themes, photos, and templates.
Use the search bar to browse through logos that match your style or profession. If something catches your eye, you can purchase and download designs right on the platform — or simply use it to gather inspiration.
2. Dribble
Dribble operates as an online portfolio for designers. In fact, it’s one of the largest platforms for designers to share and promote their work — making it an ideal hub for finding inspiration.
Plus, if you want to hire a professional, you can contact artists directly on Dribble or use its Project Board to post a job.
3. Logoimport

Logoimport is an Instagram account that shares designs, illustrations, and graphic inspo from various designers. The account does a great job of tagging the artist on each post, so if something piques your interest, you can view more of an artists’ work with just a few taps.
4. Behance
Owned by Adobe, Behance is a social media platform for artists to showcase and share their creative work.
What’s unique about Behance is its advanced search functionality. Want to browse logos that are all blue? No problem. Want to browse logos that are solely made with Photoshop? You can do that, too. With Behance, you can quickly narrow your searches to see the most relevant designs.
Logo Samples That Anyone Can Use
You don’t need to hire a professional designer — or have an extensive background in graphic design – to create an eye-catching logo. Instead, online resources can help you design one in just a few steps. Take a look at our list below:
1. Canva Templates

If you can’t pin down exactly what you want your logo to look like, try browsing through Canva’s premade design templates. Once you land on a design you like, simply click to download it. This will open the Canva editor where you can customize the text and color scheme of your logo.
Keep in mind that some Canva templates are free, while others may require a Pro account.
2. Logomakr
Logomakr is a tool that allows you to design a logo from scratch with thousands of stock icons and hundreds of fonts. If that’s too much of a feat, you can simply use one of its templates and customize the text, color, and graphics to match your branding.
Although Logomakr is a free tool, you have the option to pay for professional assistance should you need help designing your logo.
3. Logo Garden
If you think it takes days to create a logo, Logo Garden, a design tool, says it can be done in minutes. Its software contains a vast library of graphics, fonts, and colors to build even the most intricate logos. If you get stuck along the way, it also offers design tips and videos to guide you.
After the design is complete, just download it to your computer for a small fee.
4. Designimo
Designimo is a great starting point for anyone feeling overwhelmed by the design process. When you visit the website, you are prompted to share your company name. Once you do so, it will open a new screen with a variety of logos that feature your company name.
From here, you can visualize what style and colors best fit your brand. Or, narrow down your search results by industry — such as real estate, health care, or apparel. This will populate the most relevant designs to pick from.
5. GraphicSprings

GraphicSprings is a design software that promises beautiful logos in three easy steps — first, pick a template from its library, which are categorized under different industries. Then, edit the graphic and text of your logo with its easy drag-and-drop menu. Lastly, download your design for a small fee. Voila, it’s just that simple.
Creating an Effective Logo
Even if you think you’ve landed on a perfect design that’s classic, memorable, and valuable to your messaging, it can be helpful to look at what brands around you are doing to modernize, evolve, or improve their own designs. This way, when it’s time for your logo to get a refresher, you’ll be ready with some great ideas.

What Is Content Operations? A Straight-Forward Guide
In a 1996 essay, Bill Gates wrote, “Content is king,” and what was true then is still true now. Content is necessary to the success of a business.
If the content is the king, we could say its operations are the queen — or at least a knight. Imagine a startup that wants to create a blog post. It’s a timely post that needs to be up before the end of Q1. Because the startup is new, it hasn’t established concrete operations for blog content. So, the post sits in a Google document with no plan for who uploads the content or what blog platform will host the information. The business has a content writer, but operations don’t typically end there.

Blog posts aren’t the only content option there are. You can incorporate over a dozen different content types, including email, videos, social media posts, podcasts, infographics, and other visual content to increase brand awareness. Without content operations, though, this content likely has no plan for production, publication, or distribution. And what good is a blog post if no one reads it?
If the goal is to post content daily, then you’ll need to identify who is performing the work? What methods are they using? What systems are necessary to get the job done?
One department is the solution to these questions — content operations.
Content operations focus on three elements:
- People: who is performing a task and what their roles and responsibilities are.
- Process: what functions are needed to complete a project successfully.
- Technology: what tools help build out a content operations system.
People
In content and content operations, the people are the foundation. While customers sit at the center of content, the operations aspect focuses on the company and its team. Roles and responsibilities should be well-defined and outlined to keep the system running smoothly.
The first step is defining clear roles. Content teams have content strategists, managers, creators, editors, and more. For example, the content creation department might break down into specialized positions — content writers, graphic designers, and photographers. Although these are typical roles, some content roles and responsibilities may overlap. Content writers and editors have distinct differences. Depending on the team and its bandwidth, your writers may be responsible for editing their work. It is best to avoid overlap; however, that is sometimes impossible. As long as the roles and responsibilities are clear, the team and its operations should function successfully.
Process
Once you have a team in place, how will you get your projects from start to finish? Your people need processes. Your team — and their roles and responsibilities — will help determine workflows to keep your content moving from planning to publishing.
Say you were publishing a blog post. A sample process might go as follows:
- Step 1: Strategize and generate the idea.
- Step 2: Set a timeline and schedule for the post.
- Step 3: Write the post.
- Step 4: Edit the grammar and content.
- Step 5: Add graphics.
- Step 6: Optimize the post for SEO.
- Step 7: Publish.
- Step 8: Share.
- Step 9: Analyze.
If one of the steps in this process falls through, it impacts the overall success of the operation. Style guidelines, templates, and content governance models strengthen processes and promote accountability and consistency. These frameworks help keep content on track, but they need to be used with technology to ensure content operations are running smoothly.
Technology
The last key to successful content operations is technology or the necessary tools for accomplishing each task. Because the planning and execution of content are so extensive, teams require multiple resources to be successful.
The technology for content operations can fall into categories such as:
- Project Management & Scheduling
- Task Management
- Content Execution
- Analytics & Reports
Project Management & Scheduling
All content should appear in an editorial calendar. It is a high-level calendar that keeps track of where, how, and most specifically, when content publishes. Not to be confused with scheduling tools that send out timed posts, like Hootsuite or Sprout Social, tools for project management and scheduling include Monday and Asana.
Task Management
Monday and Asana are also great examples of task management tools. These platforms allow for the building, following, and executing of content operations by the team.
Content Execution
Content operations also require the technology needed to execute a task. What is the team using to get the job done? Writers need access to word processing tools, like Microsoft Word or Google Docs. Alternatively, designers might need a variety of web and graphic design tools like Adobe Photoshop or Canva.
Analytics & Reports
Analyzing and reporting is usually the last step in a content life cycle. Analysis tools measure your content and its success. WordPress, the world’s biggest blogging platform, has its analytics capabilities while thousands of companies, including General Electric and NASA, use Google Analytics to monitor their content and traffic.
Who benefits from content operations?
This is a simple question with a simple answer — everyone. Content operations provide stability and consistency at every level. Upper management personnel, like a CEO, know that the business is operating efficiently, which has a positive reflection on the company as a whole.
Content operations also benefit the members of the team who are directly involved. Team members can use clearly defined responsibilities and processes to work confidently in their roles. It can boost both workplace culture and quality of work.
Lastly, and possibly most importantly, the final group that benefits from content operations are consumers. Content is one of the biggest tools companies use to keep current and potential customers engaged. Blog posts provide valuable information and tips. Emails inform them of current or upcoming sales and promotions. As customers build relationships with businesses, they have expectations. Content operations help meet them.
Why do content operations matter?
Content operations lead to results, and they result in:
- Saving time and money
- Better quality content
- Producing content faster
- Happy and confident teams
Saving Time And Money
When a content operations team establishes a sound cycle between people, processes, and technology, it leads to efficiency. Efficiency saves time and money. Content operations allow companies to save time by reducing the time needed to get content created, approved, and published. Companies save money when their team can produce content according to schedule without additional resources, for example, extra labor or tools.
Better Quality Content
Content operations promote better quality content. Teams uphold standards for accurate, consistent, and impactful content with a structured content cycle process.
Producing Content Faster
While there should always be a focus on quality content, that content needs to get out quickly. Not all content is evergreen. When faced with an immovable deadline, content operations keep teams on schedule.
Happy And Confident Teams
When team members are unhappy or confused about their roles, responsibilities, or resources, their work may reflect it. Not only does content operations promote accountability and structure, but it allows teams to become confident in their position. It breeds a positive and happy workplace environment for all involved.
Content Operations Manager
At the head of content operation sits the content operations manager. While the title can vary from business to business, the job function is the same. The content operations manager oversees the day-to-day operations of the content team to ensure that the necessary people, process, and technology execute the content strategy.
To accomplish their overall goal, content operations managers might also be responsible for:
- Choosing the technology and tools to support operations
- Creating and managing company policies and procedures
- Streamlining content processes
- Recruiting and hiring content staff members
- Training new staff members
In summary, the work of a content operations manager has less to do with actual content and more to do with the people, processes, and technology needed to plan, create, and publish it.
The Three Words Of Content Operations
To understand content operations, remember these three words — people, process, and technology. As long as the right people are in place, with knowledge of the processes and access to the technology, the content operations of a company should run smoothly and successfully.