
Welcome to My Blog
How to Use VLOOKUP Function in Microsoft Excel [+ Video Tutorial]
Coordinating a massive amount of data in Microsoft Excel is a time-consuming headache. That headache can be made even worse when you need to compare data across multiple spreadsheets. The last thing you want to do is manually transfer cells using copy and paste. Thankfully, you don’t have to. The VLOOKUP function can help you automate this task and save you tons of time.
I know, “VLOOKUP function” sounds like the geekiest, most complicated thing ever. But by the time you finish reading this article, you’ll wonder how you ever survived in Excel without it.
Microsoft Excel’s VLOOKUP function is easier to use than you think. What’s more, it is incredibly powerful, and is definitely something you want to have in your arsenal of analytical weapons.![Download 9 Excel Templates for Marketers [Free Kit]](https://no-cache.hubspot.com/cta/default/53/9ff7a4fe-5293-496c-acca-566bc6e73f42.png) What does VLOOKUP do, exactly? Here’s the simple explanation: The VLOOKUP function searches for a specific value in your data, and once it identifies that value, it can find — and display — some other piece of information that’s associated with that value.
What does VLOOKUP do, exactly? Here’s the simple explanation: The VLOOKUP function searches for a specific value in your data, and once it identifies that value, it can find — and display — some other piece of information that’s associated with that value.
How does VLOOKUP work?
VLOOKUP stands for “vertical lookup.” In Excel, this means the act of looking up data vertically across a spreadsheet, using the spreadsheet’s columns — and a unique identifier within those columns — as the basis of your search. When you look up your data, it must be listed vertically wherever that data is located.
The formula always searches to the right.
When conducting a VLOOKUP in Excel, you’re essentially looking for new data in a different spreadsheet that is associated with old data in your current one. When VLOOKUP runs this search, it always looks for the new data to the right of your current data.
For instance, if one spreadsheet has a vertical list of names, and another spreadsheet has an unorganized list of those names and their email addresses, you can use VLOOKUP to retrieve those email addresses in the order you have them in your first spreadsheet. Those email addresses must be listed in the column to the right of the names in the second spreadsheet, or Excel won’t be able to find them. (Go figure … )
The formula needs a unique identifier to retrieve data.
The secret to how VLOOKUP works? Unique identifiers.
A unique identifier is a piece of information that both of your data sources share, and — as its name implies — it is unique (i.e. the identifier is only associated with one record in your database). Unique identifiers include product codes, stock-keeping units (SKUs), and customer contacts.
Alright, enough explanation: let’s see another example of the VLOOKUP in action!
VLOOKUP Example
In the video below, we’ll show an example in action, using the VLOOKUP function to match email addresses (from a second data source) to their corresponding data in a separate sheet.
Author’s note: There are many different versions of Excel, so what you see in the video above might not always match up exactly with what you’ll see in your version. That’s why we encourage you to follow along with the written instructions below.
For your reference, here’s what a VLOOKUP function looks like:
VLOOKUP(lookup_value , table_array , col_index_num , range_lookup)
In the steps below, we’ll assign the right value to each of these components, using customer names as our unique identifier to find the MRR of each customer.
1. Identify a column of cells you’d like to fill with new data.
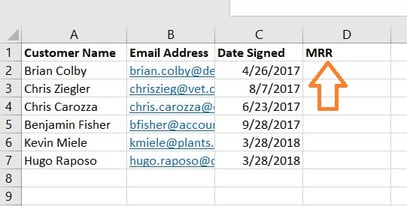
Remember, you’re looking to retrieve data from another sheet and deposit it into this one. With that in mind, label a column next to the cells you want more information on with a proper title in the top cell, such as “MRR,” for monthly recurring revenue. This new column is where the data you’re fetching will go.
2. Select ‘Function’ (Fx) > VLOOKUP and insert this formula into your highlighted cell.
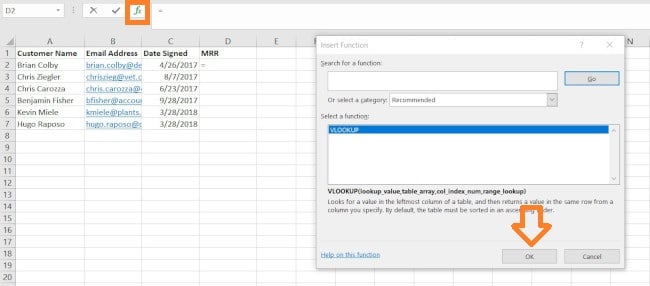
To the left of the text bar above your spreadsheet, you’ll see a small function icon that looks like a script: Fx. Click on the first empty cell beneath your column title and then click this function icon. A box titled Formula Builder or Insert Function will appear to the right of your screen (depending on which version of Excel you have).
Search for and select “VLOOKUP” from the list of options included in the Formula Builder. Then, select OK or Insert Function to start building your VLOOKUP. The cell you currently have highlighted in your spreadsheet should now look like this: “=VLOOKUP()“
You can also enter this formula into a call manually by entering the bold text above exactly into your desired cell.
With the =VLOOKUP text entered into your first cell, it’s time to fill the formula with four different criteria. These criteria will help Excel narrow down exactly where the data you want is located and what to look for.
3. Enter the lookup value for which you want to retrieve new data.
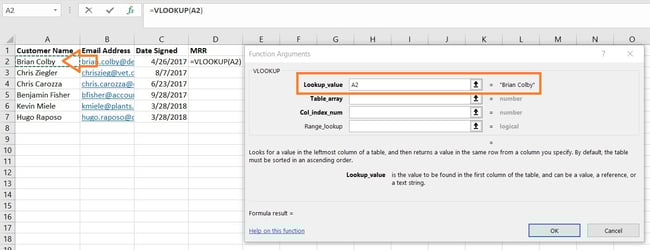
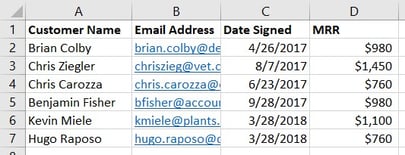
The first criteria is your lookup value — this is the value of your spreadsheet that has data associated with it, which you want Excel to find and return for you. To enter it, click on the cell that carries a value you’re trying to find a match for. In our example, shown above, it’s in cell A2. You’ll start migrating your new data into D2, since this cell represents the MRR of the customer name listed in A2.
Keep in mind your lookup value can be anything: text, numbers, website links, you name it. As long as the value you’re looking up matches the value in the referring spreadsheet — which we’ll talk about that in the next step — this function will return the data you want.
4. Enter the table array of the spreadsheet where your desired data is located.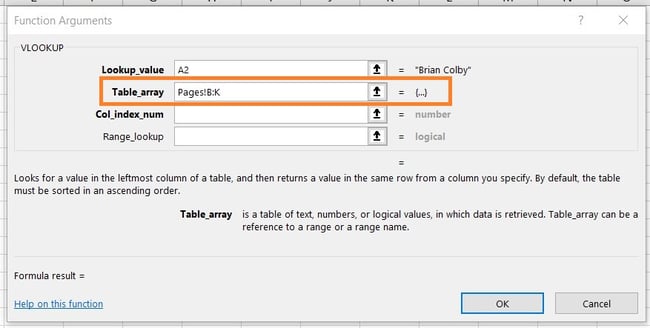
Next to the “table array” field, enter the range of cells you’d like to search and the sheet where these cells are located, using the format shown in the screenshot above. The entry above means the data we’re looking for is in a spreadsheet titled “Pages” and can be found anywhere between column B and column K.
The sheet where your data is located must be within your current Excel file. This means your data can either be in a different table of cells somewhere in your current spreadsheet, or in a different spreadsheet linked at the bottom of your workbook, as shown below.

For example, if your data is located in “Sheet2” between cells C7 and L18, your table array entry will be “Sheet2!C7:L18.”
5. Enter the column number of the data you want Excel to return.
Beneath the table array field, you’ll enter the “column index number” of the table array you’re searching through. For example, if you’re focusing on columns B through K (notated “B:K” when entered in the “table array” field), but the specific values you want are in column K, you’ll enter “10” in the “column index number” field, since column K is the 10th column from the left.
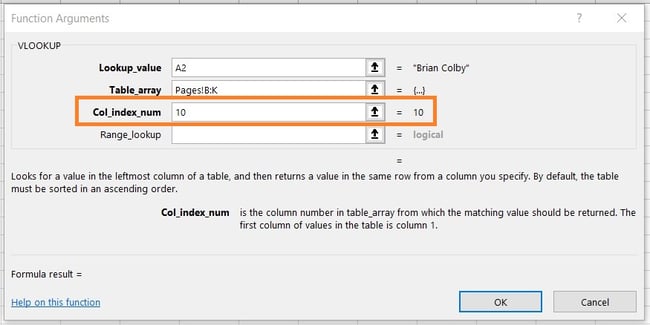
6. Enter your range lookup to find an exact or approximate match of your lookup value.
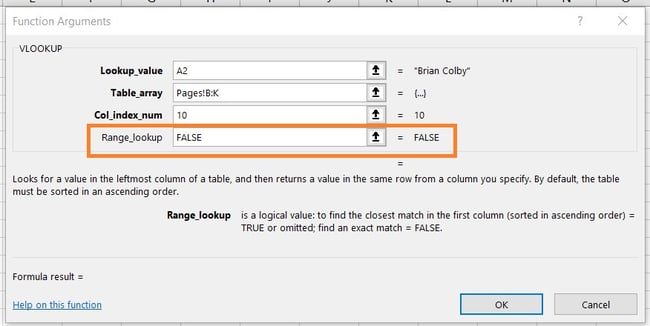
In situations like ours, which concerns monthly revenue, you want to find exact matches from the table you’re searching through. To do this, enter “FALSE” in the “range lookup” field. This tells Excel you want to find only the exact revenue associated with each sales contact.
To answer your burning question: Yes, you can allow Excel to look for an approximate match instead of an exact match. To do so, simply enter TRUE instead of FALSE in the fourth field shown above.
When VLOOKUP is set for an approximate match, it’s looking for data that most closely resembles your lookup value, rather than data that is identical to that value. If you’re looking up data associated with a list of website links, for example, and some of your links have “https://” at the beginning, it might behoove you to find an approximate match just in case there are links that do not have this “https://” tag. This way, the rest of the link can match without this initial text tag causing your VLOOKUP formula to return an error if Excel can’t find it.
7. Click ‘Done’ (or ‘Enter’) and fill your new column.
In order to officially bring in the values you want into your new column from Step 1, click “Done” (or “Enter,” depending on your version of Excel) after filling the “range lookup” field. This will populate your first cell. You might take this opportunity to look in the other spreadsheet to make sure this was the correct value.
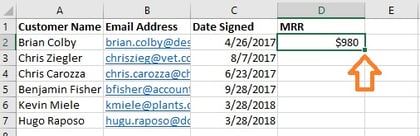
If so, populate the rest of the new column with each subsequent value by clicking the first filled cell, then clicking the tiny square that appears on the bottom-right corner of this cell. Done! All your values should appear.
VLOOKUP Not Working?
If you’ve followed the above steps and your VLOOKUP is still not working, it will either be an issue with your:
- Syntax (i.e. how you’ve structured the formula)
- Values (i.e. whether the data it’s looking up is good and formatted correctly)
Troubleshooting VLOOKUP Syntax
Start with looking at the VLOOKUP formula that you have written in the designated cell.
- Is it referring to the right lookup value for its key identifier?
- Does it specify the correct table array range for the values it needs to retrieve
- Does it specify the correct sheet for the range?
- Is that sheet spelled correctly?
- Is it using the correct syntax to refer to the sheet? (e.g. Pages!B:K or ‘Sheet 1’!B:K)
- Has the correct column number been specified? (e.g. A is 1, B is 2, and so on)
- Is True or False the correct route for how your sheet is set up?
Troubleshooting VLOOKUP Values
If the syntax is not the problem, how you may have an issue with the values you’re trying to receive themselves. This often manifests as an #N/A error where the VLOOKUP cannot find a referenced value.
- Are the values formatted vertically and from right to left?
- Do the values match how you refer to them?
For example, if you’re looking up URL data, each URL must be a row with its corresponding data to the left of it in the same row. If you have the URLs as column headers with the data moving vertically, the VLOOKUP will not work.
Keeping with this example, the URLs must match in format in both sheets. If you have one sheet including the “https://” in the value while the other sheet omits the “https://”, the VLOOKUP will not be able to match the values.
VLOOKUPs as a Powerful Marketing Tool
Marketers have to analyze data from a variety of sources to get a complete picture of lead generation (and more). Microsoft Excel is the perfect tool to do this accurately and at scale, especially with the VLOOKUP function.
Editor’s note: This post was originally published in March 2019 and has been updated for comprehensiveness.

How to Make a Chart or Graph in Excel [With Video Tutorial]
Building charts and graphs is one of the best ways to visualize data in a clear, easy-to-understand way. (Check out this guide for making better charts to learn more.)However, it’s no surprise that some people get a little intimidated by the prospect of poking around in Microsoft Excel. (I admittedly adore Excel, but I work in Marketing Operations, so it’s pretty much a requirement that I like the tool).
![Download Now: An Introduction to Data Visualization for Marketers [Free Guide]](https://no-cache.hubspot.com/cta/default/53/3f67f43c-13ec-489b-a020-fc86ead9b175.png) I thought I’d share a helpful video tutorial as well as some step-by-step instructions for anyone out there who cringes at the thought of organizing a spreadsheet full of data into a chart that actually, you know, means something.
I thought I’d share a helpful video tutorial as well as some step-by-step instructions for anyone out there who cringes at the thought of organizing a spreadsheet full of data into a chart that actually, you know, means something.
Here are the simple steps you need to build a chart or graph in Excel.
Keep in mind there are many different versions of Excel, so what you see in the video above might not always match up exactly with what you’ll see in your version. In the video, I used Excel 2021 version 16.49 for Max OS X.
To get the most updated instructions, I encourage you to follow the written instructions below (or download them as PDFs). Most of the buttons and functions you’ll see and read are very similar across all versions of Excel.
Download Demo Data | Download Instructions (Mac) | Download Instructions (PC)
1. Enter your data into Excel.
First, you need to input your data into Excel. You might have exported the data from elsewhere, like a piece of marketing software or a survey tool. Or maybe you’re inputting it manually.
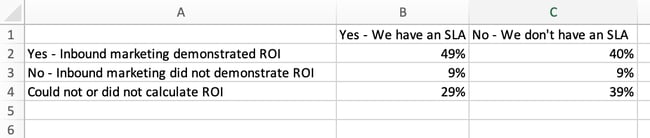
In the example below, in Column A, I have a list of responses to the question, “Did inbound marketing demonstrate ROI?”, and in Columns B, C, and D, I have the responses to the question, “Does your company have a formal sales-marketing agreement?” For example, Column C, Row 2 illustrates that 49% of people who have an SLA (service level agreement) also say that inbound marketing demonstrated ROI.
2. Choose from the graph and chart options.
In Excel, your options for charts and graphs include column (or bar) graphs, line graphs, pie graphs, scatter plots, and more. See how Excel identifies each one in the top navigation bar, as depicted below:

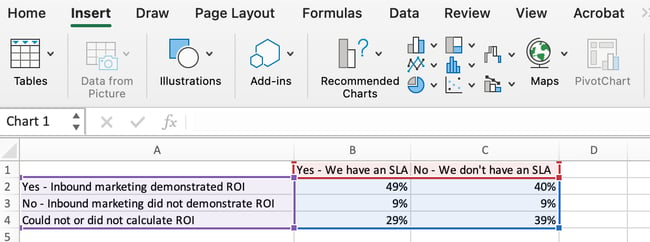
To find the chart and graph options, select Insert.
(For help figuring out which type of chart/graph is best for visualizing your data, check out our free ebook, How to Use Data Visualization to Win Over Your Audience.)
3. Highlight your data and insert your desired graph into the spreadsheet.
In this example, I’ll use a bar graph to visually present the data. To make a bar graph, highlight the data and include the titles of the X and Y-axis. Then, go to the Insert tab, and in the charts section, click the column icon. Choose the graph you wish from the dropdown window that appears.
In this example, I picked the first 2-dimensional column option — just because I prefer the flat bar graphic over the 3-D look. See the resulting bar graph below.

4. Switch the data on each axis, if necessary.
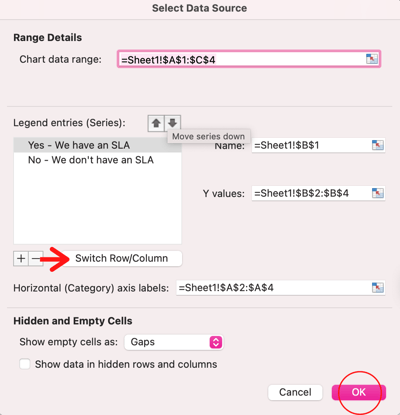
If you want to switch what appears on the X and Y axis, right-click on the bar graph, click Select Data, and click Switch Row/Column. This will rearrange which axes carry which pieces of data in the list shown below. When you’re finished, click OK at the bottom.
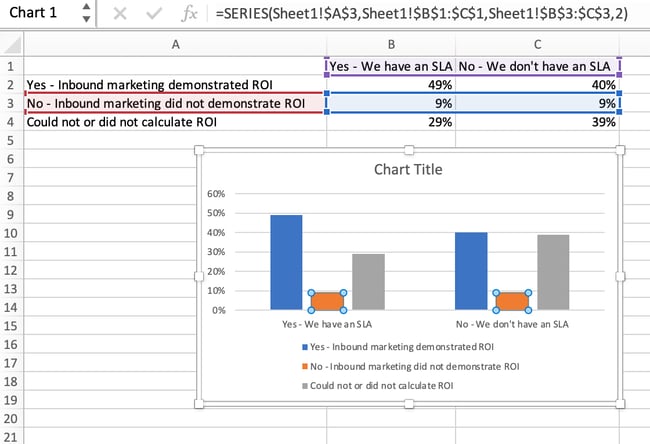
The resulting graph would look like this:
5. Adjust your data’s layout and colors.
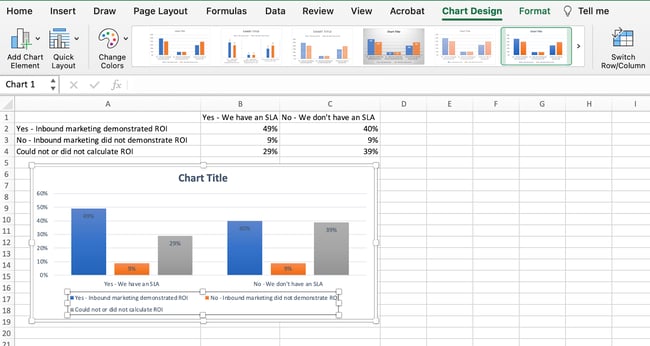
To change the layout of the labeling and legend, click on the bar graph, then click the Chart Design tab. Here, you can choose which layout you prefer for the chart title, axis titles, and legend. In my example shown below, I clicked on the option that displayed softer bar colors and legends below the chart.
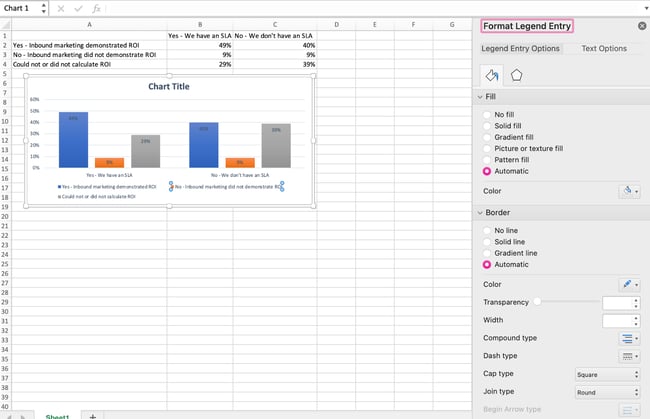
To further format the legend, click on it to reveal the Format Legend Entry sidebar, as shown below. Here, you can change the fill color of the legend, which will in turn change the color of the columns themselves. To format other parts of your chart, click on them individually to reveal a corresponding Format window.
6. Change the size of your chart’s legend and axis labels.
When you first make a graph in Excel, the size of your axis and legend labels might be a bit small, depending on the type of graph or chart you choose (bar, pie, line, etc.) Once you’ve created your chart, you’ll want to beef up those labels so they’re legible.
To increase the size of your graph’s labels, click on them individually and, instead of revealing a new Format window, click back into the Home tab in the top navigation bar of Excel. Then, use the font type and size dropdown fields to expand or shrink your chart’s legend and axis labels to your liking.
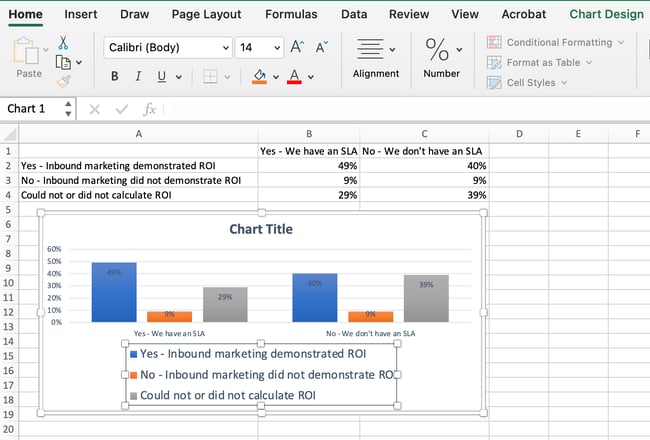
7. Change the Y-axis measurement options, if desired.
To change the type of measurement shown on the Y axis, click on the Y-axis percentages in your chart to reveal the Format Axis window. Here, you can decide if you want to display units located on the Axis Options tab, or if you want to change whether the Y-axis shows percentages to 2 decimal places or to 0 decimal places.
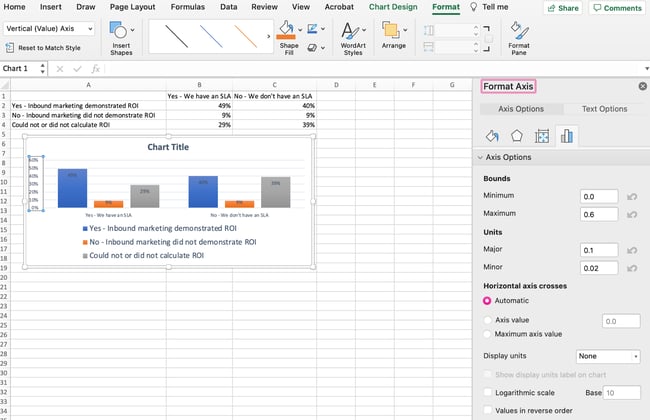
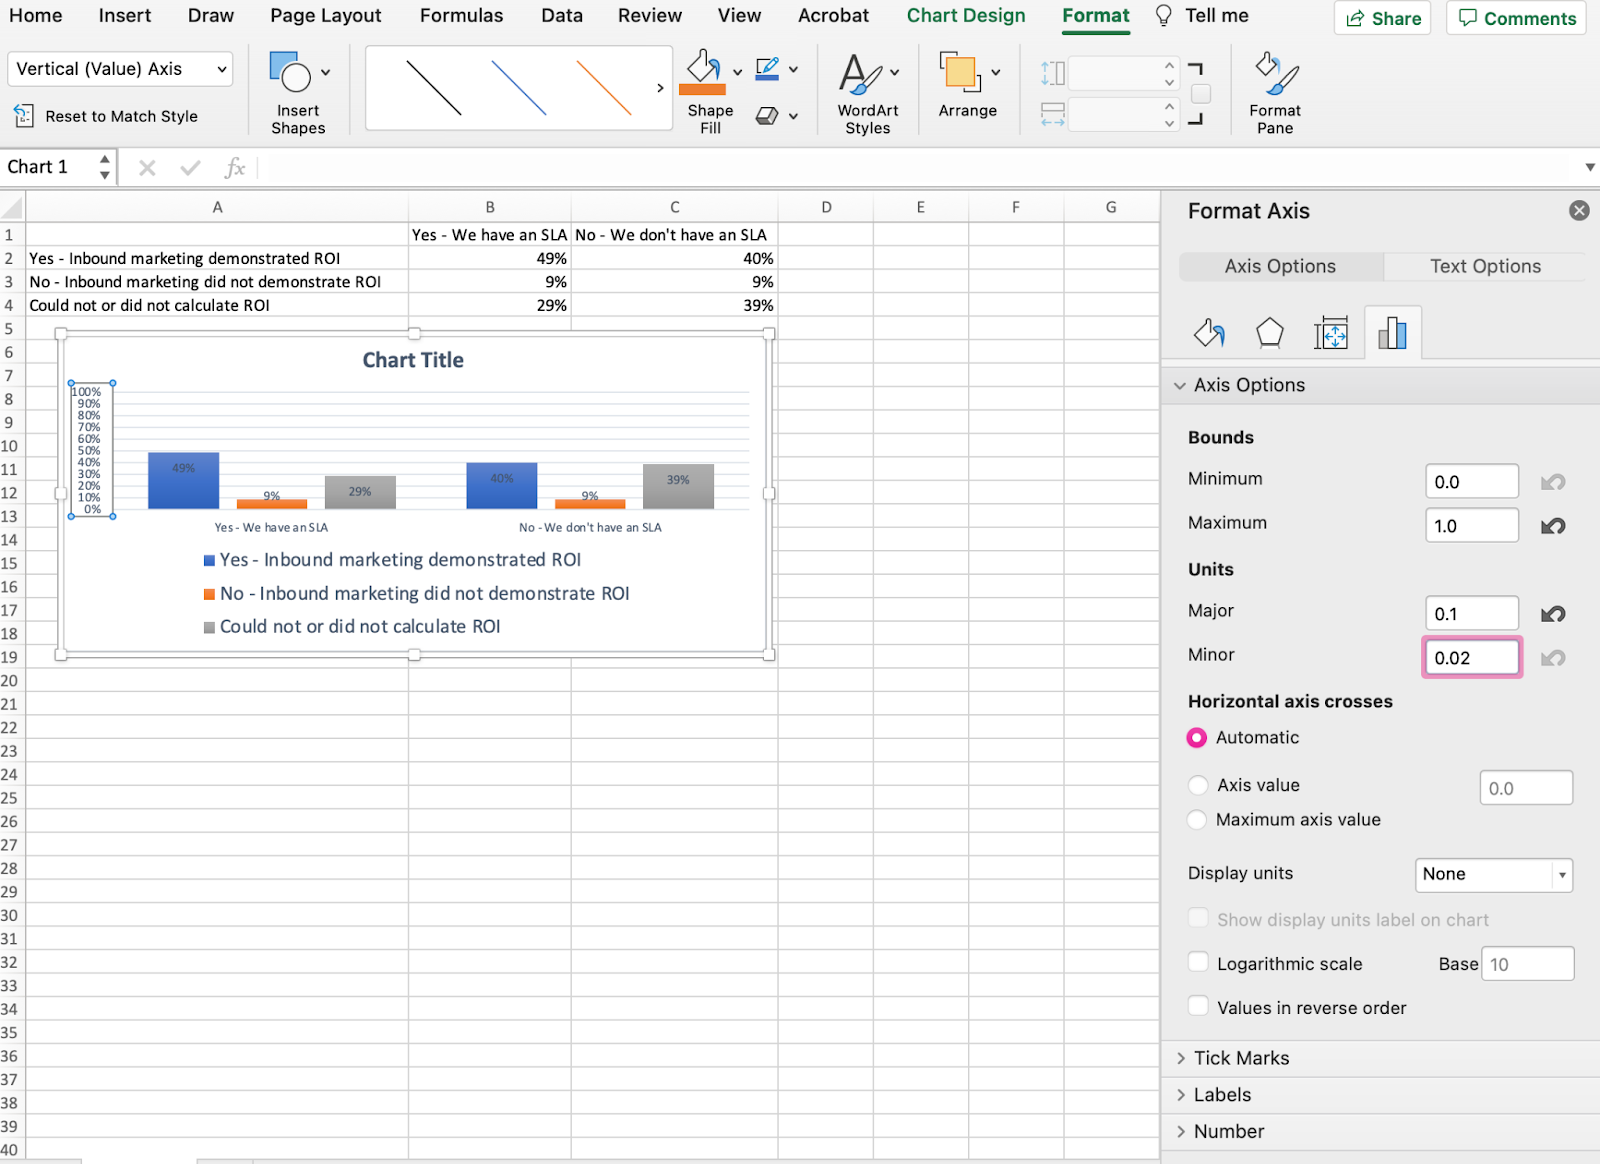
Because my graph automatically sets the Y axis’s maximum percentage to 60%, I might want to change it manually to 100% to represent my data on a more universal scale. To do so, I can select the Maximum option — two fields down under Bounds in the Format Axis window — and change the value from 0.6 to 1.
The resulting graph would be changed to look like the one below (I increased the font size of the Y-axis via the Home tab, so you can see the difference):
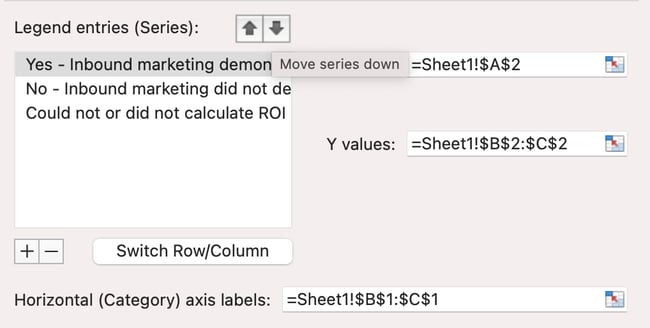
8. Reorder your data, if desired.
To sort the data so the respondents’ answers appear in reverse order, right-click on your graph and click Select Data to reveal the same options window you called up in Step 3 above. This time, click the up and down arrows, as shown below, to reverse the order of your data on the chart.
If you have more than two lines of data to adjust, you can also rearrange them in ascending or descending order. To do this, highlight all of your data in the cells above your chart, click Data and select Sort, as shown below. You can choose to sort based on smallest to largest or largest to smallest, depending on your preference.
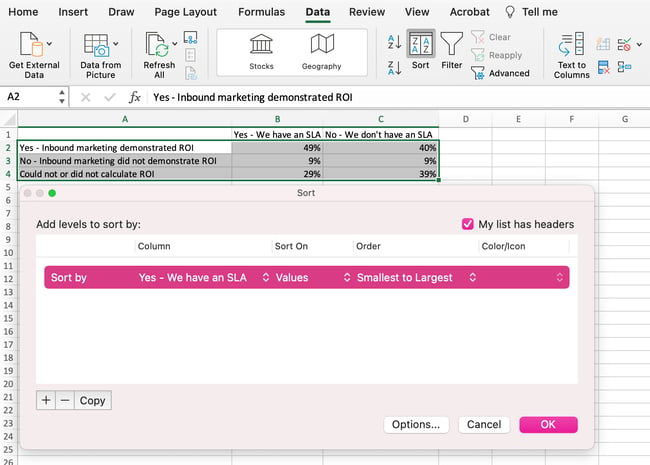
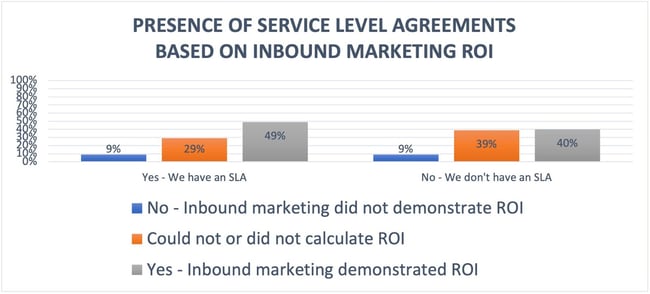
The resulting graph would look like this:
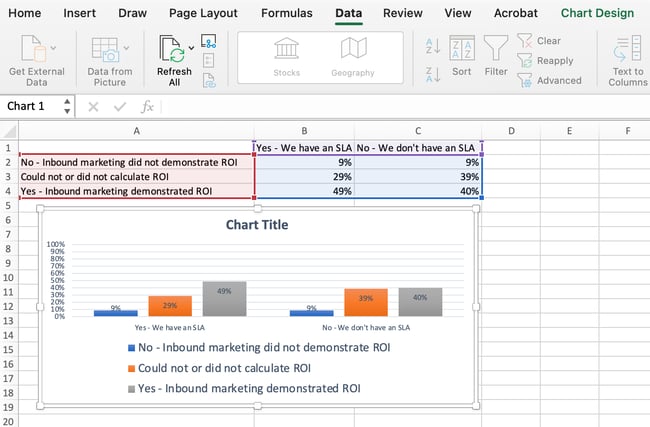
9. Title your graph.
Now comes the fun and easy part: naming your graph. By now, you might have already figured out how to do this. Here’s a simple clarifier.
Right after making your chart, the title that appears will likely be “Chart Title,” or something similar depending on the version of Excel you’re using. To change this label, click on “Chart Title” to reveal a typing cursor. You can then freely customize your chart’s title.
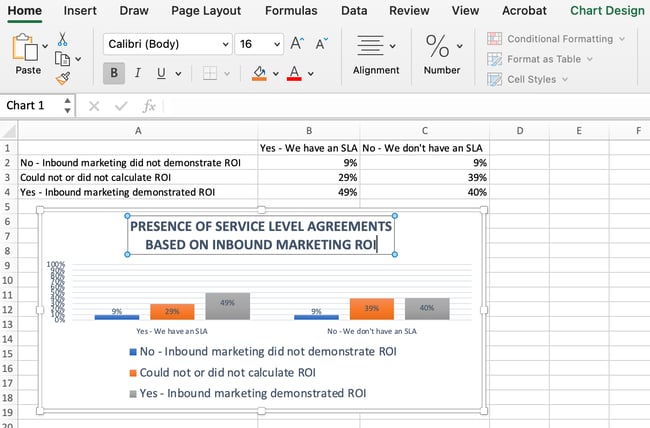
When you have a title you like, click Home on the top navigation bar, and use the font formatting options to give your title the emphasis it deserves. See these options and my final graph below:
10. Export your graph or chart.
Once your chart or graph is exactly the way you want it, you can save it as an image without screenshotting it in the spreadsheet. This method will give you a clean image of your chart that can be inserted into a PowerPoint presentation, Canva document, or any other visual template.
To save your excel graph as a photo, right-click on the graph and select Save as Picture….
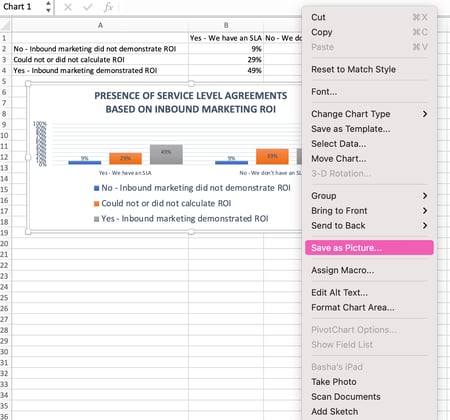
In the dialogue box, name the photo of your graph, choose where to save it to on your computer, and choose the file type you’d like to save it as. In this example, I’m saving it as a JPEG to my desktop folder. Finally, click Save. 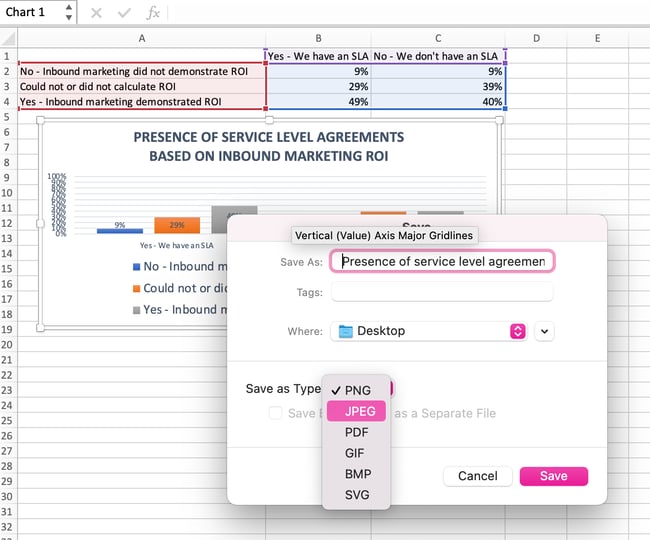
You’ll have a clear photo of your graph or chart that you can add to any visual design.
Visualize Data Like A Pro
That was pretty easy, right? With this step-by-step tutorial, you’ll be able to quickly create charts and graphs that visualize the most complicated data. Try using this same tutorial with different graph types like a pie chart or line graph to see what format tells the story of your data best. You can even practice customizing more data-heavy graphs and charts using the free excel templates for marketers below.
Editor’s note: This post was originally published in June 2018 and has been updated for comprehensiveness.

The What, Why, and How of Canonical Tags & URLs
“That’s canon!”
You might’ve heard this phrase used to describe a creative piece that stays true to an original piece of work or fictional universe.
If you’re familiar with canon, you are well on your way to understanding canonicalization and how it impacts web pages.
Here, let’s explore what canonicalization is, why it matters for SEO, and how to add the tag to your own website.
![→ Download Now: SEO Starter Pack [Free Kit]](https://no-cache.hubspot.com/cta/default/53/1d7211ac-7b1b-4405-b940-54b8acedb26e.png)
What is canonicalization?
Canonicalization declares an original or preferred web page, which helps consolidate duplicate pages for crawling.
Without naming a canonical URL, web crawlers could crawl and index multiple versions of your web page. Google indicates that it will crawl non-canonical pages less frequently to reduce the crawl load on your website.
Less frequent crawling of low-quality, duplicate pages means more important pages can be prioritized for crawling, instead.
Okay, but why would we purposely have duplicate content? Well … ever post your content on your website and also on Medium? Or, perhaps after guest posting you place a version of the blog post on your website, as well.
To do so, you should reference the original version as the canonical URL. Canonical URLs can reference different domains — meaning the canonical can be on another website.
Even if you aren’t actively creating duplicate pages for cross-channel promotion, duplication happens naturally due to the different parts of a web address. Does your website use a secure protocol, like HTTPS? Then you may have an HTTP and HTTPS version of your webpage.
The same goes with www vs. non-www. Does your website use trailing slashes, or not? If your website doesn’t always redirect to the preferred version of your page (secure or not, www or not, and trailing slash or not), duplication can occur.
Even if you are forcing the preferred version through a redirect, query parameters used for tracking visits or filtering views on a page can also look like separate URLs to crawlers. Declaring a canonical URL indicates to web crawlers to ignore query parameters or other versions of the URL.
What is a canonical URL?
The external resource <link> element defines relationships between the current page and other resources. A “rel” attribute is used on the <link> tag to indicate the type of relationship. Some common link types include “prev” and “next” for pagination, “stylesheet,” and, of course, “canonical.”
The <link> tag uses the “rel=” noopener” target=”_blank” href” attribute to set the URL that serves as the canonical to the active page. Although these are intended to be external resource links, the canonical URL can be “self-referring,” meaning it is the exact version of the current page. Using self-referring canonicals helps to reduce the unnecessary crawling of non-preferred versions of your page, as long as you are always using the absolute URL as the “rel=” noopener” target=”_blank” href” value.
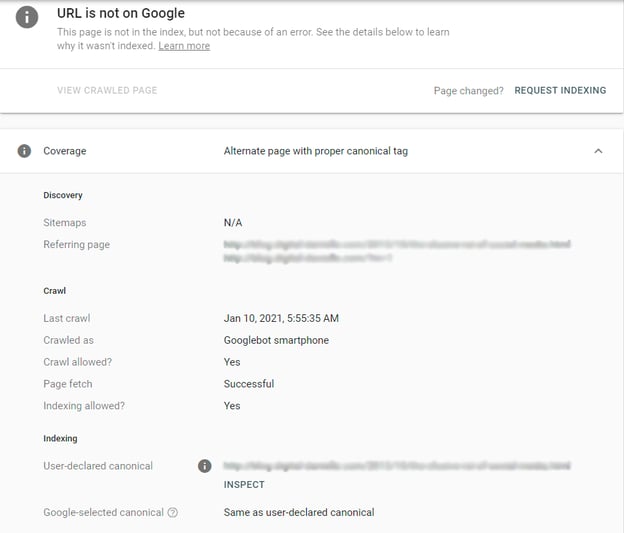
In Google Search Console, you can use the Inspect URL tool to understand what Google considers the canonical URL, even if you have not set one. Even when you have declared a canonical URL, Google will sometimes still pick a different URL, listed as the “Google-selected canonical.” Because of that, canonicalization is not a guarantee that Google will select your preferred version or that other versions will not be indexed.
How to Add a Canonical Tag
Add a Canonical Tag in an HTML Document
As mentioned, you can use the <link > element to set your canonical URL. Link elements are self-closing tags. The “rel” and “rel=” noopener” target=”_blank” href” attributes are required.
To add a canonical link to an HTML document add the <link> element within the <head> element. Ensure the “rel” attribute value is set to “canonical.” Remember to put the absolute URL of your preferred web address as the value of the “rel=” noopener” target=”_blank” href” attribute.
<head>
<link rel=”canonical” rel=” noopener” target=”_blank” href=”https://www.mypreferredwebaddress.com/canonical-url“>
</head>
Add a Canonical Tag in HubSpot
In HubSpot, you can set your canonical URL in the individual page or post settings under Advanced Options. Read more about canonical URL settings options.
Add a Canonical Tag in WordPress
Common WordPress SEO plugins, including Yoast and RankMath, simplifies setting up canonical URLs, especially for several pages. If you are a little more advanced and don’t want to add another plugin, it is possible to update the canonical URL using WordPress Hooks too.
1. Using the get_canonical_url Hook.
A filter WordPress hook allows you to modify data as WordPress is executing. The add_filter() function accepts at least two parameters, a tag and a callback function. The tag would be the hook, which in this case is get_canonical_url.
The callback function parameter would be the name of a function you create that returns the canonical URL. The callback function could use conditional statements to match to specific posts. Refer to this Stack Exchange answer example.
In the example, the “wpse_302620_canonical_url” callback function uses an if statement to return a new canonical when the post ID, which is passed as an argument on the function, matches a specific post. With that in mind, this solution seems like a fix for a few posts or post types but may not scale well. To apply to several pages, using a plugin would probably be the best option.
2. Using the Yoast Plugin.
If you are using Yoast, you can apply canonical URLs to posts, pages, and taxonomies. Select the type of content you want to edit from the left-hand menu, then “edit” the individual piece of content. In the Yoast SEO meta box, toggle the “Advanced” section. Add your preferred web address in the “Canonical URL” field and save. Learn more about Yoast’s canonical URL settings.
3. Using the Rank Math Plugin.
While editing your specific page or post, select the “Advanced” tab on Rank Math. Add your preferred web address in the “Canonical URL” field and save. Learn more about setting canonical URLs in Rank Math.


Professional Invoice Design: 26 Samples & Templates to Inspire You
Invoices and infographics may seem like two entirely different business materials, but they actually have one key thing in common: they both exist to convey information.
However, while infographics are known for employing colorful designs and data visualizations, invoices are typically pretty straightforward.
While your invoices might not be a front-facing part of your business, it doesn’t mean they should be plain and boring. Of course, conveying important payment information in a clear and concise way is the name of the game — but that doesn’t mean you can’t add a little brand personality to them.

To help you get a sense of the possibilities, we put together a collection of impressive invoice samples that may inspire you to rethink your current design.
But first, let’s review how to design an invoice in the section below.
How to Design an Invoice
You don’t need to be an expert to create professionally designed invoices. In fact, you can use customized templates to get started (more on that later).
However, you need to know a bit about an invoice’s structure if you want to create and send invoices that ensure you receive your payments on time.
Here are some best practices for creating professional invoices:
Decide on your invoice format.
Start by choosing the format you want to use for your invoice.
Do you want it in print? Or in digital formats like a PDF, Google Docs, Word, or Excel? Once you’re sure of the format, move on to create room for essential details on the invoice.
Add essential information.
Every invoice you create should include the following information:
Your details: This includes your name, company name, address, telephone number, and email address.
Client details: Add your client’s address, company name, telephone number, and email address. You might need to add the department and the contact person’s name if you’re working with a large organization.
List of services: Make a list of all the services you’re charging the client for. Your list should be as specific as possible to eliminate any confusion in the client’s mind.
Payment terms and methods: How would you like your clients to pay you? Bank transfer? PayPal? Check? Make it clear in your invoice. You should also make the payment’s due date clear and include what will happen when payments exceed said date.
Add your company’s branding.
You’d be missing out on an ideal branding opportunity if you create generic invoices. So instead, add a bit of razzle-dazzle to your invoice that carries your brand colors, logo, and fonts.
You can also distinguish your invoices by giving them a monochrome look.
Invoice Design Templates and Examples
We’ve put together a collection of impressive invoice designs and templates that may inspire you to rethink your current design. Many of them are free to download and customize.
1. Basic Invoice
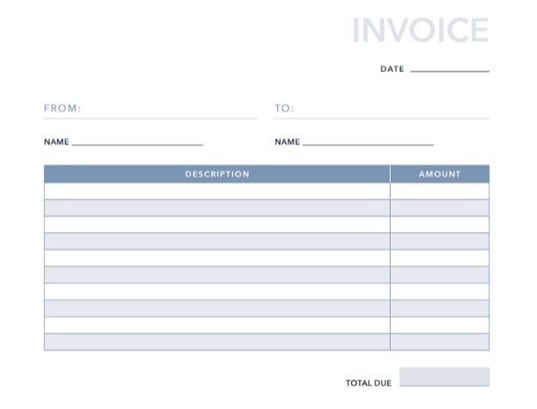
No frills, just business. This basic invoice template, developed here at HubSpot, gives you all the necessities of paper billing without the written fields that more complex business services might want distinguished.
The template above offers space for your name, your client’s name, invoice date, and a base of 10 itemized services. You can add more as needed.
2. Blank Invoice
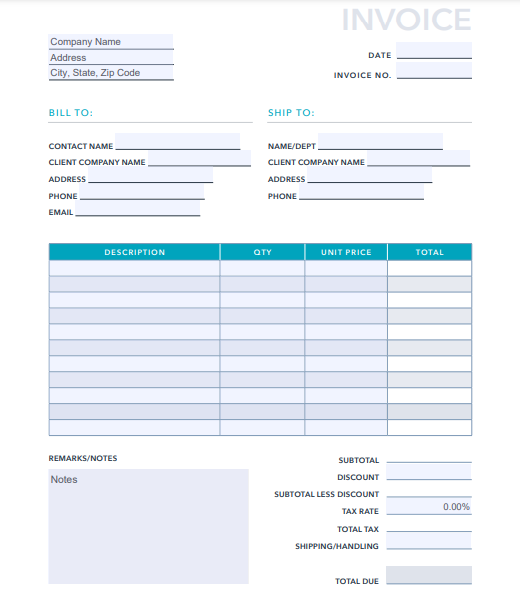
Like the basic invoice template, the blank invoice design contains all the necessary fields you need in an invoice.
However, this blank invoice template allows you to go into specifics concerning your client’s contact details. You also get to include a detailed breakdown of the cost, including tax and shipping fees.
3. Commercial Invoice
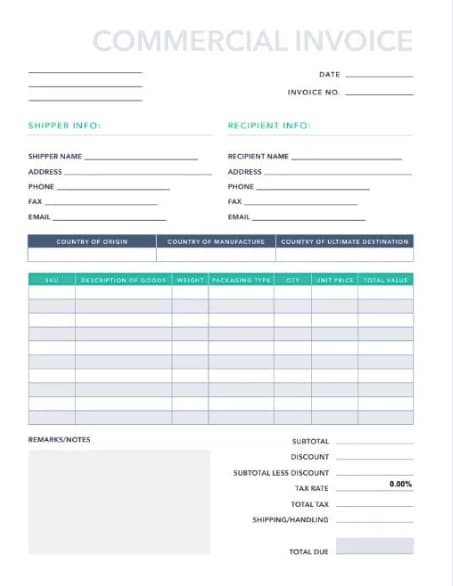
Are you selling a variety of products and services? The commercial invoice above might be just what you need. Developed here at HubSpot, this template allows space for product origin, manufacturing origin, discounts offered to your client, and more.
4. Blue Service Invoice
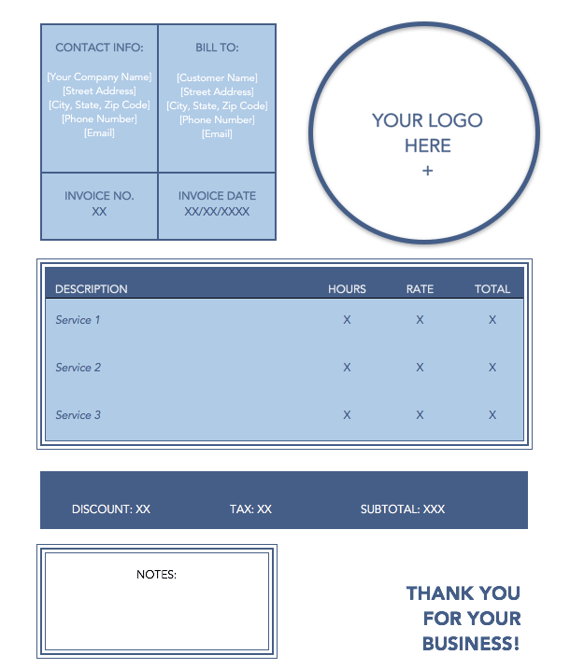
This soft-colored, service-based invoice template allows you to include multiple jobs and how much each cost your client.
Download this template together with a pack of 10 free templates using the link in the header above the image — each design conveniently opens in Microsoft Word.
5. Green Shipping Invoice
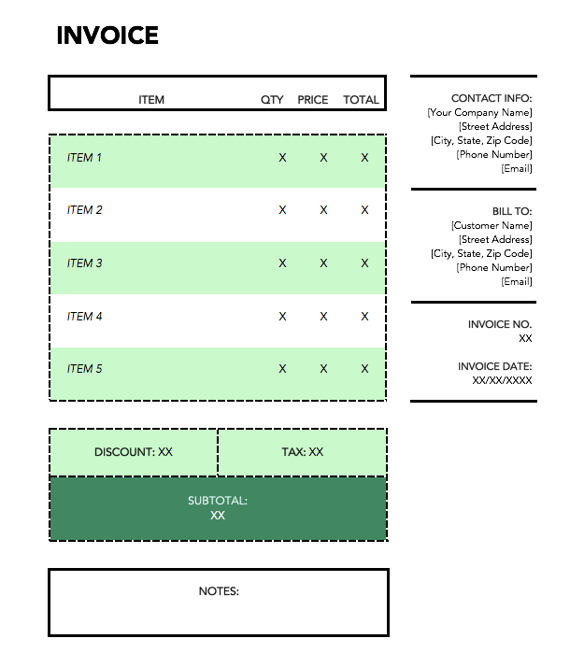
This green template can be downloaded using the link in the header above the image. Dedicated to shipping-based services, the vibrant document is perfect for transactions that involved the transportation of goods.
6. Orange Standard
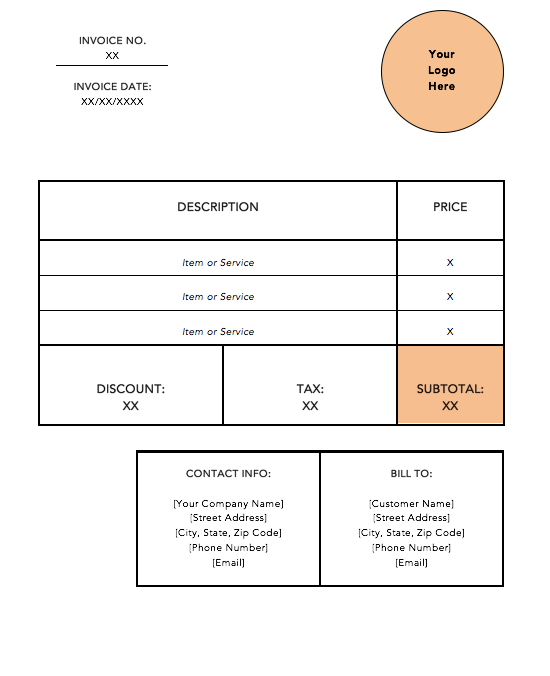
It doesn’t get much more basic than the orange standard invoice template, shown above. Download this template for free using the link in the header above the image. It opens in Microsoft word, allowing you to insert your logo in the top-righthand corner and add additional service rows to match how many services you provided your customer.
7. Blue Minimal Standard
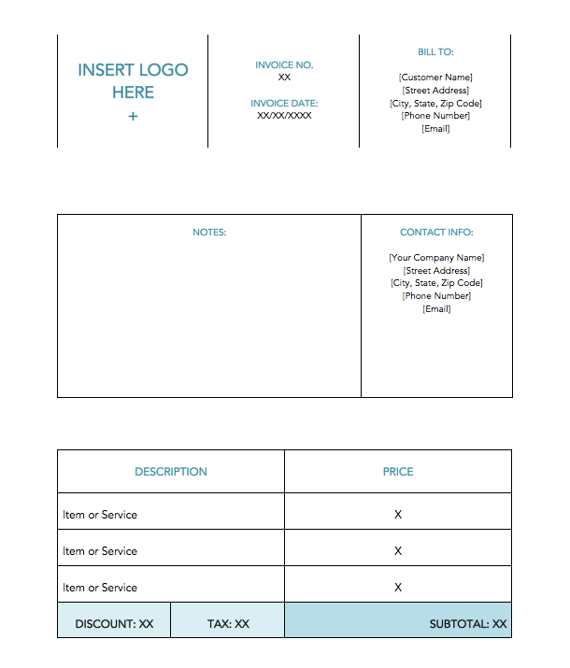
The minimalist invoice template shown above caters to services that are hard to describe in individual lines of services. Using the large “Notes” tile in the center of the document, you can put the focus on the nuances of your business, so it’s clear why you’ve charged your client the price you’ve listed. Download it for free using the link in the header above the image.
8. Black and White Shipping Invoice
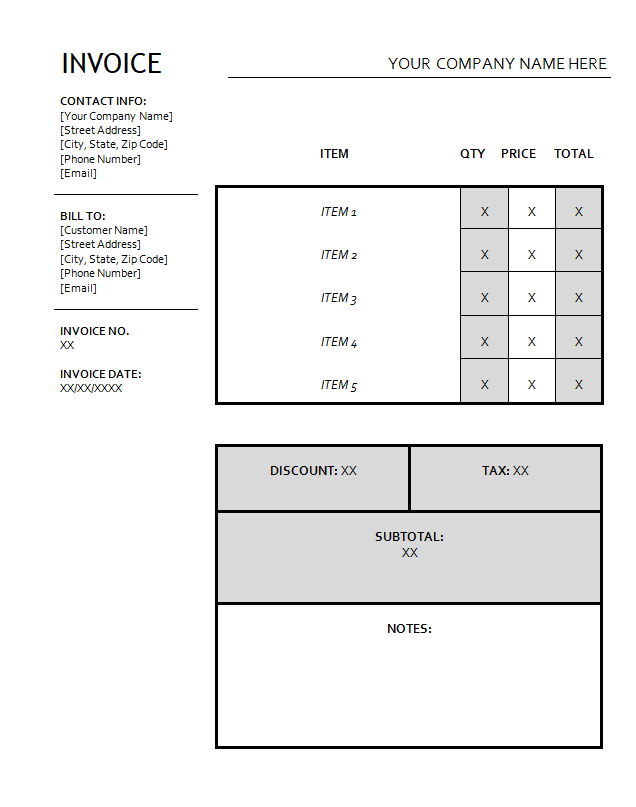
Sometimes, you might just want your invoice to have a monochrome feel to it. And that’s exactly what this black and white design template offers. It’s geared mostly towards shipping invoices, but can be customized for other uses as well. Click on the header above the image to download this template.
9. Amir Hossain
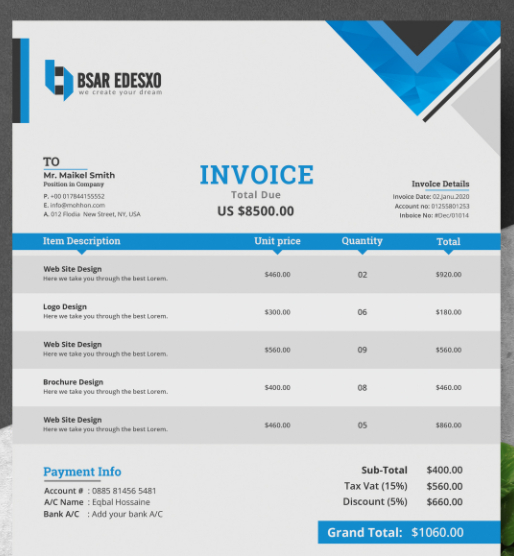
This simple invoice template allows you to add your logo and customize the design to match your brand colors. You also get clearly defined fields where you can enter a list of services you want to receive payment for, alongside your payment info.
You can download this template by clicking on the header above the image.
10. Minimalist Invoice
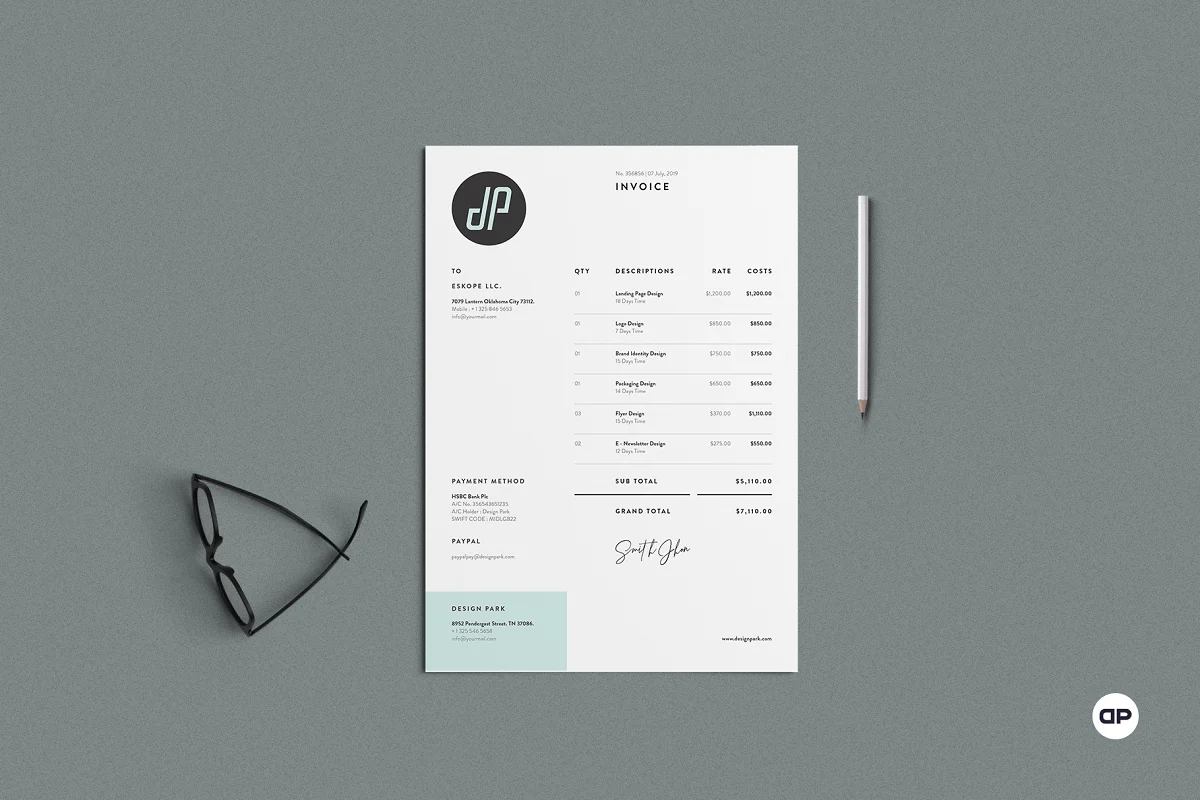
This template takes the basic invoice template up a notch with its minimalistic view. Whether you’re using it for personal or business use, this template helps you save time, and it allows you to assign Customer IDs that help you quickly find who needs to receive the invoice.
11. Fabio Basile
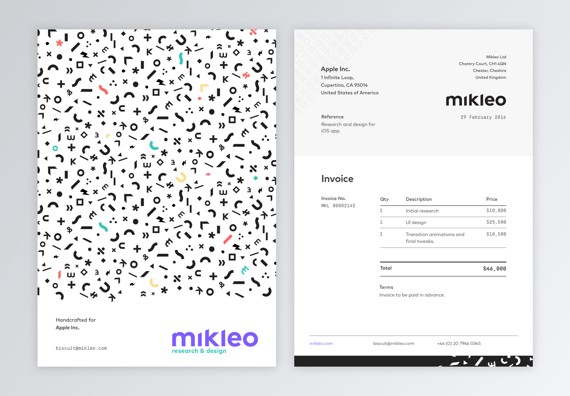
Business in the front. Party in the back.
This double-sided invoice sample offers an interesting twist on an otherwise standard design.
We especially love the “handcrafted for” language on the design side, which side helps to make the customer feel valued by the business they’ve worked with.
6. Front and Center

Put your final price to the client “front and center” using this design by Ari Krzyzek. Contact this designer using the link in the header — her project comes with matching letters and business cards. Or, simply use her concept as inspiration to create an invoice of your own.
The document makes excellent use of contrast in font color, allowing the red price to pop against the thIn black text surrounding it.
13. JPWTemplates
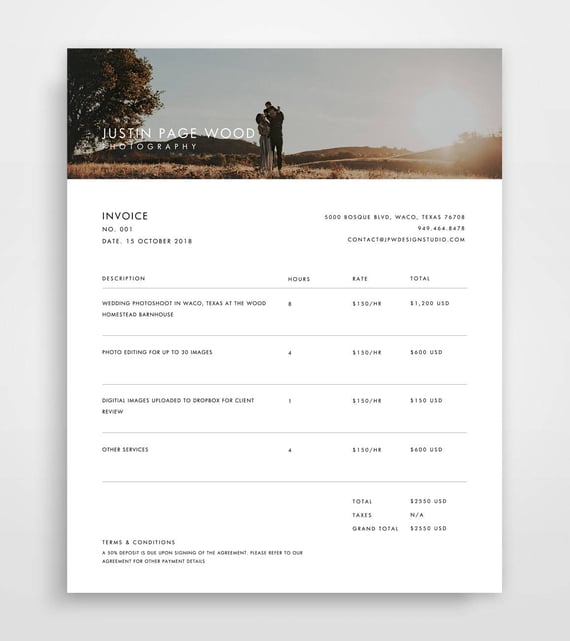
This is a more specific invoice sample focused on billing for services — in this case: photography.
This invoice uses an actual photograph in the header to highlight the quality of its services. This is a clever idea you can leverage for multiple services such as graphic design, illustration, interior design, and so on.
If you want to personalize your invoice further, you can use a photo or design from the customer’s specific project to give it a custom look and feel.
14. Classic Designs
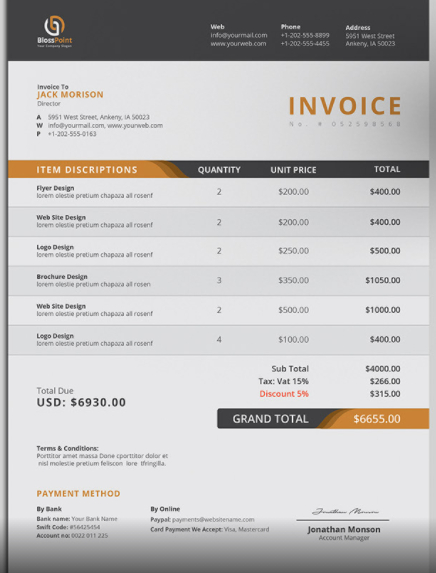
Here’s an example of a straightforward invoice design that details all of the critical invoice criteria — contact information, itemized purchases, payment information, and so on.
The design leverages pops of red to call out key pieces of information to make the statement feel less overwhelming.
15. Bold Stationary
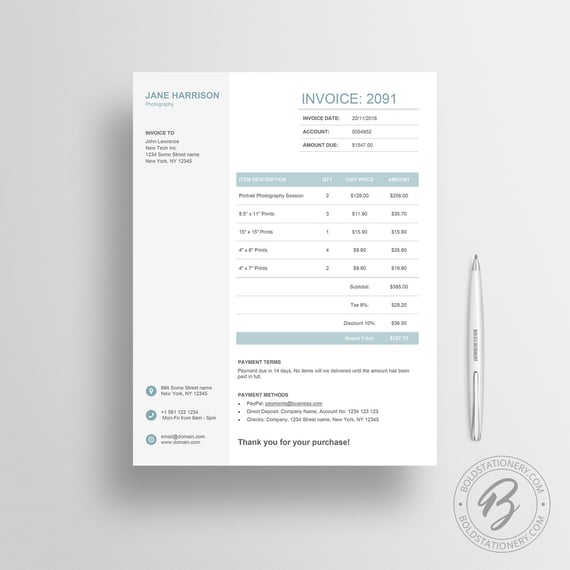
This invoice sample uses a split design to divide contact information and payment information. This approach is free of any distractions or fancy elements, yet it still feels carefully designed.
If your business is a bit more traditional, this sample serves as a great guide.
16. Novomatic
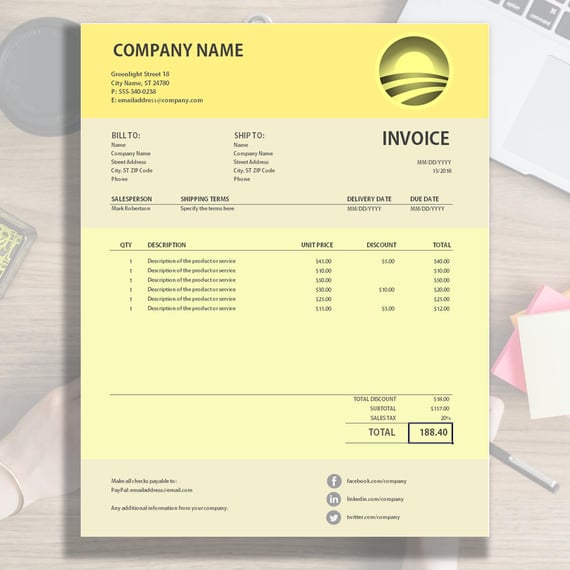
This invoice sample uses various shades of yellow to chunk out different parts of the invoice into digestible sections.
This invoice also leverages the footer of the statement to point customers towards the company’s social media channels as a way to offer a lasting connection.
17. Yellow Minimalist
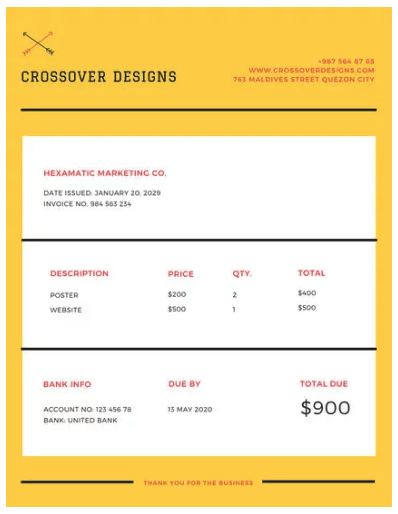
There’s something about yellow that makes a document friendlier. Vibrant but unaggressive, this template emphasizes your price in large font on the bottom-righthand corner, with a yellow border to make sure it doesn’t get forgotten in a pile of other white sheets of paper on your client’s desk.
18. Victory
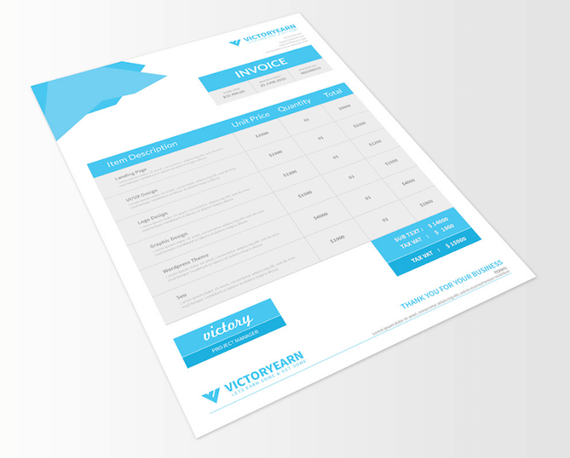
This invoice template offers space for a logo on the bottom-lefthand corner, rather than the top, for professionals who want to make it clear right away that this document is a bill to be paid (hence “INVOICE” listed on the top-righthand corner).
The invoice’s midsection allows the sender to include a thorough description of each service provided — a helpful billing format if your business spanned multiple projects over a long period.
19. Soft Banner

Professional designers, here’s an invoice concept just for you. Showing your clients a colorful, brand-aligned invoice is a surefire way to get clients remembering you and rehiring you for more work.
In this design, the centered price banner uses a soft green background to make steep costs look a bit less frightening to the customer.
20. Classic Designp
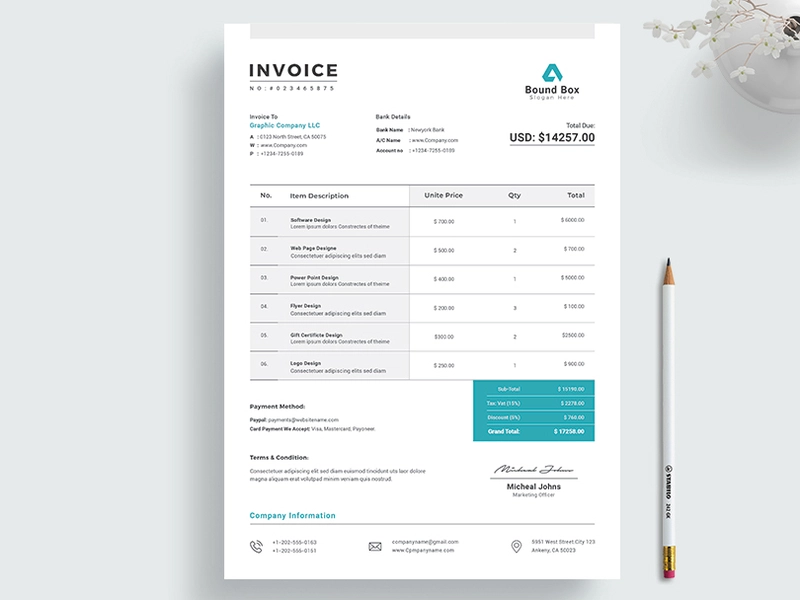
Here’s another elegant invoice template to serve as inspiration for your own. The template is simple and quickly highlights how much clients are expected to pay for a product or service.
You can also insert the “terms and conditions” of your contract in this template so you can remind customers what they signed up for when choosing your business. After all, they might be confused why you’re charging them a certain fee and may want to review the terms and conditions of their contract before reaching out for help.
21. Martin Ehrlich

One look at this invoice design from Martin Ehrlich tells you that it’s built with photographers or visual creatives in mind.
This template comes with plenty of white spaces that make it easy to scan and identify the essential details like the supplier’s name, amount due, and the different services offered.
22. Invoice by ThemeDiviser
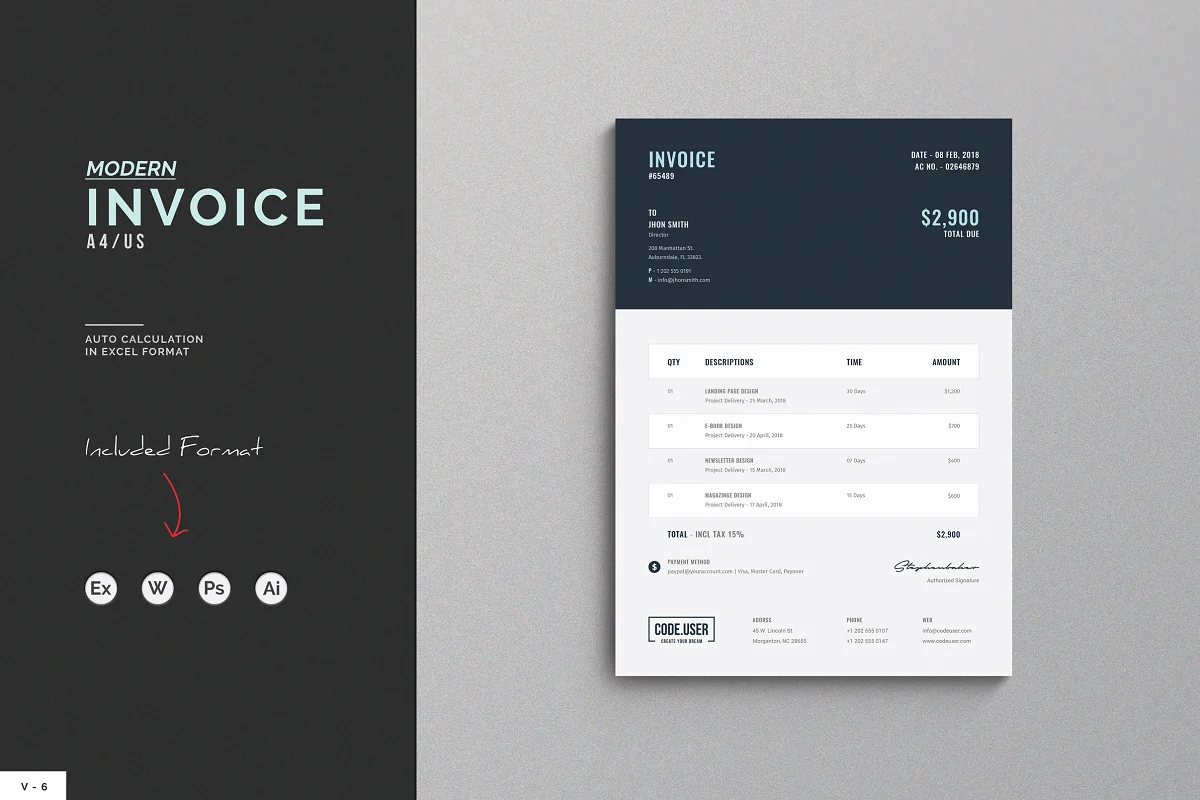
It’s hard for clients to miss how much they owe you with this invoice template, thanks to the amount’s bold description at the top of the invoice.
Below the “total payment” is a breakdown of the services rendered, along with your contact information as well as your branding.
23. Invoice Template by Guuver
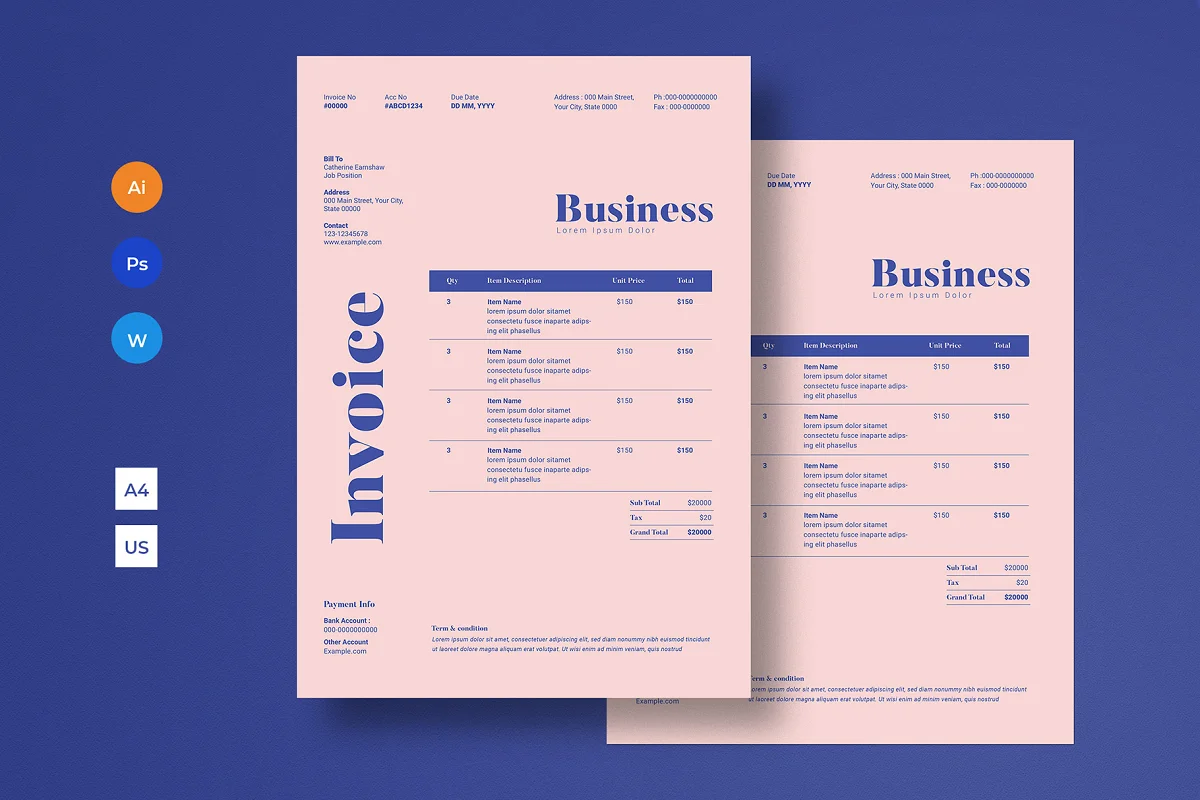
Your invoice doesn’t need to have a white background, and this template from Guuver is a perfect example.
The template’s slightly pink background and distinct blue font — both of which are customizable — are sure to leave a lasting impression on your client’s mind.
24. Clean Word Corporate Invoice
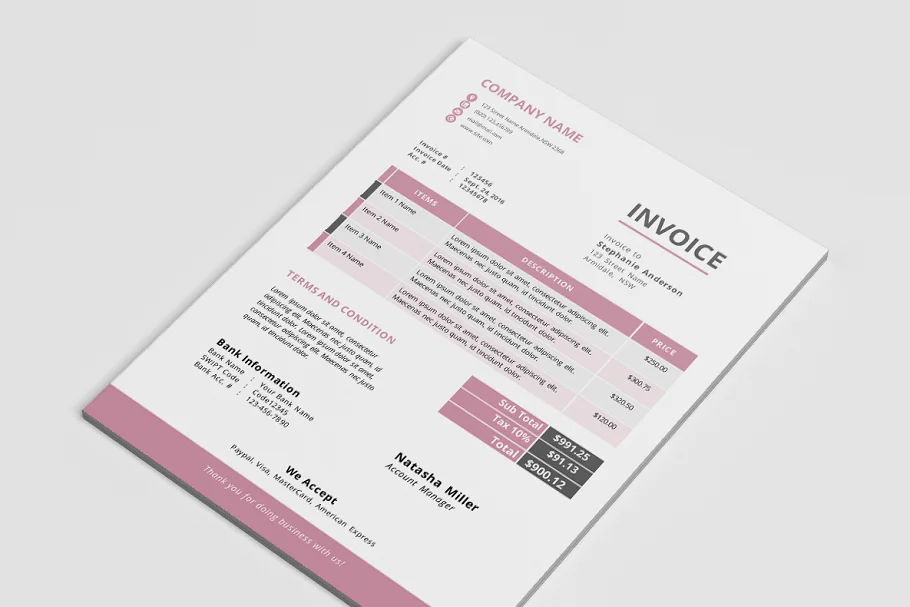
This invoice template adds a modern and elegant look to the otherwise dull template standard in the corporate world.
You can use the template on MS Word without any complications — just plug and play.
25. Invoice Template by Ariodsgn
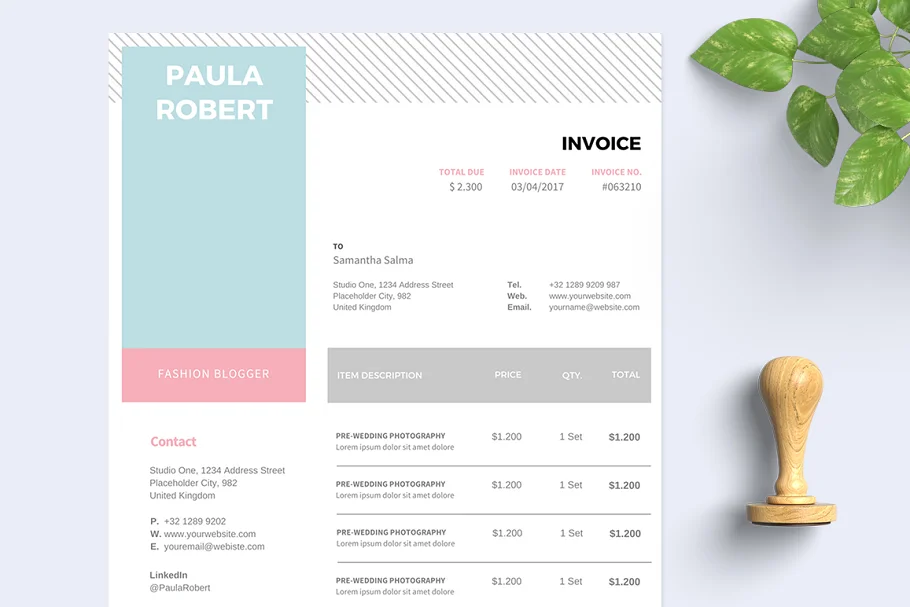
How would you like an invoice that looks like a resume? This template from Ariodsgn is the right mix of creative, modern, and professional. Perfect for making a positive first impression on your customers.
26. Retro Invoice
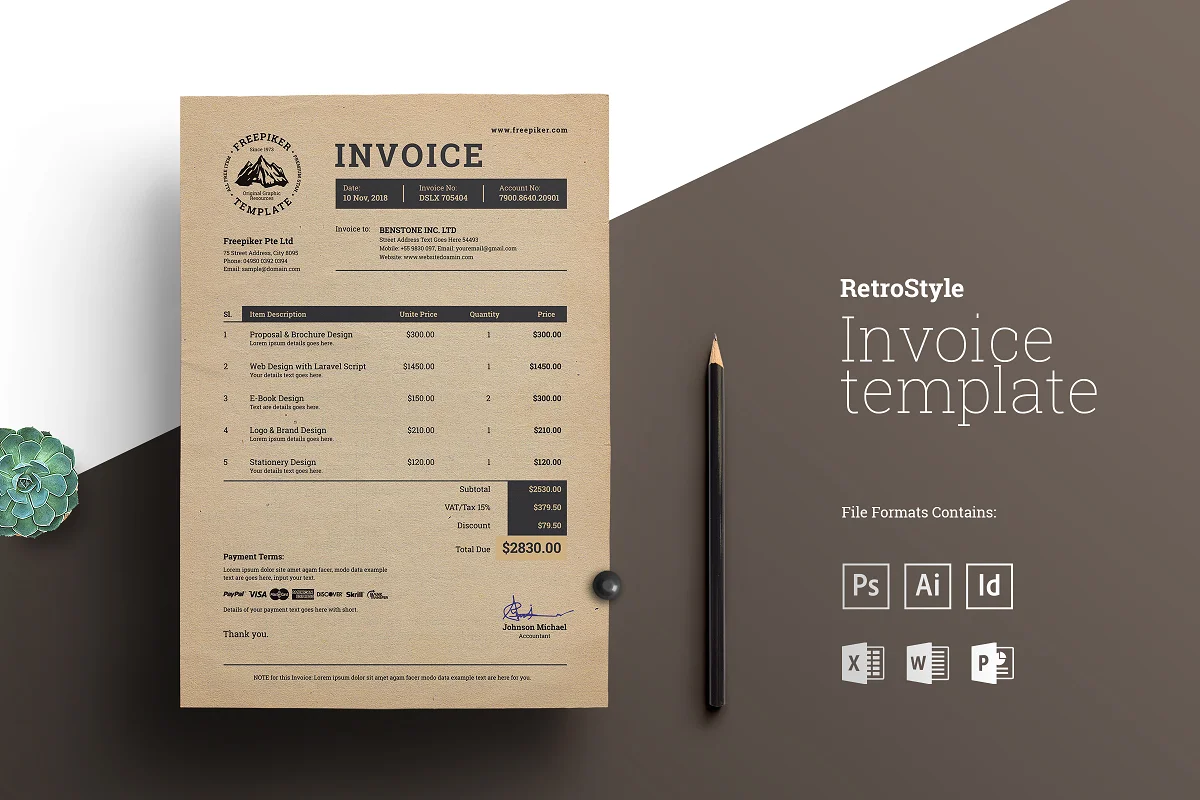
Take your clients back to the ’80s with this retro invoice design. Although old-fashioned, the focus of this template remains on passing across a clear message regarding your payment information to clients.
How to Write an Invoice
Want to make your own invoice? We’ve got you covered.
Check out HubSpot’s Invoice Template Generator to create a professional invoice PDF in just a few clicks. Here’s how to use it:
- Click this page to visit the Invoice Template Generator.
- Click the dotted square on the top-righthand corner of the template to upload an image file of your logo. Or, drag and drop this image file into the square.
- Use the circular wrench/paintbrush icon to the left of the template to change the invoice’s color scheme.
- Hover your cursor over the “Item Description” section to “Add More” rows if you’re billing your client for more than one product or service.
- Hover your cursor over each individual field to customize details such as invoice number, company name, item quantity, and relevant notes to the recipient.
- When you’ve finished customizing your invoice, click “Download Now” just below the template. Your invoice will download as a PDF.
You can also download ten other invoice templates that you can customize to meet your needs, whether you’re a freelancer or a large corporation.
At the end of the day, invoices should tell clients how much they owe, what they’re paying for, and what date they need to pay by. If you’re having trouble designing an invoice, or just want to shake things up, choose one of the pre-made templates above and get started with redesigning your invoices today.
Editor’s note: This post was originally published in February 2019 and has been updated for comprehensiveness.


Your Cheat Sheet to Google’s 200 (Known) Ranking Factors
If you’re an SEO, I know you can relate to the following scenario.
You do thorough keyword research and create super awesome content that ends up performing well — score!
You are riding the waves of growth in SERPs and feel like you’re on top of the world.
And the next day, there’s an algorithm update that comes along … and just like that, your rankings have tanked.
Regardless of whether an algorithm update rocks or destroys your world, they’re an inevitable occurrence. So it’s time to face the facts, and take the changes in stride.
As difficult as ranking in the coveted number one spot may seem, there is a list that’ll help you get there: Google’s 200 known ranking factors.
This list serves as our guide in a field that’s constantly evolving.
In 2006, Google declared that it was using over 200 ranking factors. While that’s certainly the most comprehensive perspective, I’ve pulled all the known ranking factors together in one post and shared my personal top 10 to make it a bit more tactical.
But before you jump in, understand that everything is arguable in SEO, and there have been some controversies concerning these “200 known ranking factors”. SEO’s often differ in their perspective on which ranking factors matter the most — or whether they’re important at all.
Nevertheless, user experience is one thing Google continually improves for their users. If you want to create more helpful content for your ideal audience, it’s worth referring to these ranking factors to improve both your SEO and your overall marketing strategy.
What is a ranking factor on Google?
Ranking factors are the criteria applied by Google (and other search engines) when evaluating pages to decide the best order of relevant results to return for a search query.
Understanding ranking factors is necessary for effective SEO. All marketers, content creators, and SEO strategists should be familiar with them — not because they’re the end-all, be-all of SEO (they’re not), but because they help create a better user experience, which ensures more leads and conversions for your business. So I would strongly recommend using these factors as a guide.
How many Google ranking factors are there?
There are over 200 ranking factors that are generally considered correct (but again, it’s debatable). Since 2006, there have been thousands of algorithm updates.
With each update, SEOs test to see what’s changed. So, some of these factors are proven, but others are just speculation.
All 200 (Known) Ranking Factors
I’ll start with a rundown of all 200 ranking factors, then go in-depth into the top ten ranking factors that, based on my experience as an SEO consultant for B2B and B2C companies, have the most impact.
Here are the top categories:
- Domain Factors
- Page-Level Factors
- Site-Level Factors
- Backlink Factors
- User Interaction
- Special Google Algorithm Rules
- Brand Signals
- On-Site Webspam Factors
- Off-Site Webspam Factors
Domain Factors
Domain factors are all ranking factors that connect with your domain (the basic example.com version of your website), including:
- Your domain age
- Keyword in your domain
- Keyword is the first word in your domain
- Domain registration length
- Keyword in subdomain
- Domain history
- Penalized Whois owner
- Public WhoIs instead of private Whois
Page-Level Factors
Page-level factors are factors on each page that you can optimize, such as:
- Presence of the keyword in the title tag
- Having the keyword at the beginning of your title tag
- Keyword in your meta description tag
- Presence of the keyword in the H1 tag
- Keyword is frequently used in the content
- Content length
- Word count rankings
- Presence of a linked table of contents
- Keyword density
- Presence of semantically related keywords
- Semantically related keyword in meta title and description
- In-depth quality content
- Useful content
- Page loading speed via HTML
- Page loading speed tested on Chrome
- Core web vitals
- No duplicate content on the same site
- Image optimization through ALT, title, and file name
- Content recency (the newer, the better)
- Page age
- How many edits were made to the content during updates
- Historical data on page updates
- Proper use of rel=canonical
- Presence of keyword in H2 and H3 tags
- Presence of keyword in the first 100 words
- Grammar and spelling
- Originality of the page’s content
- Entity match
- Number of outbound links
- Mobile useability and optimization
- Hidden content on mobile (may not be indexed)
- Page optimized for mobile
- Presence of multimedia, for example, images and videos
- Number of outbound links
- The quality of outbound links
- Theme of outbound links
- Presence of helpful supplementary content, like free tools and calculators
- Content hidden behind tabs (it may not be indexed and wouldn’t show up in search snippets)
- Number of internal links pointing to the page
- Quality of the internal links
- Presence of too many broken links (could lower ranking capabilities)
- The reading level of the page
- Presence of many affiliate links
- Presence of many HTML errors
- Authority/trust-level of the domain
- Authority/trust level of the page
- PageRank
- Length of URL
- Closeness of URL to the homepage
- Presence of keyword in URL
- Opinion of human editors
- Relevance of page’s category to page
- Content formatting for user-friendliness and readability
- Priority of the page in the sitemap.xml
- UX signal from pages ranking for the same keyword
- Citing references and sources
- Use of a user-friendly layout
- URL string in Google search engine results
- Internal link anchor text to the page
- Use of structured data
Site-level factors
Site-level factors go above the page level and take a look at things on the entire site. They include:
- Presence of a contact us page or appropriate amount of contact information
- Content on site provides value or new insights
- TrustRank (how close your site is to a known and trusted site in terms of linking)
- Website updates for freshness factor
- Site architecture
- Presence of a sitemap
- Long-term site downtime
- Location of server
- HTTPs / use of a valid SSL certificate
- Presence of legal pages (terms and conditions and privacy policy)
- Unique metadata
- Use of breadcrumb markup
- Site-wide mobile optimization
- Site-wide user-friendliness (usability and interactiveness)
- Bounce rate
- Domain authority
- User reviews
- Site reputation
Backlink factors
Backlink factors look at the sites that are linking to you to determine where to rank your page. Sites with better quality sites linking to them tend to be higher in rankings when they have quality content. The backlink factors are as follows:
- Age of linking domain
- Number of referring domains
- Number of links from separate c-class IPs
- Number of referring pages
- Anchor text of backlinks
- ALT tag of image links
- Number of links from .edu and .gov domains
- Trust factor of linking page
- Trust factor of linking domain
- Presence of links from competitors
- Number of links from expected sites in your industry
- Links from bad neighborhoods
- Number of links that are not from ads
- Country TLD of referring domains
- Domain authority
- Presence of some nofollow links
- Diversity of link profile
- Context of content the content of linking page
- Presence of more follow links that sponsored or UGC
- Lots of backlinks to URL with 301 redirects
- The text that appears when you hover over a link
- Link location on page
- Location of link in content
- Links from relevant domains
- Links from relevant pages
- Presence of your page’s keyword in the title of the linking page
- Natural rate of growth in number of links
- Spiky and unnatural rate of growth in number of links
- Links from top resources on a certain topic or hubs
- Number of links from sites that are considered authority sites
- Linked as a source in a Wikipedia article
- Words around your backlinks
- Backlink age
- Links from real sites vs fake blogs
- Natural link profile
- Excessive reciprocal links
- Links in real content vs. UGC
- Backlinks from a page with a 301 redirect
- TrustRank of linking site
- Fewer outbound links on linking page
- Links in real content vs links in forums
- Word count of linking content
- Quality of linking content
- Sitewide links = one link
User Interaction
Google always emphasizes in their update announcements how important it is to provide an excellent user experience to website visitors. These factors measure user interaction to rank your page accordingly, including:
- Organic click through rate for exact keyword
- Organic click through rates for all ranking keywords
- Dwell time
- Bounce rate
- Measurement of how users interact on your site based on RankBrain
- Total direct traffic
- Percentage of repeat visitors
- Blocked sites
- Percentage of visitors that click on other pages on the SERP after clicking visiting your page
- Page frequently bookmarked by Chrome users
- Number of comments on page
Special Google Algorithm Rules
Some Google Algorithm rules are not directly connected to your page or domain. They include factors that look at personalizing search results for the user or better search results as a whole. Here are some of them:
- Need for diversity in the SERP
- Need for freshness in the SERP
- Browsing history of user
- Search history of user
- Succinct answers, formatting, page authority and HTTPS for featured snippets
- Geo-targeting
- Adult content or curse words (excluded from safe search results)
- High content quality standards for YMYL keywords
- Legitimate DMCA complaints
- Need for domain diversity in SERP
- Transactional searches
- Local search results
- Presence of news stories related to keyword for Top Stories box
- Search intent
- Presence of big brands with relevant content (they are often ranked higher)
- Presence of results optimized for Google Shopping
- Image results
- Branded search
- Easter eggs and April Fools’ Day jokes and hoaxes from Google (this one makes me laugh)
- Spammy queries
- Spammy sites
Brand Signals
How great is your branding strategy in terms of SEO? If you haven’t taken care of your brand mentions and brand all over the internet, you need to start now. Because there are some serious ranking factors related to your brand:
- Brand + keyword searches (for example, Hubspot SEO)
- Branded anchor text
- Twitter profile with followers
- Official LinkedIn page
- Facebook page with lots of likes
- Branded searches
- Known author or verified online profile
- Real social media accounts
- Top stories with brand mentions
- Brand mentions without links
- Physical location of offices
On-site Web
To rank high on search engine results, you need to ensure your site isn’t spammy and doesn’t look spammy – as with many things in life, looks play a role in how we’re perceived. Here are some factors around that:
- Low-quality content
- Links to bad neighborhoods
- Multiple and sneaky redirects
- Flagged server IP address
- Distracting ads and popups
- Popups that are spammy and difficult to close
- Over-optimizing the site
- Gibberish content
- Use of doorway pages
- Lots of ads above the fold and not much content
- Hiding affiliate links
- Low-value content sites
- Affiliate sites
- Keyword stuffing in meta tags
- Compute generated content
- Nofollowing all outbound links
Off-site Webspam Factors
The Off-site webspam factors affect spam based on what’s done outside your website that connects with your website. They include:
- Unnatural and sudden increase in backlinks
- Hacked site
- Lots of low-quality backlinks
- High percentage of links from unrelated websites
- Low-quality directory links
- Automatic links in widgets
- Links from sites with the same server IP
- Using “poison” in your anchor text
- Ignored manual actions in search console
- Selling links
- Temporary link schemes
Phew, we made it! Even though this list might seem overwhelming, I’ve condensed it to my top 10 to make things a bit more palatable.
Top 10 Google Ranking Factors
Before we go into my top 10 Google ranking factors, keep this in mind: everything is debatable in SEO. While several SEO experts might accept these 10 factors as their top ranking factors as well, other SEOs might disagree. But for me, these are what I’ve found to be most important.
I chose my top 10 based on what I’ve seen improves the user experience, optimizes conversion rates, signals trustworthiness, ranks well, brings in high amounts of organic monthly traffic, and promotes customer retention and loyalty. Let’s dive in.
1. Content that provides valuable and unique insights.
As mentioned above, Google has always emphasized quality content. Providing content that provides value and unique insights not found on every other website can improve your ranking simply because your audience enjoys it.
To do this:
- Ensure you are the subject expert in what you are writing about or that you understand that topic in-depth according to research.
- Hire subject experts to write your content.
- Provide factual information that informs your audience about the questions that are the most important to them.
- Don’t write fluff.
2. Content that covers a topic in-depth.
Want to rank on the first page? Stop writing thin content. Research has proven time and time again that content that covers all areas, whether long or short form, tends to do better in search results. Here’s what to do:
- Study your competitors’ content and write about what they missed.
- Cover all relevant areas and answer all questions that readers might have.
- Make the text readable by adding elements like images, a clickable table of contents, jump links, and CTAs to relevant information.
3. Organic click-through rates.
Your organic click through rate helps Google understand whether people like your content or not. If more people are clicking on your post in the SERP, Google will believe your content is more relevant to that keyword and rank you higher for it.
You need to write a convincing meta title and description to improve your organic click-through rate. Here are tips for writing the best meta title and description:
- Use power words.
- Ensure your keyword is visible in the meta title.
- Keep your meta title under 62 characters.
- Keep your meta description at about 150 characters.
- Your meta description should be helpful to readers (use it to show them how they benefit from reading your content).
Note that to get to a point where you can improve organic click through rate, you should have all other SEO factors in place for higher rankings. I mean anyways, if you are in the 100th position, most people wouldn’t see your page to begin with.
4. Keywords in H1.
The H1 is an indication of what your content is about. So, include your keyword in your H1. Be careful, though; some SEOs say that using the same sentence in your H1 and meta title is an indication that you are keyword stuffing. So, you might want to spice it up a bit while still ensuring that your keyword is present. Do this in combination with all on-page optimization (meta data, URL, other headings).
5. The content’s length.
Content length is one thing that several people debate about when it comes to SEO. Some believe an upward of 2000 words should be the standard. However, that shouldn’t always be the case. Sure, long-form content seems to get the most backlinks, but it’s crucial that you write long-form only when you need that to cover the entire topic.
It’s also a best practice to check what your competitors have because that can be an indicator of quality content. If all competitors have between 2000-4000 words and you write 200 words, you will likely not rank high for that term.
6. Website domain authority.
Domain Authority (DA) is not a ranking factor despite what many say, and the simple reason is: Google didn’t create it. When asked if it is a signal, John Mueller replied, “…it’s a tool by Moz”.
But from my perspective, it’s good to keep in mind because Moz uses particular signals to create that score (and other tools like SEMrush and Arel=” noopener” target=”_blank” hrefs) that are similar to Google’s ranking factors.
When more trusted sites are linking to yours and you have content that ranks well, that is an indicator that you should be trusted, which in turn increases your rankings even further – all of which plays into DA. So in a nutshell, you might want to focus on growing your DA even if Google doesn’t confirm it.
7. Total number of backlinks from relevant sources.
The total number of your backlinks and referring domains are important, but only when they are from relevant sources. In February 2021, John Mueller commented about the importance of link relevance and that you can build many backlinks, but Google will ignore them if they are not relevant.
Rather than focusing on building millions of backlinks, focus on more relevant and quality backlinks.
8. Page loading speed via HTML.
Last year, Google announced that core web vitals would become a ranking signal and it’s planned to launch in mid-June. Core web vitals is a part of PageSpeed, and page speed affects user experience.
If your site is too slow to load or slow to interact with, Google is more likely to reduce your rankings, especially when your competitors have fast site speed and great content.
9. Mobile usability.
User experience is key for SEO success and users are increasingly accessing your website via mobile. That’s why Google sends constant mobile-friendliness notifications in Search Console when it sees that your site isn’t responsive.
If you want to score points with Google and, more importantly, your users, work on your mobile usability.
10. Over-optimization.
Don’t overdo it — this serves as a reminder that you must prioritize optimizing for humans, not the algorithm. When you over-optimize your pages, Google sees that you’re trying too hard and might believe you are trying to game the system. If that happens, you get penalized.
Here are other important ranking factors that didn’t make the top 10 cut, but you should make sure to work on as well:
- Quality of internal links pointing to page
- Site architecture
- Site usability
- Contextual links
- Outbound link quality
- Dwell time
- Branded searches
- Image alt text
That’s all, folks!
You’ve now gotten to know the 200 known ranking factors and my preferred top 10. Use this article as a guide, not as hard rules. I’m not Google and only Google can confirm what the exact ranking factors are. Most of this data is from what I have seen from working with several websites over the years.
Remember, user experience is key, so continually optimize for your target audience, and you will be duly rewarded.

Where Do Shoppers Research Products on Social Media? We Asked 300 Consumers
In 2020, 42% of people used social media channels for product research.
With younger generations getting more and more connected to social media, the amount of product research done on these platforms is likely to grow. In fact, 16 to 24-year-olds already conduct more product research on social than on search engines.
Throughout the past few years, social media channels have embraced their new role as product research channels, devoting certain areas or features of their platforms to showcasing brands and products.
For example, Facebook Ads is considered an alternative to Google Ads, YouTube is a go-to site for learning about new products (and how to use them), Instagram offers Shoppable posts, and Reddit users regularly participate in discussion threads about products and brands. And let’s not forget Pinterest, which continues to position itself as a tool for advertisers by improving its ad software.
With all the social media platforms and product marketing opportunities out there, it might be hard to drill down which platforms are key to your marketing strategy.
By now, you might be on all the major social media platforms. But, as they expand and evolve, you might still wonder which you should focus your time and efforts on if you’re selling a physical product. To determine this, it helps to find out which social channels your specific audience is using, and then create strategies that meet them where they are on their preferred platforms.
To learn more about the social networks people prefer to surf for product research, I conducted a poll of 304 people using Lucid Software.

Why is shopper research important?
Shopper research is critical for a better understanding of the customer journey from initial searches to website visits and eventual purchases. The advent of digital- and mobile-first interactions has made this research even more important as the customer journey now includes multiple paths and touchpoints from start to finish.
For example, prospective buyers might hear about your brand from a friend, do their research on social media, and then interact with your ecommerce store through their mobile device. Understanding all touchpoints along this journey can help companies create more seamless and streamlined experiences for consumers and increase overall ROI.
Shopper Insights Reveal Social Media Research Habits
Source: Lucid Software
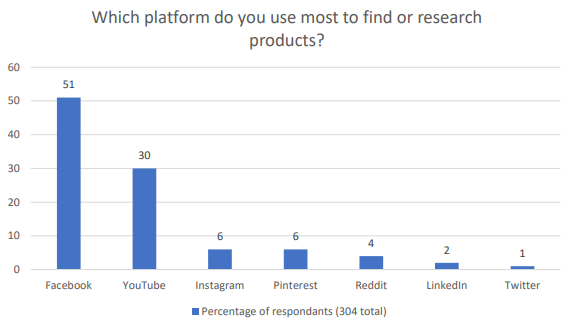
At first glance, the survey data seems simple: Facebook is far and away the market leader when it comes to product research and eventual purchasing, followed by YouTube.
But that’s not the whole story. Part of the reason Facebook and YouTube rank so highly is because of their installed user base — for example, Facebook has three times the user base of Instagram, despite being owned by the same company.
It’s also worth noting that while Facebook marketing appeals to a broader audience, volume alone doesn’t guarantee conversion. Users on Pinterest and Reddit tend to be much more engaged with their social community — meaning that if your brand can capture their attention you can create substantive consumer loyalty. LinkedIn, meanwhile, relies on authenticity and authority to inspire confidence, while Twitter is all about what’s trending right now.
Here’s a breakdown of the data:
- Facebook: 51%, 155 people
- YouTube: 30%, 91 people
- Instagram: 6%, 18 people
- Pinterest: 6%, 18 people
- Reddit: 4%, 12 people
- LinkedIn: 2%, 6 people
- Twitter: 1%, 3 people
Facebook has a whopping 2.7 billion active daily users and has been around since the early 2000s. Its audience includes multiple age groups and spans the globe, making it a solid place for most brands to market themselves.
When it comes to marketing your product, you have many free and paid options on Facebook. Here are a few examples of each.
Free Promotion
By now, you probably know that any company can create a Facebook Business Page. Once you create a business page, you can share posts about your products and offerings. If you have happy customers, you can even ask them to review your business on Facebook so prospects researching you can see how you’ve pleased your customers in the past.
Aside from creating a page to highlight your brand, you can also post your products in Facebook’s Marketplace. Marketplace listings can include product shots, pricing, product specifications, and purchasing information. Although individual users often use the Marketplace to sell items they no longer want to other people, Facebook Business pages are also eligible to use this feature.
You should also consider talking about your products or offerings on Facebook Stories. This might take a little extra effort because it will require you to film or create content in the Story format, but it can help you better connect with prospective buyers who want a better sense of what your brand is about.
Paid Promotion
Because Facebook’s feed algorithmically favors posts from individual accounts over businesses, you might decide that you want to put money into Facebook Ads.
Facebook Ads has a solid track record. It’s estimated that 10 million businesses were advertising on the platform in 2021.
With Facebook Ads, you can create advertisements with a certain goal in mind, such as conversions or in-store foot traffic. The detailed ads software also allows you to target specific audience demographics.
As a Facebook advertiser, you can either promote a post you’ve already created to ensure that it shows up on feeds of users in your demographic, or you can create native ads that might show up in feeds or on Facebook’s sidebars. While promoted posts look like an average post with a simple tag stating they’re promoted, the native ads look more like traditional ads to make it clear to users that the content they’re seeing is paid for.
If you want to launch video-based ads, Facebook also allows you to promote video content or buy in-stream ad placements that appear in Facebook Live videos or longer videos that other users have uploaded.

YouTube
If how-tos or video tutorials are part of your content marketing strategy. YouTube will be a natural fit for your brand. This is because YouTube users are three times more likely to prefer watching a YouTube tutorial video compared to reading the product’s instructions.
More and more companies are taking notice of YouTube’s product marketing opportunities. It makes sense, since 70% of viewers say they’ve made a purchase after seeing a brand on YouTube.
With a branded YouTube channel, you can publish video content such as demos, tutorials, or customer testimonial videos that give insightful details about why your product is valuable. By filming your own videos, you can insure that you’re highlighting all the great aspects of your product that make it stand out from its competitors.
Alternatively, if you don’t have time to create your own videos, sponsoring an influencer’s content, tutorial, or review related to your product allows you to tap into that content creator’s audience as they tell their followers more about your offerings.
Aside from creating your own account or hiring an influencer to give a review or tutorial, you could also consider paid advertisements. YouTube offers a few ad styles including TrueView, Preroll, and Bumpers.
These ads allow you to submit a short video ad to YouTube which is then placed at the beginning or in the middle of videos with metrics and demographics that match your brand’s target. To learn the ins and outs of setting up an ad and determining which style is right for you, check out this guide.

Although Instagram ranked in third place in the poll above, you shouldn’t disregard it — especially if you’re targeting Gen-Z or millennials who make up the platform’s primary audience.
For years, Instagram’s visual layout has made it a hot spot for influencer marketing. Influencers regularly post sponsored photos and videos about their experiences with products. Like YouTube, these influencers also regularly publish video posts or Stories that present tutorials, reviews, and unboxings related to a product.
Aside from influencer marketing, many brands also promote their products on Instagram Stories, Instagram Live, and through standard video or photo posts on Instagram Feed.
Here’s an example where Kylie Jenner, the CEO and Founder of Kylie Cosmetics, films a Story-based product tutorial for her company’s Instagram account:

Along with free strategies, Instagram now offers Shoppable posts. With Shoppable posts, you can promote a product in an Instagram post that links to your Facebook Catalog. Here’s an example of what a Shoppable Post looks like:

To be eligible for Shoppable posts, you must have an Instagram Business page that’s linked to a Facebook Catalog. This feature is also only for businesses selling physical goods.
Here’s a blog post that goes into detail about how to use and optimize Shoppable posts.
Pinterest encourages people to pin image-based posts that inspire them to digital boards, mimicking the process of creating a physical inspiration board.
Because people come to this platform to be inspired to do something, such as travel or home decorating, they might find themselves pinning all sorts of product-oriented images to a themed board. For example, someone who wants to redecorate their office might create an “Office Inspiration” board and pin photos of furniture or decorative items that they’d like to buy.
Here’s an example of what these boards look like:

To make it easier for people to find your products, you could consider starting a Pinterest account and making a few boards to highlight your products. For example, if you’re marketing a travel company, you could make a board for each country that you offer packages to. On each board, you could place images of trip activities that link to your website.
Then, if someone is trying to plan a trip to a country you sell a package for, they might come across one of your posts and pin it to their own “Travel Inspiration” board.
To give you a real-world example of how brands use Pinterest, below is a Wedding Registry board created by Target which features images of products that a bride and groom might want to add to their gift registry.
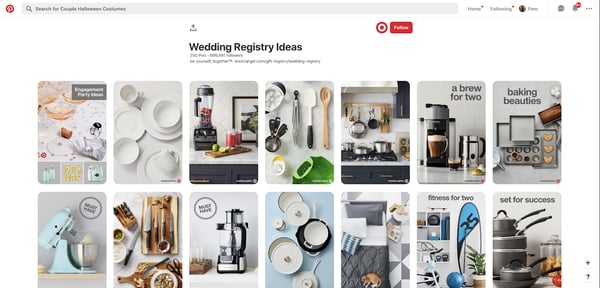
Each of Target’s pinned images links to the company website so users can share the pin on their own Pinterest board, or click straight through the post to buy or register the product.
If you have an advertising budget, you can also consider launching pay-per-click ads on Pinterest. Pinterest Ads enables your posts to be seen by people in a specific demographic that matches your own. The platform also allows you to A/B test photos and target ads to Pinterest users on your contact lists.
Want to learn more about Pinterest Ads and effective experiments to run? Check out this blog post from a PPC and Pinterest expert.
Reddit encourages users to create discussion threads in themed online communities, called subreddits. As the platform has evolved, many users have created both threads and subreddits devoted to talking about products, like fast-food restaurants or video games.
Below is an example of a subreddit, or online community, that Reddit users created to talk about all things related to Xbox One.
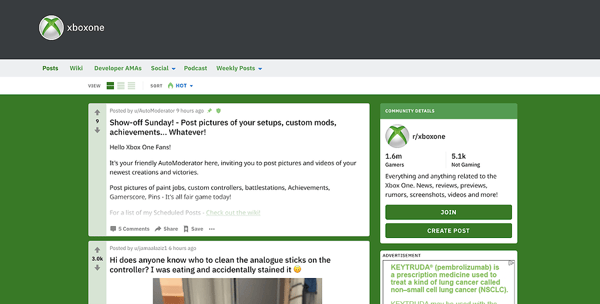
However, because comments with promotional language in them often get downvoted or buried in feeds by more engaging Reddit threads, you’ll need to be creative if you want to engage with audiences on this platform.
While you might want to keep an eye on Reddit or experiment with it, don’t put all of your time and resources into it — at least right now. As it evolves, the platform may become an easier platform to market your brand on, but at the moment, Reddit marketing strategies still require more brainstorming and time than tactics on other social platforms.
Although this platform has been called one of the “trickiest” for marketers to crack, some bigger brands have figured out how to reach the platform’s discussion-oriented users.
For example, some brands will create subreddits related to their product, while others will interact by commenting on threads related to their industry.
Aside from creating content for free on Reddit, you can alternatively pay into sponsored posts or ads, similarly to Facebook or Twitter. These ads will appear in a user’s feed or as a promoted comment in a thread or subreddit.
To learn more about the ins and outs of Reddit marketing, click here for tips and examples of how other brands have cultivated the platform.
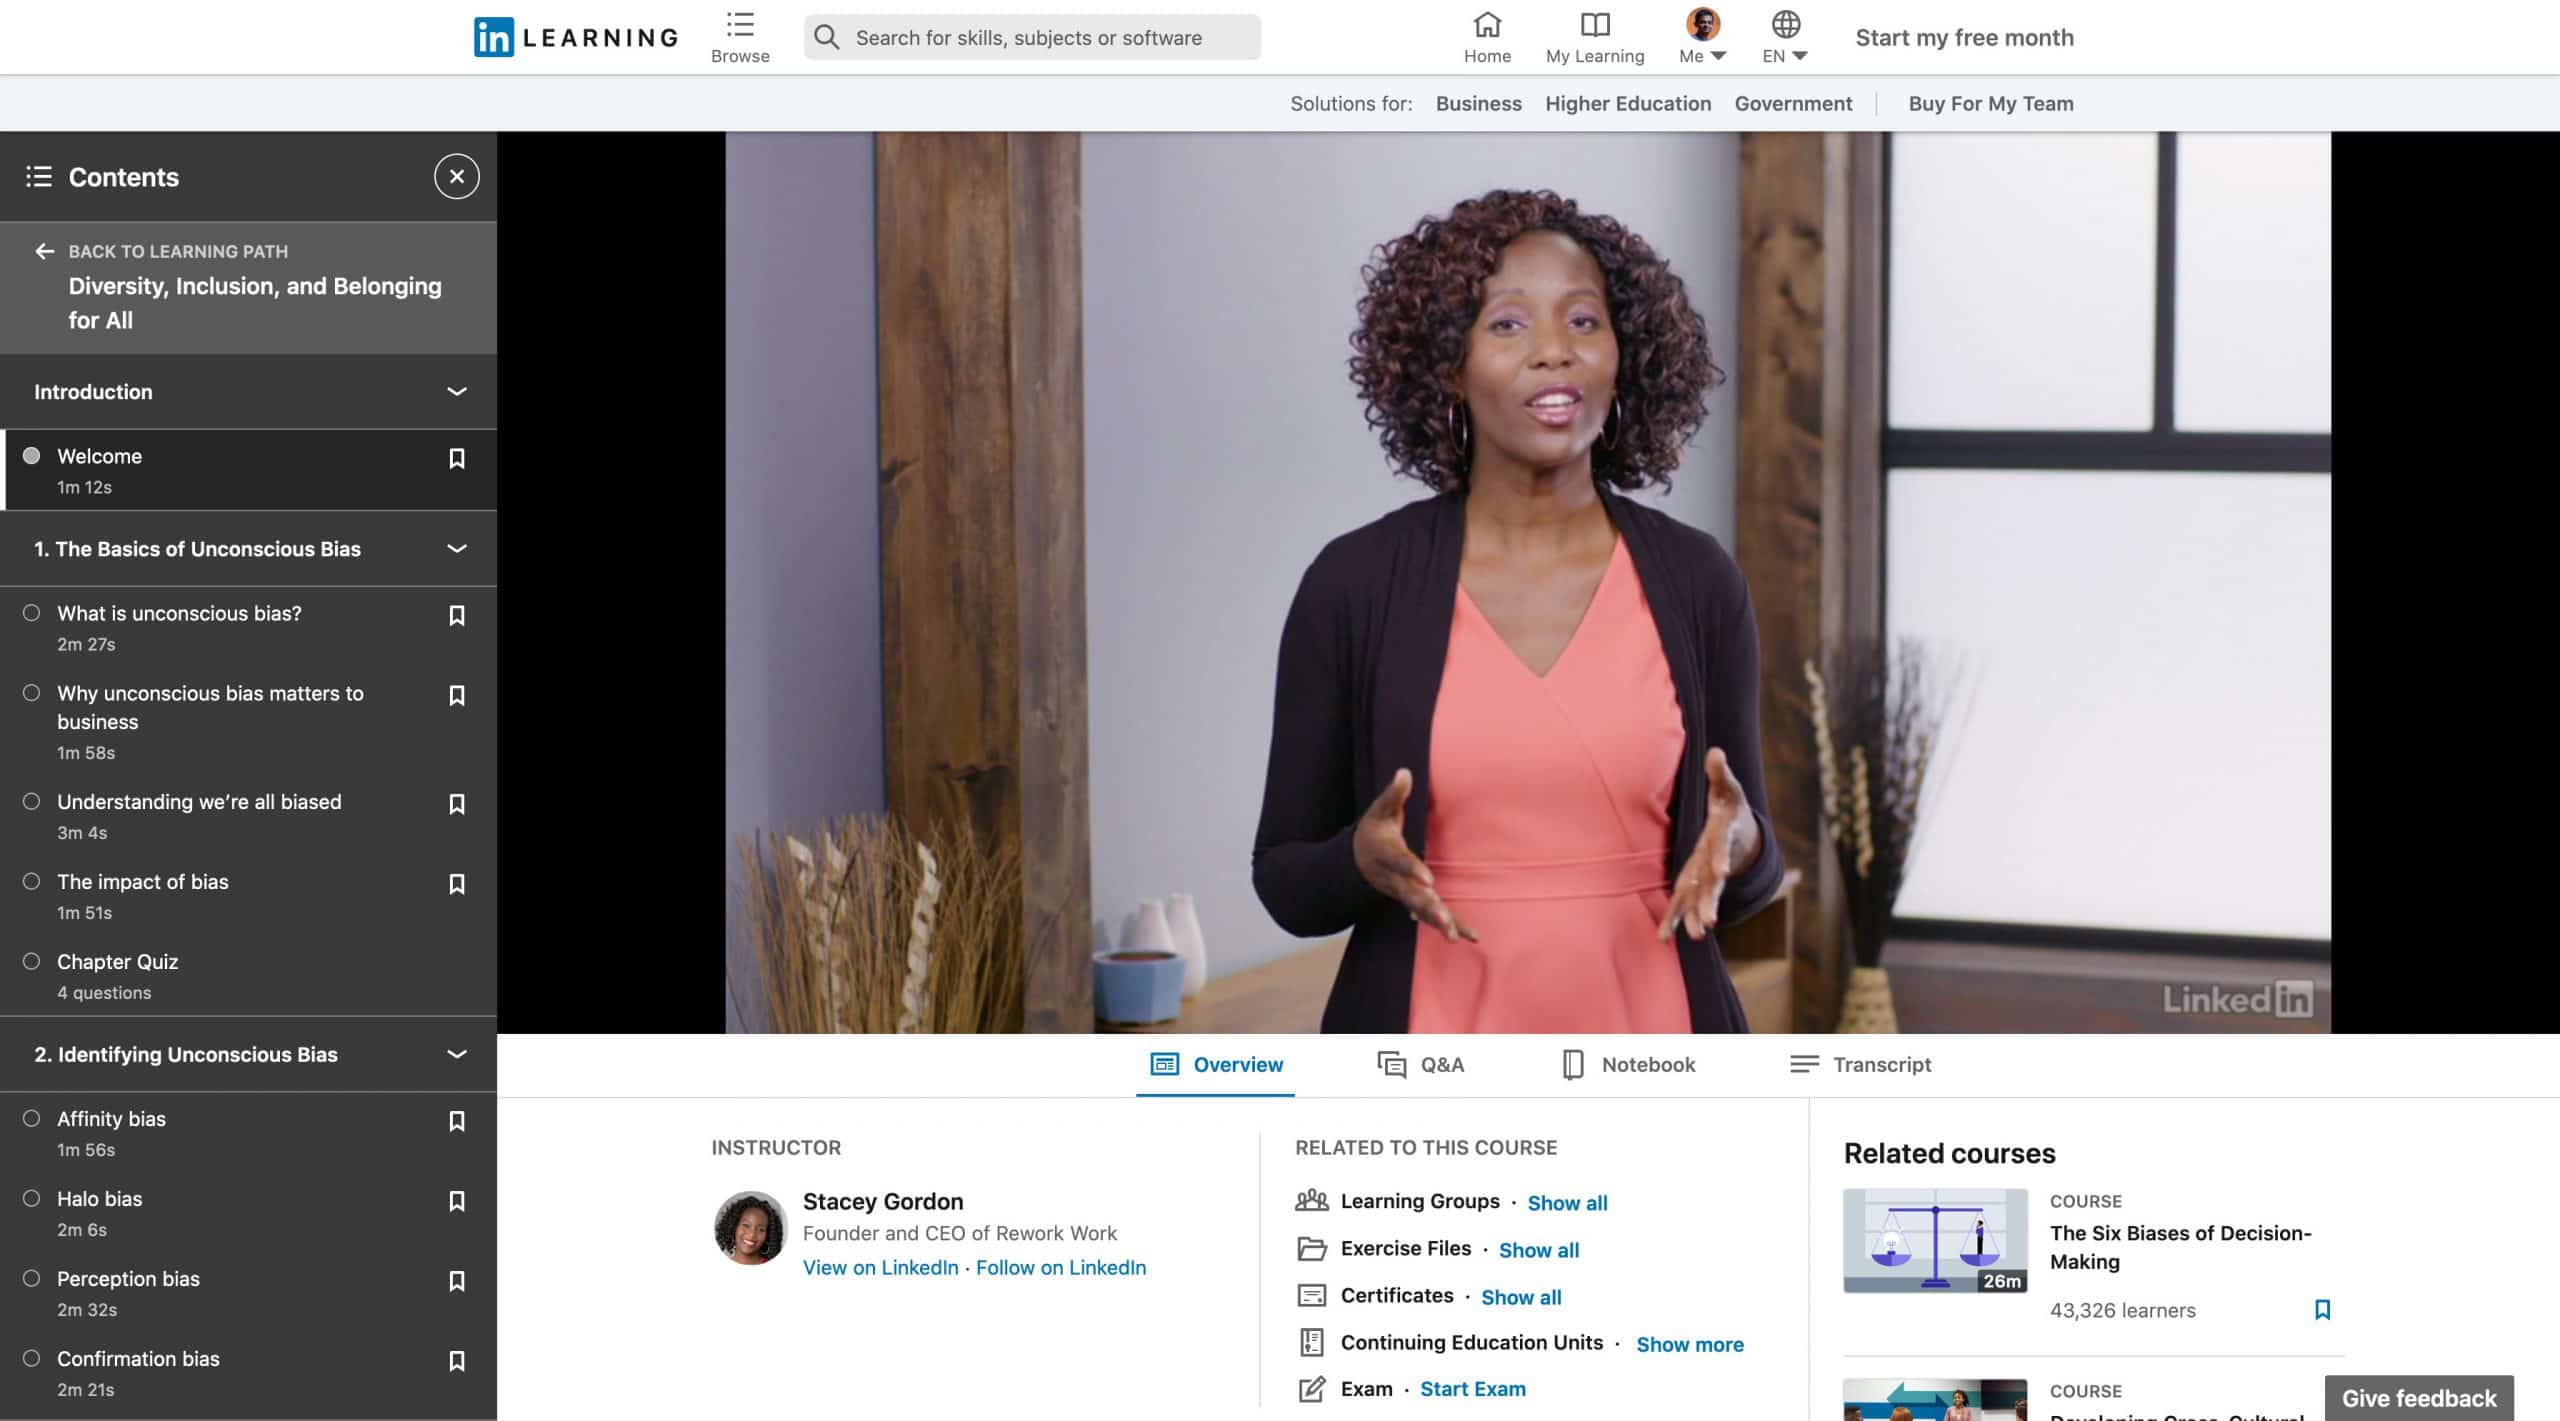
LinkedIn’s platform, which emphasizes networking and career-related chatter, might be well-suited for product marketing in B2B, academic, or professional industries. People who do product research on this platform might be looking for a service, tool, or software that can either escalate their careers or make their workdays easier.
If you’re marketing products like software, online courses, business-related publications, or anything that can help a professional or student do their job better, LinkedIn will be a great fit for you. However, if you sell more general, consumer-facing products like makeup or home decorations, you might want to put more marketing effort into other platforms on this list — like Facebook or Instagram.
While the professional nature of LinkedIn and its audience might not be suited for all brands, the platform still offers a variety of opportunities for brands to leverage it. For example, research shows that 80% of B2B leads come straight from LinkedIn.
LinkedIn is very similar to Facebook in that you can post about your product or service for free, or purchase ads or post promotion to get information about your business front and center on feeds. To see a few great ad examples, check out this post.
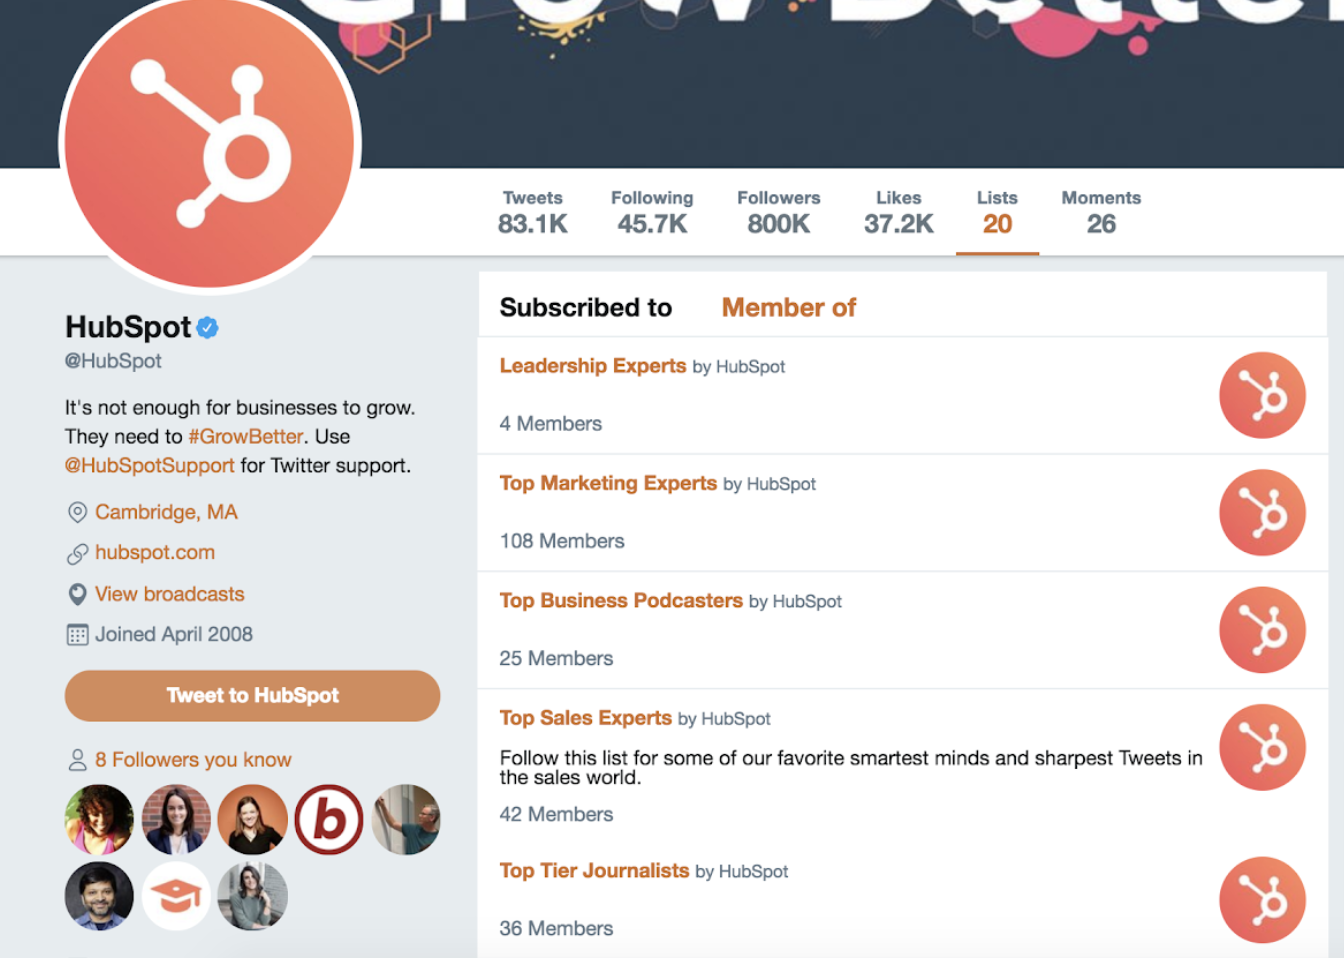
Twitter has approximately 200 million daily users from a variety of backgrounds, geographic locations, and industries. Its broad demographic might provide solid marketing opportunities to many different types of businesses. Because of its broad user base, you might want to create an account on Twitter and post regularly for brand awareness.
If you’re interested in video marketing, you can also experiment with Twitter’s live video feature and use it to film a tutorial or Q&A related to your product.
Aside from posting about your product for free, you can also pay into targeted ads or promoted tweets. Twitter claims that its advertising ROI is 40% higher than some other social channels.
While the ROI of Twitter advertising and its user base sounds promising, you might be wondering why it ranked so low on the poll shown above.
Ultimately, what might make Twitter rank last is its trend-oriented nature. The platform encourages people to connect with each other and post tweets or comments about current events, trending hashtags, or their thoughts on other specific topics.
Brands and product discussion are both prevalent on the platform, but users might go to Twitter to learn more about what’s going on in the world, rather than new products. When people are asked to pick which platform they do the most product research on, it’s not surprising that Facebook or YouTube might seem like a more obvious choice than Twitter.
While you should be on Twitter due to its sheer user base and advertising ROI, you’ll want to keep its audience’s need to stay trendy and informed in mind as you’re creating posts and advertisements for the platform. This might help you make social content that both engages these audiences while still weaving in information about how valuable your product is.
Identifying the Right Platforms for Product Marketing
While running ads and product promotions on any social platform can help drive conversion, it’s a good idea to focus on platforms with audiences that already align well with your brand.
For example, broader audiences are actively looking for products or researching brands on Facebook, Instagram, YouTube, and Pinterest while Reddit and Twitter users tend to be more trend-focused. Similarly, if you’re marketing a B2B company, you might see a better ROI from ads on a professional network — like LinkedIn — than ads on a more consumer-friendly platform like Instagram.
Use the information provided above, and start leveraging social media for lead conversion and product marketing.


The State of Content Marketing in 2021 [Stats & Trends to Watch]
Content marketing is the process of planning, creating, and sharing content with your target audience. It helps you generate brand awareness, convince customers to take action, and drive revenue.
There are various types of content marketing, like social media and blogs, but new trends and techniques emerge every year that change the ways businesses reach their audiences.
As a marketer, it’s essential to know what your competitors are focusing on, so you can create a strategy and stand out from the crowd. In this post, discover important stats to know about the state of content marketing in 2021 and trends to look out for throughout the year.

Content Marketing Stats to Know
- 47% of buyers view three to five pieces of content before engaging with a sales rep.
- 82% of marketers report actively using content marketing in 2021, up 70% from last year.
- Marketers’ primary goals for running marketing campaigns are brand awareness, increasing sales, and increasing engagement.
- Video is the most commonly used form of content marketing, overtaking blogs and infographics.
- Google’s search algorithms are trying to transcend text to images, voice/podcasts, and videos.
- The top technologies used by B2B organizations to supplement content marketing are analytics tools, social media publishing, and email marketing software.
- The top three organic content distribution channels for B2B marketers are social media channels, email, and website.
Content Marketing Trends to Watch in 2021
1. Video takes center stage.
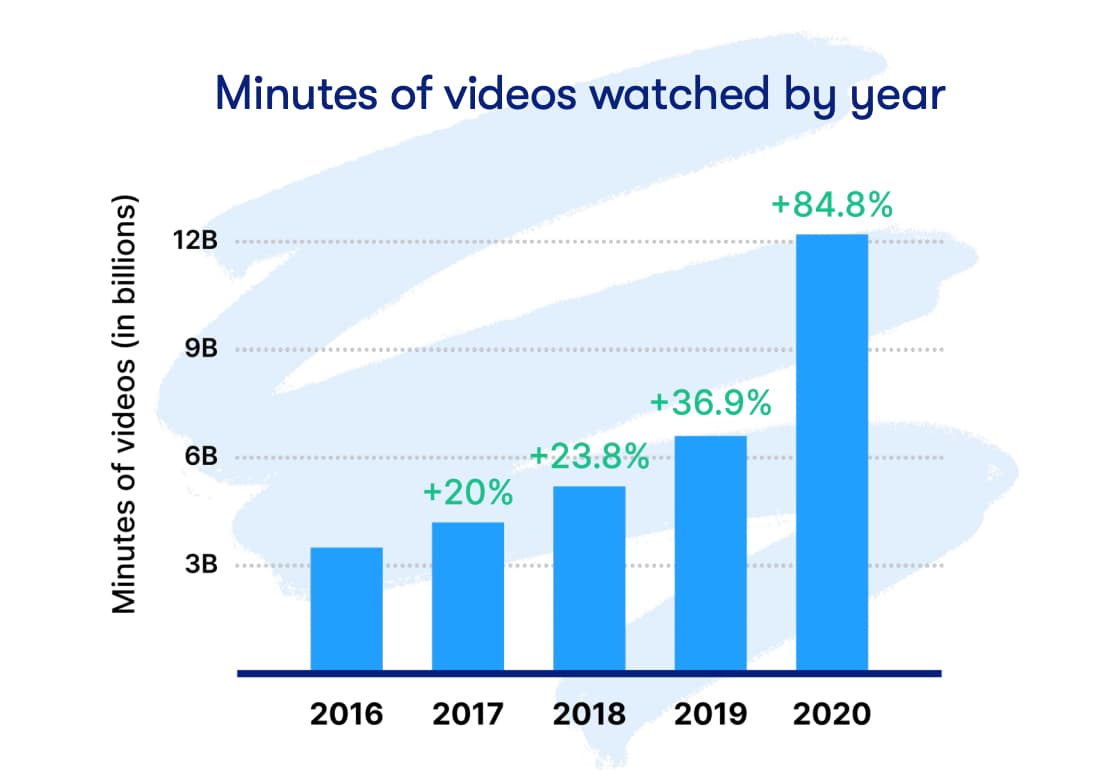
Media uploads increased by 80% YoY in 2020, as consumers spent most of their time at home passing time by watching content. Consumers watched 12.2 billion minutes of video in 2020 (as shown in the image below), equivalent to 23,211 years of content.
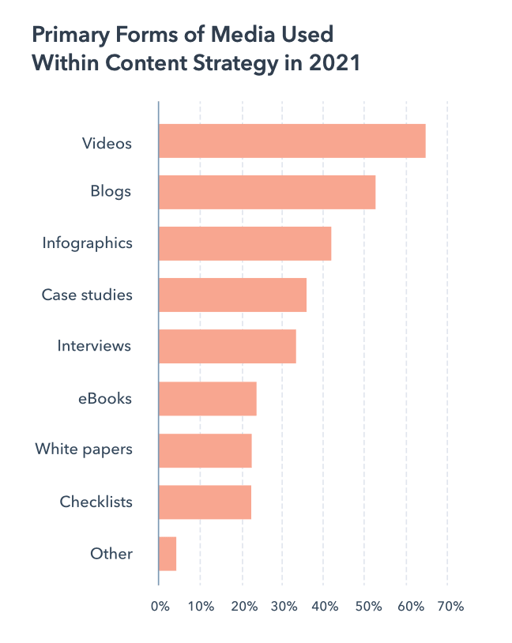
As a result of this changing consumer behavior, video is now the primary form of media used within any content strategy, taking center stage for the second year in a row.
As video consumption is now such an integral part of a consumer’s journey, HubSpot Senior Copywriter and Brand Campaigns Manager Alicia Collins and Senior Motion Designer Megan Conley say, “This [consumer behavior] also indicates that video can be used throughout all parts of the flywheel…businesses have historically used it as a means of introducing their brand and product or service offerings. But that’s not the case anymore.”
The videos you decide to create and the places you choose to share it can depend entirely on your individual business needs. Some businesses are opting for shorter form videos on TikTok to raise brand awareness, as National Geographic has done in the video below.
Wistia found that long-form video is becoming more popular, making way for extended video length, as Patagonia has done in the video below.
2. Leveraging multimedia whenever possible.
In addition to video, it’s an increasingly popular strategy to incorporate multimedia into content whenever possible. Jason Lapp, President and COO of Beautiful.ai, says, “Video and photo-heavy social platforms have narrowed attention spans globally, forcing marketers to come up with new ways to break up text and increase content comprehension.”
Lapp adds, “Inserting multimedia — such as video clips and interactive slides — into text-heavy content will become a more popular way of engaging audiences and allowing readers to process material more easily.”
The gif below is an example of a blog post that has used an interactive video to further explain instructions given in the text.
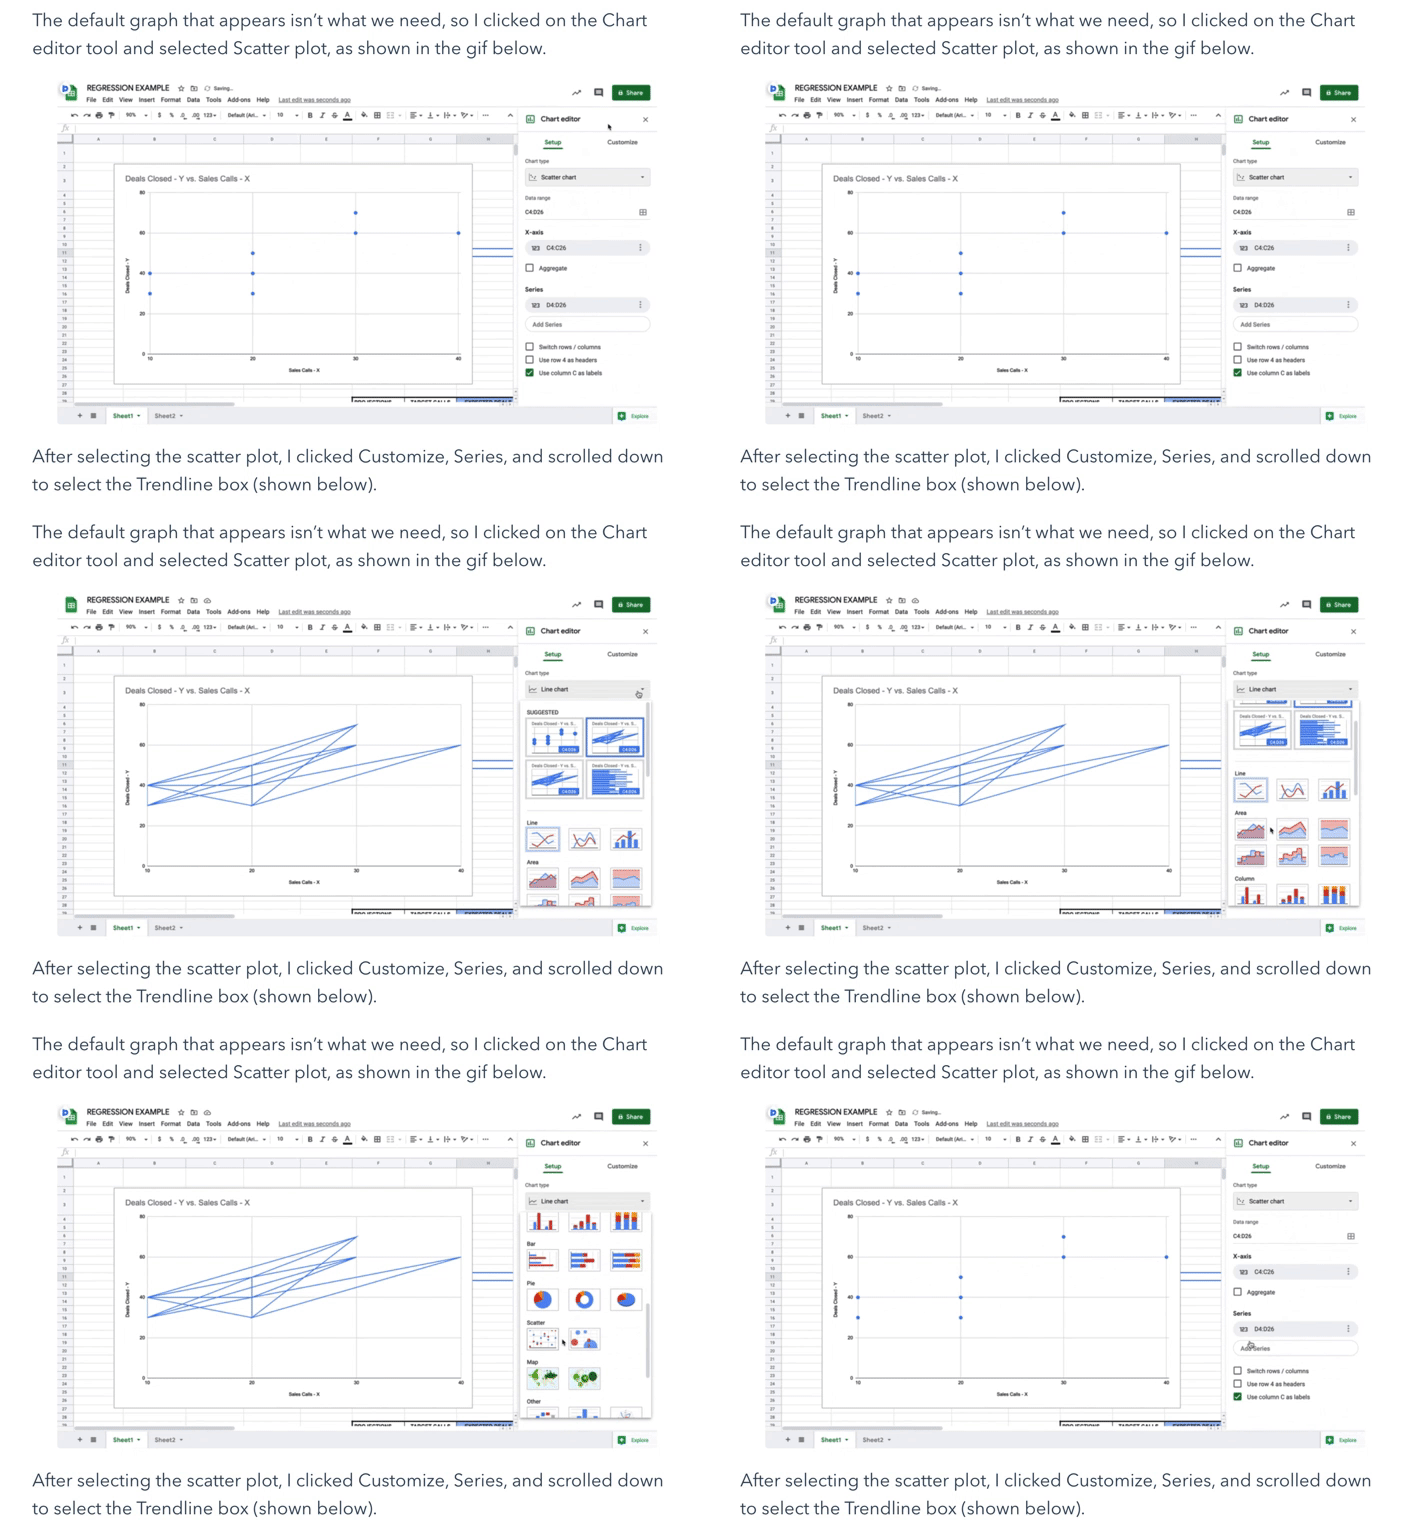
3. Strategic SEO tactics.
In 2020, HubSpot VP of Marketing Matthew Howells-Barby said he wanted to see the number of marketers actively investing in SEO go up. His wish came true — 69% of marketers in 2021 report investing in SEO, up 5% just from 2020.
Marketers are making these investments to create tailored experiences for website users. However, the shift in 2021 is less about SEO optimization in general but instead focused on “Capturing niche and long-tail keywords and creating content that’s more engaging than all the ‘Ultimate Guides,’ and ‘Top 55,’ lists,” says Brooklin Nash, head of content at Sales Hacker.
Businesses are looking for a way to simply appear in SERPs and create in-depth content that is unique, valuable, and different from what competitors offer on those same result pages. 71% of marketers support Nash’s assertion, reporting that their business’ 2021 tactic for SEO is capturing strategic keywords.
4. Podcasting will grow immensely.
A content marketing trend to watch in 2021 is the rise of podcasts. Consider the following statistics:
- In October 2020, there were 34 million podcast episodes and over 1.5 million active shows.
- In under three years, podcast listening in the United States has increased by more than 60%.
- Big-name companies like Apple and Spotify are increasing their investments in podcasts and audio platforms.
- The podcast market is expected to reach more than 2 billion by 2023, meaning that marketers are preparing to devote significant time and money to the channel.
So, why are podcasts so popular with consumers? Firstly, there is something for everyone. With 72,000 new episodes per day (as shown in the graph below), the likelihood of finding an episode that appeals to their interests is incredibly high, whether it’s a mystery tale or a real-life story about how their favorite business was built.
Second, podcasts feel like a conversation between the hosts and the listener. Rather than being talked at, listeners feel they’re being talked to and walked through the content in a more natural, human manner.
Businesses are investing in podcasts because they bring significant benefits: “Podcasts have the ability to drive real results and pay off in terms of leads and revenue,” says Zachary Bellinger, CRO at Casted. In fact, 53% of podcast listeners actually enjoy hearing ads during their listening experience, and 61% of consumers who hear these ads on a podcast were more likely to purchase a featured product, helping drive business revenue.
Holly Shannon, Producer and Host of the Culture Factor 2.0, says that podcasting is also a great way to use content to establish your business as a source of industry authority: “It can highlight you and your team as thought leaders. This allows you to speak authentically and bring your value to the table for all to hear globally.”
Featured Resource: How to Start a Podcast for Your Business
Learn everything you need to create, record, launch, and promote your podcast.
.jpg?width=351&name=podc%20(1).jpg)
5. Content personalization.
Craig Davis, Former Chief Creative Officer at J. Walter Thompson, says, “We need to stop interrupting what people are interested in and be what people are interested in.”
A focus for marketers in 2021 is sharing content with consumers that is contextually relevant to their interests and shown to them at the right time. This means that you study your audience’s likes, needs, and desires and share content that you know will speak to them. In turn, you’ll build brand loyalty, drive conversions, and generate revenue.
An example of leveraging this trend is studying user behavior on your website. If you notice that a browser lingers on specific product pages and places an item in their cart, lead them to those pages or products the next time they visit your site.
6. Valuable content trumps the quantity of content.
As businesses pivoted to entirely digital experiences in 2020, it became more important than ever to provide valuable content to consumers. This trend arises because, as consumers spent more and more time online, they see everything. If you post three Instagram stories per day and your competitors only posted one, what does it matter if your content didn’t provide your audience with any sort of value?
“Never before has ensuring your audience obtains true value from your brand meant so much,” says Kelly Hendrickson, Social Media Marketing Manager at HubSpot. For example, suppose your content marketing strategy focuses on your social media channels. In that case, you worry less about posting multiple times per day but instead about ensuring that the content you do share provides genuine value to your customers.
Lab Muffin Beauty Science, Michelle Wong’s YouTube channel, follows this strategy. She only posts once per week, and when she does, the videos are long-form, valuable pieces of content that teach her audience about something relevant to their interests.
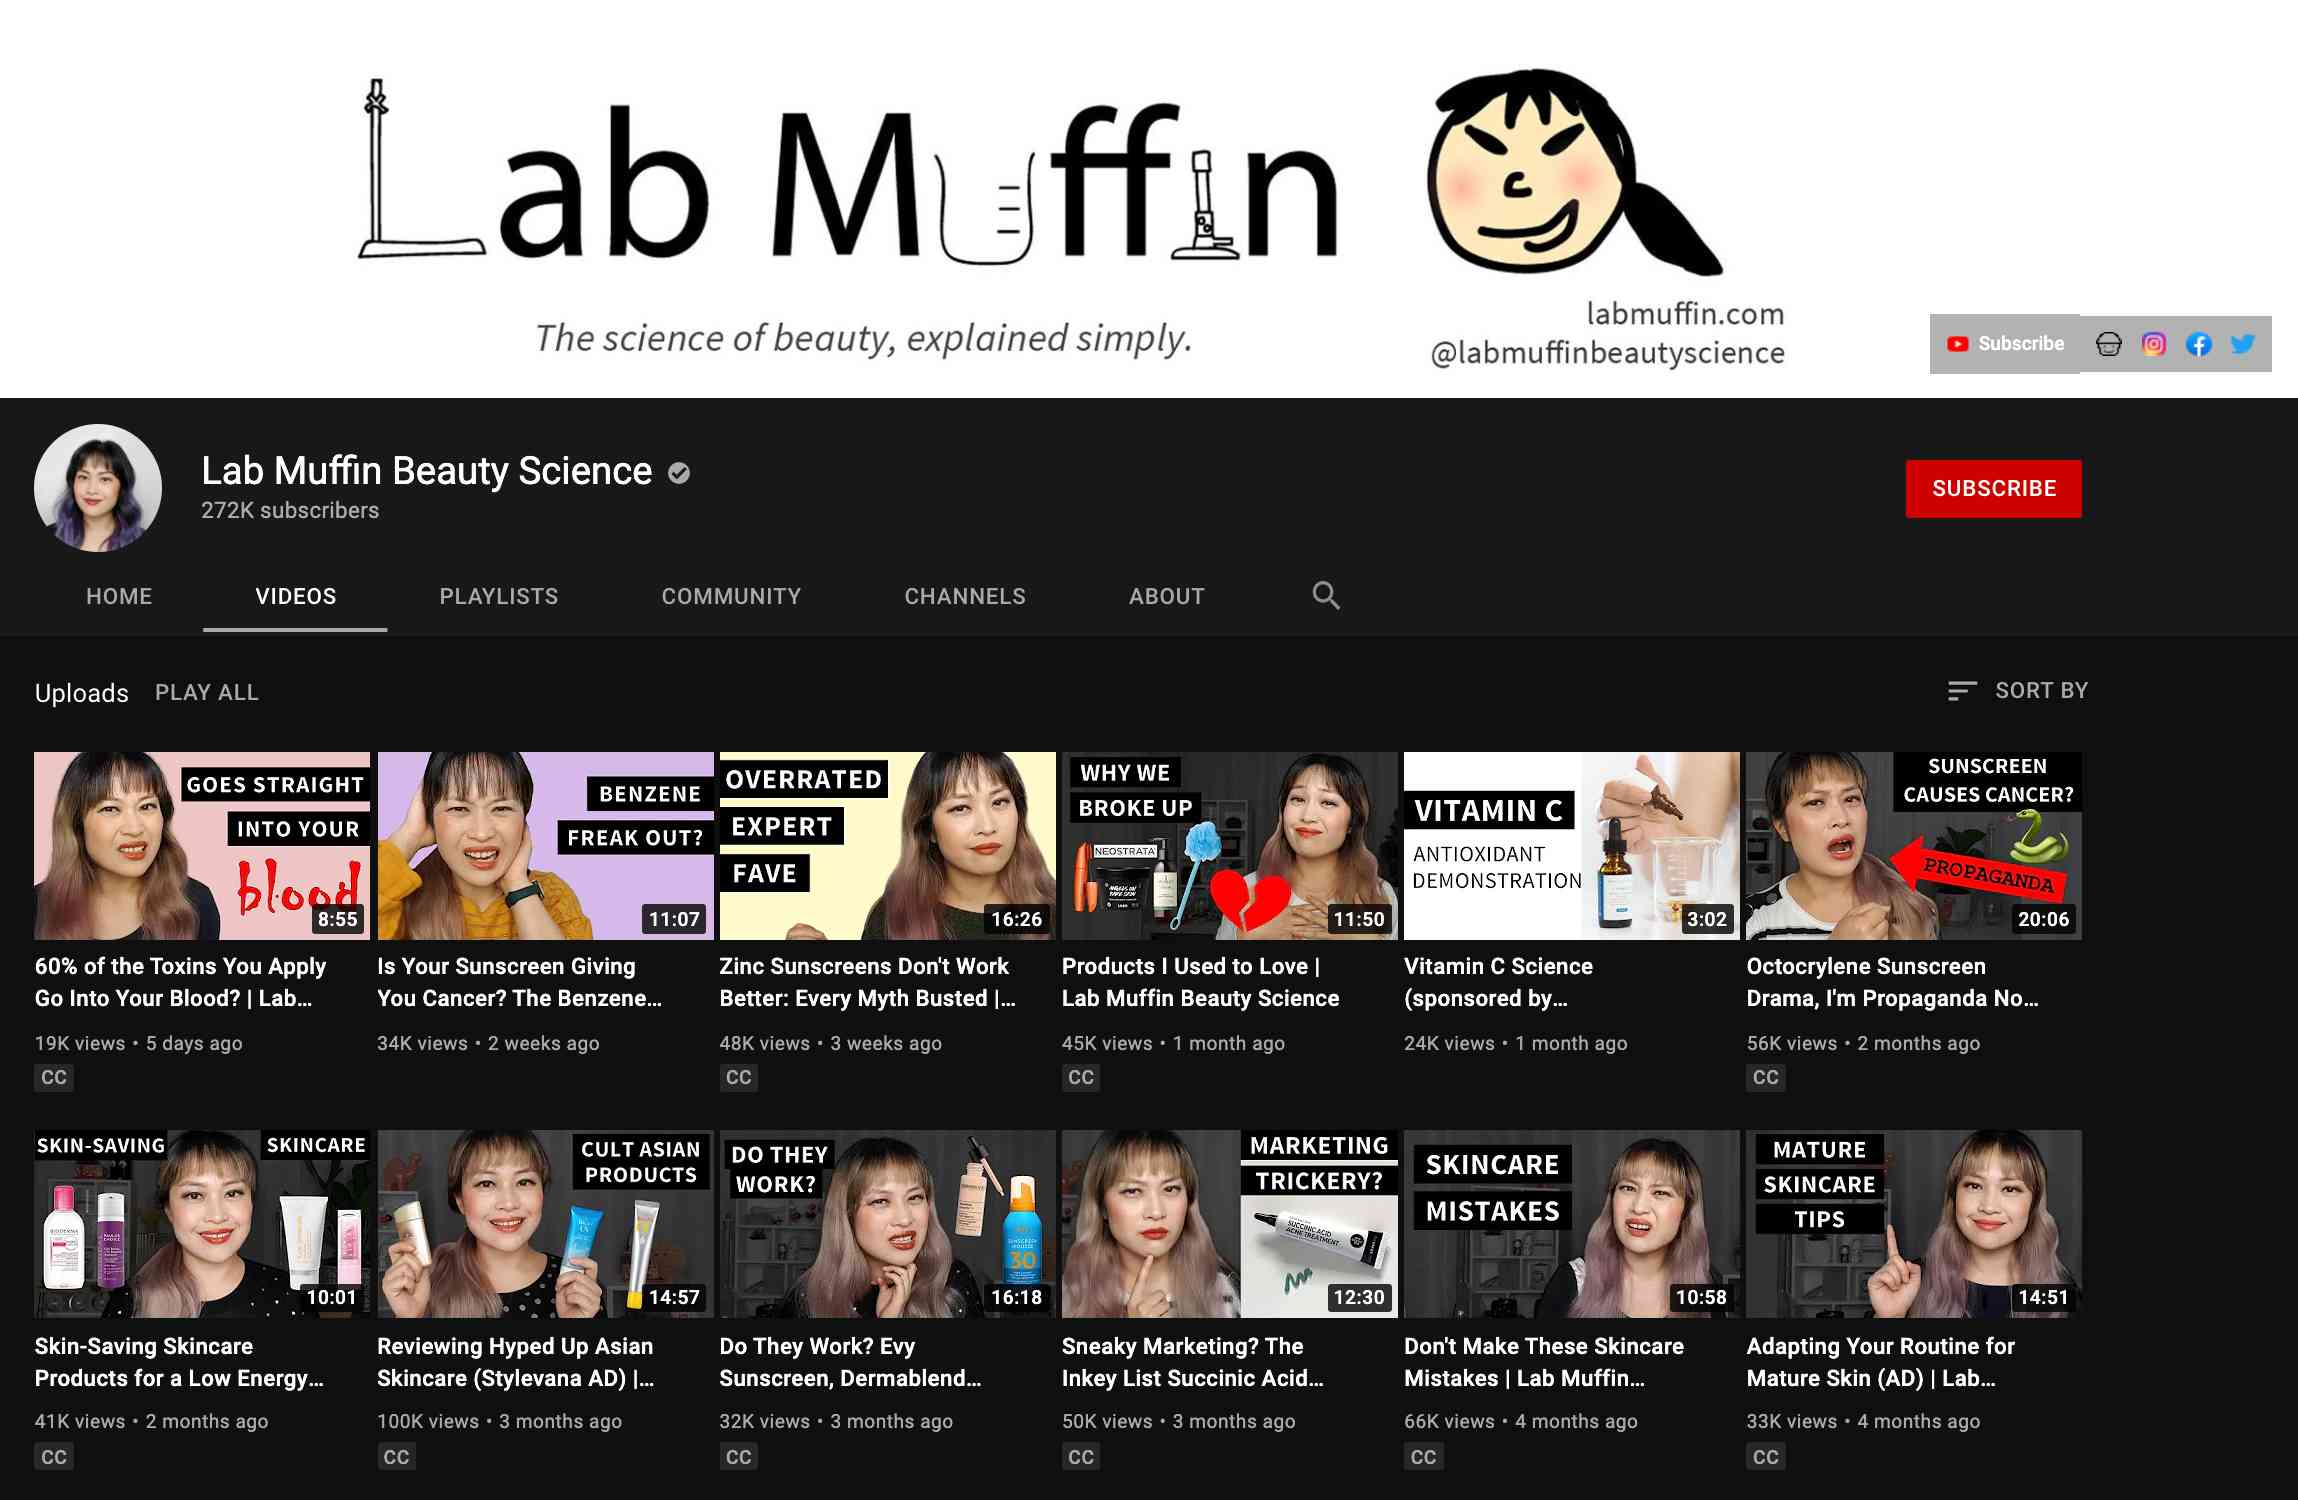
7. Hosting virtual events and webinars.
A webinar is a video presentation, seminar, lecture, or workshop delivered to an audience digitally. Despite once being declared outdated, webinars have become extremely popular over the past year, again credited to COVID-19 health and safety regulations:
- Webinar platform BrightTalk reported a 76% increase in virtual events between March and June of 2020
- ON24 saw a 167% YoY increase in usage of their webinar tool.
Attending events digitally allowed consumers to continue to interact with their favorite businesses and continue to derive value from presenters and industry leaders. As safety restrictions are lifted, webinars and virtual events are still here to stay — the global webinar market is expected to reach 800 million by 2023, up 253 million from 2015.
The new ‘work from home’ model makes this possible because of the convenience of attending an event from wherever a consumer is located. Plus, the added bonus of being able to access content on-demand if they are recorded and shared.
HubSpot’s yearly INBOUND conference is usually an in-person event, but it has been virtual for the past two years. Although health and safety restrictions in the United States are being rolled back, this event will still be a fulfilling, three-day virtual immersive experience.

8. Repurposing existing high-value content.
As mentioned above, COVID-19 has pushed marketers towards prioritizing providing valuable content over anything, and repurposing content is a way to do so.
Nash says, “I’m most excited to see how content teams repurpose content instead of starting from scratch. In 2021, content teams will start figuring out how to most effectively use content from webinars, round tables, podcasts and conferences to stoke the content bonfire…We don’t have to reinvent the wheel, just get it turning faster.”
Repurposing content is re-using your existing content and presenting it in a new format. Essentially, since you’ve already created high-quality, valuable content that you know your audience enjoys, you expand its reach.
You can repurpose content in various ways, like creating a slide presentation from a top-performing blog post, sharing screenshots of reviews from product pages on your Instagram profile, or creating text transcripts of your podcast episodes.
Holly Shannon is a fan of repurposing podcasts because transcripts can be used as SEO-optimized blog posts, and audio clips can be used as subsequent social media posts. Glowing Up Podcast has done something similar to Shannon’s suggestion, and they’ve repurposed their podcast by taking video of their recording session and sharing the clip on their Instagram page.
Stay Up-to-date On Your Industry
It’s always important to stay up-to-date on what is happening in your industry, and being aware of these trends is a way to do so. Should you choose to leverage one of these trends in your marketing strategy, ensure that it’s relevant to your business needs and will help you achieve your goals.
If you want to learn more about the marketing industry, read this post about general marketing trends in 2021.

16 of the Best Meeting Scheduler Tools to Organize Your Day
We complain about spending countless hours in unproductive and mismanaged meetings.
But the greater crime is all the wasted time we spend scheduling the meeting.

The endless back-and-forth communication and steps — reviewing calendars, determining the best place to meet, setting up a call-in number, adding the meeting to the calendar, inviting all the necessary attendees, and so on. To put it simply, the process makes the meeting a hassle before it even starts.
Best Way to Schedule Meetings
That’s where meeting scheduling software comes into play — this is the more efficient way to optimize your time when scheduling meetings (and the time of everyone who’s invited).
These tools have a variety of functions such as agenda scheduling automation, reminders and notifications, and integrations to connect your scheduling software to your other business tools (such as your CRM and sales software). So, let’s take a look at some of the best meeting scheduler software available today.
Best Meeting Scheduler
Whether you’re trying to find the perfect window of time to catch up with your busy team, or looking for the best way to coordinate with your clients, these meeting scheduler tools have you covered.
1.HubSpot Free Appointment & Meeting Scheduler
Price: Free, $0/month (Free), $45/month (Starter), $450/month (Professional), $1,200/month (Enterprise) for Service Hub or Sales Hub
HubSpot’s Free Appointment & Meeting Scheduler allows your prospects to book one-on-one and group meetings with you automatically to avoid the time-consuming back-and-forth that comes with determining someone’s availability.
Prospects can see your calendar and availability, and simply select a meeting time that works for them. You’ll be notified of their selection and it’ll automatically be added to your calendar. If there are any relevant data about the contact you’re having a meeting with, that’ll be surfaced for you, since the tool is integrated with your all-in-one CRM.
HubSpot works with Google Calendar and Office 365 Calendar and is available free forever or with a paid Sales Hub or Service Hub plan.
2. Arrangr
Price: Free, $3.99/mo (Pro), $6.99/mo (Pro+)
Arrangr handles the meeting scheduling process from beginning to end by reserving tentative meeting times and also releasing slots that don’t get taken.
It integrates with calendars and CRMs, and it has the capability of scheduling group events. The most unique thing, though, is its ability to suggest the perfect meeting location for all parties based on criteria you provide around your preferences (e.g. where to go for a coffee chat versus lunch meeting).
3. Demodesk
Price: $25/mo (Basic), $45/mo (Pro), custom pricing (Business or Enterprise)
Demodesk is an all-in-one meeting scheduler and assistant designed specifically for sales demo scheduling. Not only do you get custom booking pages, calendar syncing, and meeting analytics, but you can also take advantage of its advanced screen sharing and virtual display options. It also has native integrations with many tools including CRM platforms.
4. Rallly
Price: Free
Rallly lets you create a simple, straightforward poll where attendees can vote on a day for an event that works best for them. It also includes an open comment section on the meeting page so attendees can plan the meeting agenda or discuss details before the event.
5. Calendar
Price: Contact Calendar for a quote.
Calendar is a free service that integrates Google and Apple calendars. The app offers two ways to schedule meetings. With the “outbound” method, hosts indicate their own availability, list the attendees they’d like to come to a meeting, and use the Calendar software to send out an email to collect everyone’s preferred times.
After Calendar determines the ideal time for everyone to meet, the app schedules the meeting for you. With the “inbound” method, Calendar gives you a personal URL where users can check your availability and request times to meet with you.
6. NeedToMeet
Price: Free, $12/yr/user (Advanced), $19/yr/user (Premium)
NeedToMeet doesn’t require you to sign up for an account to use their service. Simply enter a brief description of your meeting’s purpose, block off your availability on a calendar, and send the link to attendees. The free version doesn’t sync with your calendar, but they do offer a premium subscription that integrates with Outlook.
This tool differs from services like Rally and Doodle because it allows attendees to indicate their preferred date and times, rather than only choosing from a list of dates and times set by the meeting host.
7. YouCanBook.me

Price: $10/calendar/mo
If you find yourself struggling to make your availability known to clients, try out YouCanBook.me. This tool offers users a custom URL where users can view free spots on your Google Calendar or iCloud Calendar and book time with you. It also allows you to customize your booking page with different layouts, colors, and your company’s logo.
8. Pick
Price: $9/mo
Pick automatically scans everyone’s Gmail calendars to find open slots and delivers a list of mutually available times. You can then send a calendar invite to all attendees directly from the app. Something to note is that all members of your team need to be on Pick in order to share their availability. The app also provides users with an individual URL so you can share your availability with people requesting a meeting.
9. Doodle
Price: $6.95/mo (Pro), $8.95/mo (Team), contact for a quote (Enterprise)
With Doodle, select a list of potential dates and times for your meeting and then poll your attendees to see which option works best for them. You don’t have to sign up for a Doodle account to participate in a poll. You can also create a public Doodle URL, where individuals can request a meeting with you based on your listed availability.
10. Calendly

Price: Free, $8/mo (Premium), $12/mo (Pro), contact for a quote (Enterprise)
Calendly integrates directly with your Google or Office 365 calendar and gives you a personalized URL where people can view your availability and schedule their meetings with you. To help you stay organized, the app lets you set up custom meeting types and durations (e.g., 30 Minute Check-In or 60 Minute Project Review).
Add custom questions to the form people use to sign up to meet with you, include a link to a document or web page people should review prior to your meeting, and make events private when necessary.
11. Clara
Price: $99/mo (Essential), $199/mo (Professional), $399/mo (Executive)
Meet Clara, a virtual assistant fueled by machine learning that can schedule all your meetings and get acquainted with your scheduling patterns. Once you sign up, you indicate your preferences regarding the days and times that you’re available for meetings as well as your favorite locations for those meetings (e.g. for lunch, coffee, etc.).
If someone requests a meeting, you can CC Clara’s email address (which can be customized to your company’s domain), and the virtual assistant will determine a time, date, duration, participants, and location for the meeting so you don’t have to. She also understands human commands like, “I’m sick so can you reschedule my meetings on Tuesday?”
12.Google Calendar
Price: Free
If your team already uses the GSuite (e.g. Gmail) and would like to streamline scheduling processes by using the same platform for your calendars and schedules too, use Google Calendar.
If your work email is already part of a GSuite membership, you can go to your calendar, search for another team member under the “Meet with” tab on your left, and then click their name to view their calendar up against your own. If you click on a time slot on that calendar, you can schedule a meeting with both yourself and that teammate.
If your teammates aren’t part of your GSuite, press the “Share” button to share your calendar with their email addresses. From there, they can enter the calendar and schedule a meeting time with you.
13. Zoom
Price: Free, $149.90 /yr/license (Pro), $199.90 /yr/license (Business), $240/yr/license (Enterprise)
Zoom is one of the most popular video conferencing platforms, but it also includes tools to make the process of scheduling one a lot easier.
Choose to add the meeting to your calendar (which may send an invite to the recipient for you) or copy and paste the invite to an email. In addition, two of the Zoom Meetings features are recording and transcripts.
14. Chili Piper

Price: $30/user/mo (User License), $150/mo (Spicy), $400/mo (Hot), $1,000 (Inferno)
Chili Pepper is a scheduling software for B2B revenue teams — it offers one-click scheduling from any email as well as seamless handoff scheduling between your reps. The tool books meetings for your customers with one click and it automatically updates your CRM so your contact data is centrally located and up-to-date.
It also optimizes your calendar and helps increase productivity by setting meeting reminders, handling no-show attendees, creating meeting buffers, reserving time slots on your calendar as needed, and allowing for straightforward meeting rescheduling.
15. Setmore
Price: Free, $9/1-2users/mo (Premium), $5/3+users/mo (Pro)
Setmore is automated online booking software that handles 24/7 scheduling, reminders, and payments. You can brand your bookings and schedule to make for a professional feel — this includes personalized page URLs, logos, fonts, and colors.
The tool makes hosting virtual meetings easy since it integrates with Zoom and Teleport, and you can include your calendar link on your website and social profiles such as Facebook and Instagram.
16. CalendarHero
Price: Free, $8/mo (Professional), $12/mo (Team)
CalendarHero is an online meeting scheduling software that automates the meeting scheduling process for you. Simply add your video chat provider (e.g. Zoom, Google Meet, Microsoft Teams Video) and get started scheduling and hosting virtual meetings.
Attendee insights and meeting briefings are available after your calls — that data can then be added to your integrated sales software or CRM. You can also automate meeting tasks by integrating CalendarHero with software like Slack and HubSpot to make the process of adding, referring to, and updating contact records, files, and simpler.
How to Schedule a Meeting With HubSpot’s Meeting Tool
As mentioned above, HubSpot’s Free Appointment & Meeting Scheduler makes the process of scheduling meetings and managing associated contact data easy — below we’ll review the steps involved in scheduling a meeting with HubSpot so you can see one of these scheduler tools in action.
1. Sign up for HubSpot.
You can use HubSpot’s meeting scheduler if you’re a free or paid Sales Hub or Service Hub user.
2. Click the Meetings link under the Sales tab.
This will take you to the back end of the Meetings tool where you can create your own meeting link.
3. Click the “Create meeting link” button in the top right corner.
You may see the option to choose Personal or Team. If it’s just you that’s requesting the meeting, choose Personal.
4. Fill out your meeting details.
HubSpot asks for the headline (which will show up on your Meetings Tool), name, what you want your link URL to be, and more details.
5. Configure your meeting in HubSpot.
There are also additional fields for optional details to be included in the invite, such as subject and description that will be sent to attendees.
6. Designate your availability.
This is the key feature that eliminates the back and forth. By designating when you can meet, this will display only those times for the recipient to choose from.
7. Add form questions for qualification.
If you’re in sales and have your Meetings Tool visible to anyone, you may want to only allow qualified prospects to book with you. This section requires a few fields to give you more insight.
8. Click “Save changes” and check your work.
Once you click this button, you’ll see a popup that includes your page link and the embed code.
Copy and paste the booking link into your browser and check to see if your Meetings Tool has this meeting configured the way you want it.
Start Scheduling Your Meetings
Start saving time and using meeting scheduler software — this will ensure everyone efficiently agrees to meeting dates and times, eliminating unnecessary and time-consuming back-and-forth communication.

Editor’s Note: This post was originally published in July 2015 and has been updated for freshness, accuracy, and comprehensiveness.

Image Alt Text: What It Is, How to Write It, and Why It Matters to SEO
If you spend time optimizing your blog or website’s content, headers, subheaders, and meta descriptions for search engines, the following image should alarm you:
The screenshot above is the first search engine results page (SERP) Google produces for the search term, “excel table examples.” Notice how, in addition to the “Images” tab at the top, Google pulls in a substantial pack of clickable images to the beginning of the main results page — before any organic text results are even visible.
Today, nearly 38% of Google’s SERPs show images — and that’s likely to increase. That means, despite your best SEO efforts, you could still be missing out on another source of organic traffic: your website’s images. How do you get in on this traffic source? Image alt text.

Whether or not you perform SEO for your business, optimizing your website’s image alt text is your ticket to creating a better user experience for your visitors, no matter how they first found you.
How to Add Alt Text to Your Images
In most content management systems (CMSs), clicking on an image in the body of a blog post produces an image optimization or rich text module, where you can create and change the image’s alt text.
Let’s walk through what the next steps are for CMS Hub and WordPress below.
How to Add Alt Text in the HubSpot CMS
In HubSpot, once you’ve clicked on an image and clicked the edit icon (which looks like a pencil), an image optimization pop-up box will appear.
Here’s what this image optimization window looks like in the CMS inside your HubSpot portal:
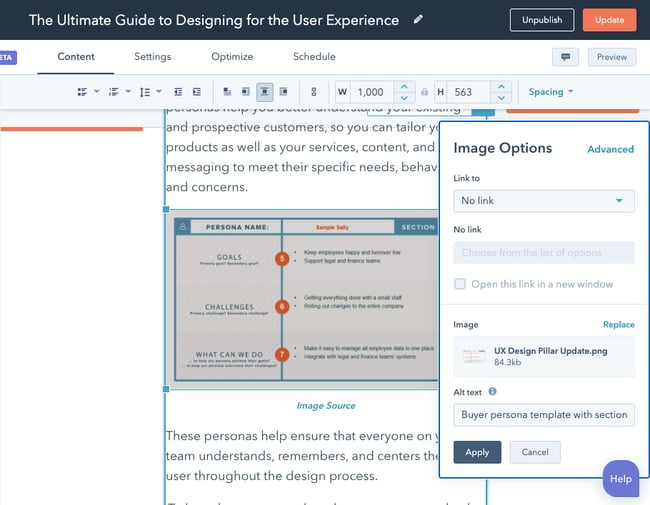
Your alt text is then automatically written into the webpage’s HTML source code, where you can edit the image’s alt text further if your CMS doesn’t have an easily editable alt text window. Here’s what that alt tag might look like in an article’s source code:
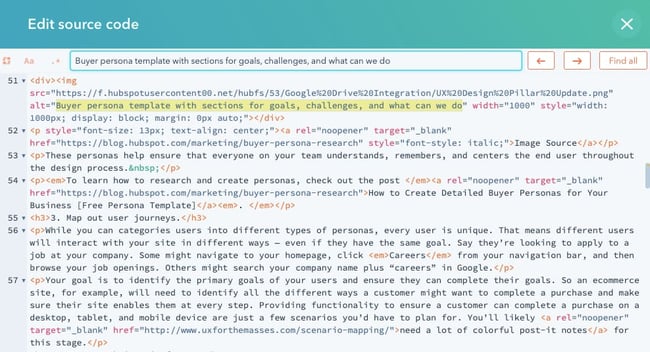
How to Add Alt Text in the WordPress CMS
In WordPress, clicking on an image will automatically open the Block tab in the sidebar. Under the section labelled “Image Settings,”add the alt text in the empty field.
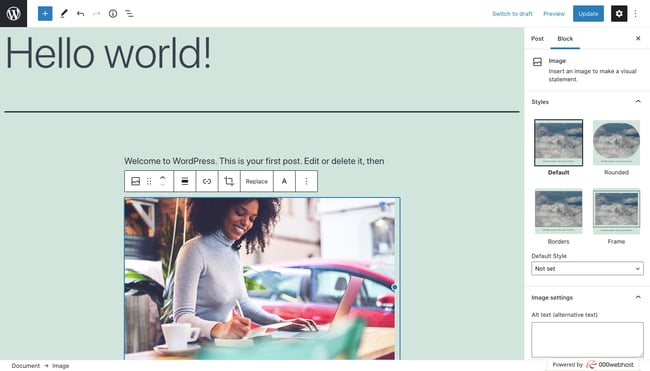
When you’re ready, click Update from the toolbar at the top of your screen.
The most important rule of alt text? Be descriptive and specific. Keep in mind, however, that this alt text rule can lose its value if your alt text doesn’t also consider the image’s context. Alt text can miss the mark in three different ways. Consider the examples below.
3 Image Alt Text Examples (the Good and the Bad)
1. Keyword vs. Detail

Bad Alt Text
alt="HubSpot office wall Singapore inbound marketing workplace murals orange walls ship it"
What’s wrong with the line of alt text above? Too many references to HubSpot. Using alt text to stuff keywords into fragmented sentences adds too much fluff to the image and not enough context. Those keywords might be important to the publisher, but not to web crawlers.
In fact, the alt text above makes it hard for Google to understand how the image relates to the rest of the webpage or article it’s published on, preventing the image from ranking for the related longtail keywords that have higher levels of interest behind them.
Worst still, if you stuff too many keywords, then you may incur a Google penalty.
Good Alt Text
With the bad alt text (above) in mind, better alt text for this image might be:
alt="Orange mural that says 'ship it' on a wall at HubSpot's Singapore office"
2. Detail vs. Specificity

Image via Winslow Townson
Bad Alt Text
alt="Baseball player hitting a ball at a baseball field"
The line of alt text above technically follows the first rule of alt text — be descriptive — but it’s not being descriptive in the right way. Yes, the image above shows a baseball field and a player hitting a baseball. But this is also a picture of Fenway Park — and the Red Sox’s #34 David Ortiz clocking one over right field. These are important specifics Google would need to properly index the image if it’s on, say, a blog post about Boston sports.
Good Alt Text
With the bad alt text (above) in mind, better alt text for this image might be:
alt="David Ortiz of the Boston Red Sox batting from home plate at Fenway Park"
3. Specificity vs. Context

Image via UCLA
Both images above have clear context that can help us write good alt text — one is from a HubSpot office, and the other is Fenway Park. But what if your image doesn’t have official context (like a place name) by which to describe it?
This is where you’ll need to use the topic of the article or webpage to which you’re publishing the image. Here are some bad and good examples of alt text based on the reason you’re publishing it:
For an Article About Attending Business School
Bad Alt Text
alt="Woman pointing to a person's computer screen"
The line of alt text above would normally pass as decent alt text, but given that our goal is to publish this image with an article about going to business school, we’re missing out on some key word choices that could help Google associate the image with certain sections of the article.
Good Alt Text
With the bad alt text (above) in mind, better alt text for this image might be:
alt="Business school professor pointing to a student's computer screen"
For a Webpage on Education Software for Business School Teachers
Bad Alt Text
alt="Teacher pointing to a student's computer screen"
The line of alt text above is almost as descriptive and specific as the good alt text from the previous example, so why doesn’t it suffice for a webpage about education software? This example dives even deeper into the topic of business school, and specifies that the ideal audience for this webpage is teachers. Therefore, the image’s alt text needs to reflect that.
Good Alt Text
With the bad alt text (above) in mind, better alt text for this image might be:
alt="Professor using education software to instruct a business school student"
Image Alt Text Best Practices
Ultimately, image alt text needs to be specific but also representative of the topic of the webpage it’s supporting. Get the idea so far? Here are a few important keys to writing effective image alt text:
- Describe the image, and be specific. Use both the image’s subject and context to guide you.
- Add context that relates to the topic of the page. If the image doesn’t feature a recognizable place or person, then add context based on the content of the page. For example, the alt text for a stock image of a person typing on a computer could be “Woman optimizing WordPress website for SEO” or “Woman researching free blogging platforms,” depending on the topic of the webpage.
- Keep your alt text fewer than 125 characters. Screen-reading tools typically stop reading alt text at this point, cutting off long-winded alt text at awkward moments when verbalizing this description for the visually impaired.
- Don’t start alt text with “picture of…” or “Image of…” Jump right into the image’s description. Screen-reading tools (and Google, for that matter) will identify it as an image from the article’s HTML source code.
- Use your keywords, but sparingly. Only include your article’s target keyword if it’s easily included in your alt text. If not, consider semantic keywords, or just the most important terms within a longtail keyword. For example, if your article’s head keyword is “how to generate leads,” you might use “lead generation” in your alt text, since “how to” might be difficult to include in image alt text naturally.
- Don’t cram your keyword into every single image’s alt text. If your blog post contains a series of body images, include your keyword in at least one of those images. Identify the image you think is most representative of your topic, and assign it your keyword. Stick to more aesthetic descriptions in the surrounding media.
- Review for spelling errors. Misspelled words in image alt text could hurt the user experience or confuse search engines crawling your site. You should review alt text like you would any other content on the page.
- Don’t add alt text to every image. You should add alt text to most images on a webpage for the sake of SEO, UX, and accessibility — however, there are exceptions. Images that are purely decorative or are described in text nearby, for example, should have an empty alt attribute. For a more detailed breakdown of when to add alt text and when to not, check out this decision tree.
How Alt Text Affects SEO
According to Google, alt text is used — in combination along with computer vision algorithms and the contents of the page — to understand the subject matter of images.
Alt text therefore helps Google to better understand not only what the images are about, but what the webpage as a whole is about. This can help increase the chances of your images appearing in image search results.
When creating content on a topic, consider how your audience might prefer to find answers to their questions on that topic. In many cases, Google searchers don’t want the classic blue, hyperlinked search result — they want the image itself, embedded inside your webpage.
For example, a visitor looking up how to remove duplicates in excel might prefer a screenshot so they can understand how to complete the task at a glance.
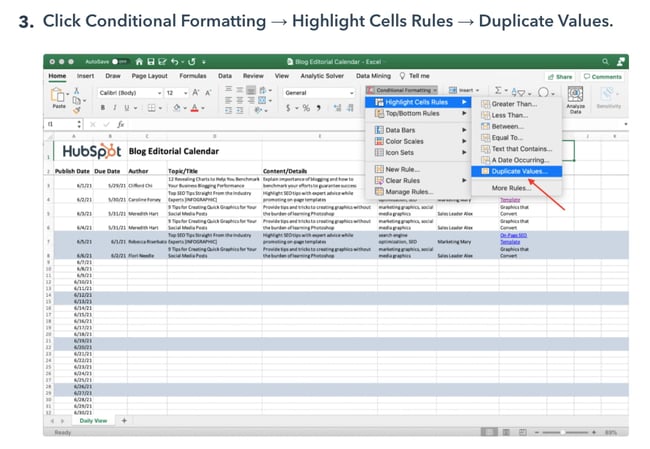
Because this image has optimized alt text, it appears in image search results for the longtail keyword “how to remove duplicates in excel.” Since the post also appears in the web search results for the same keyword, visitors could land on the blog post through these two different channels.
Why is image alt text important?
We’ve already alluded to several reasons why image alt text is important: namely, accessibility, user experience, and image traffic. Understanding these reasons will help you write the best alt text possible for your images. Below we’ll take a closer look at the major reasons image alt text is important.
Accessibility
Back in 1999, W3C published its Web Content Accessibility Guidelines 1.0 in order to explain how to make content more accessible for users with disabilities. One of these guidelines was to “Provide equivalent alternatives to auditory and visual content.” That meant any webpages including images (or movies, sounds, applets, etc.) should include equivalent information to its visual or auditory content.
For example, say a web page contains an image of an upward arrow that links to a table of contents. A text equivalent might be “Go to table of contents.” This would allow a user with a screen reader or other assistive technology to understand the purpose of the image without seeing it.
In other words, alt text helps ensure your visual content is accessible to all users, including those with visual impairments.
User Experience
Alt text not only provides a better user experience to users with disabilities — it provides a better UX to all users. Say, a visitor has a low-bandwidth connection so the images on your webpage aren’t loading. Instead of just seeing a broken link icon, they’ll also see the alt text. This will allow them to glean what the image was meant to convey.
For example, a user might be able to see the image on the left. If they can’t — due to a disability, bandwidth issue, or another reason — then they will hear or see the alt text on the right. This will help provide a better user experience than if there were no alt text.

Image Traffic
One of the most important things image alt text can do for you is turn your images into hyperlinked search results that appear either in Google Images or as image packs. Image packs are special results displayed as a horizontal row of image links that can appear in any organic position (including the #1 spot on a SERP, as seen in the example in the intro).
Images that appear in either Google Images or image packs provide yet another way to receive organic visitors. This can result in thousands of more visitors — at least it did in HubSpot’s case.
Beginning in 2018, the HubSpot Blog team implemented a new SEO strategy that, in part, focused more intently on optimizing image alt text. This helped to increase the blog’s image traffic by 779% in less than a year, which resulted in 160,000 more organic views. You can read more about the team’s success in this blog post.
Adding Image Alt Text to Your Website
So, where do you start when developing alt text for your blog posts and webpages? Consider performing a basic audit of your existing content to see where you can incorporate alt text into previously untagged pictures. Watch to see how your organic traffic changes among the pages that you give new alt tags.
The more images you optimize, the better your SEO strategy will be moving forward.
Editor’s note: This post was originally published in September 2018 and has been updated for comprehensiveness.


5 Ways to Add a Personal Touch to Your Sales Email
In a lot of ways, technology has made it easier to reach potential customers. Automated email marketing allows you to speak to an entire database of contacts with just the touch of a button. And while email has proven to be significantly more efficient at converting customers than social media, your potential customers’ inboxes are getting fuller every day.
![Download Now: 25 Proven Sales Email Templates [Free Access]](https://no-cache.hubspot.com/cta/default/53/be67aa79-8dbe-4938-8256-fdf195247a9c.png)
We’ve reached the point where most consumers can smell a sales email a mile away and will delete it within seconds. They expect that if they open it, they’ll be subjected to blanket messaging, “talking at you” verbiage, and generic content. Usually, they’re right. One-size-fits-all emails are not helping your business, and they may actually be hurting it.
As a salesperson, you understand that getting to know your customers and building relationships with them is still the best way to close a deal. While more and more relationships are being forged from behind a screen, the need to create a connection is more important than ever. The question becomes, how can you leverage the power of technology and build a relationship with your customer?
Adding a personal touch to your emails will set you apart from your competitors and help you stand out in a sea of sameness. A few minutes of research and personalization can create an entirely new playing field for you. There are a number of ways to achieve this with your sales emails, but before we discuss those, let’s get into some of the benefits of adding a personal touch.
Benefits of Personalization
Imagine if you walked into a car dealership and were greeted by a robot who referred to you as “Dear Customer” and determined which car was best for you (and everyone else) before asking you what you were looking for. You’d probably run — not walk — out of that dealership.
Yet, we do that every day with generic sales emails.
Adding a personal touch to your emails will help you:
Build Rapport
Personalized emails allow you to connect with your potential customers and see them as actual people. That connection will encourage them to do business with you and stay loyal to you.
Build Trust
Consumers want to feel like you understand their pain. A generic email blast, sent out to hundreds or thousands of people, doesn’t target their individual struggles. However, seeing a personalized email that addresses their specific challenges and offers hope of a solution builds their trust in your brand.
Make Customers Feel Like You’re Speaking to Them
Every industry has its own lingo for the problems they solve. Unfortunately, this isn’t necessarily the verbiage that will resonate with a potential customer. Getting to know your consumers better and then using personalization helps you speak directly to them.
Keep Customers Happy
By and large, customers are less receptive to and flat-out irritated by emails that aren’t personalized — and the last thing you want to do in a sales email is irritate your audience. Providing customization and personalization makes consumers happy, so always try to find ways to incorporate those kinds of elements.
Improve Open, Sales, and Conversion Rates
When consumers know that you understand their problems and reliably send relevant content, they come to feel personally connected to your company — a feeling that makes them more inclined to open your emails and, in turn, do business with you.
Ideas for Personalization
There are a number of different approaches when it comes to adding a personal touch to your sales emails. Here are some of the most effective ones.
1. Start with a strong template.
It may sound counterintuitive, but beginning with a template will free up your time to do your research on your potential customers. Remember, this is just a starting point. You’ll be customizing sections and altering words to fit your audience. You can find a variety of sales email templates from Hubspot to help you get started.
2. Send them content they actually want.
Sending your potential (and existing) customers content is an excellent way to stay top-of-mind and establish yourself as a thought leader in your space. However, no one wants to be inundated with information that they don’t find necessary or applicable. Base the content you send off what your customers actually want.
Icebreaker by UpContent is an integration application that allows you to re-engage your prospects when the conversation has died down. By sending them third-party content that has already been curated by your team, you can jumpstart the conversation and continue the relationship. This content is relevant to your organization and to your customer and already approved for distribution.
3. Personalize offers and product recommendations.
It might go without saying, but every customer is unique, and their problems require at least somewhat individualized solutions. As you learn more about your customers, use this information to make personalized recommendations that fit their needs rather than yours.
4. Show appreciation.
Sales emails shouldn’t just be about sales. Once you’ve established a relationship with a customer, you need to cultivate it. Send them a welcome email when they become a customer, celebrate milestones in their life and in your relationship, and wish them a happy birthday. These emails keep you fresh in their minds without being intrusive or annoying.
5. Put an end to cold calling.
There are very few salespeople in the world that actually enjoy making a cold call. Those that do know that you need to create a connection early on by starting a conversation about something other than the product you’re selling.
The same goes for emails. Reaching out to people in your database — even if they’ve signed up for a free offer — is pretty much still cold calling. Co-Pilot is an app that integrates conversation starters such as local weather, local news, and upcoming local holidays into your contact records. This provides you with a starting point to break the ice and personalize your emails to create a better connection.
Whether you utilize the technology available to you or not, real human connection will always be the best sales tactic. Connecting with potential and existing customers will allow you to build rapport, build trust, and make your customers feel appreciated so they keep coming back. Adding a personal touch to your sales emails is easy and essential to creating loyal, happy customers.

Is SMS Marketing Dead? New Research Says Not Just Yet
Whenever I share a screenshot of a friend’s funny text on social media, someone always points out the huge number of unread text messages I have.

“Why do you have so many unread texts? And, who are you ignoring?”, my friends often ask.
The truth is that most of the texts I ignore aren’t from actual people. They’re usually quick marketing messages that I signed up to receive at some point and ended up forgetting about.
Whether you signed up for a mobile service, pharmacy alerts, furniture store promos, or another list, you’ve probably also received a few texts you’ve either deleted, opted out of, or blatantly ignored.
With experiences like those above in mind, you might think that SMS marketing is no longer effective. But, in 2021, as people are more attached to their phones than ever before, we might be wrong about the strength of text message promotions.
As it turns out, a recent study from SimpleTexting shows that text message marketing might still be alive and well.
The study, which surveyed over 1300 consumers and marketers, revealed that more than 76% of brands plan to invest in text-message marketing in the next year, while 62% of consumers subscribed to receive texts from at least one brand in the last year.
Below, we’ll dive into the study’s research, explain why some marketers might still want to consider SMS strategies, and note a few takeaways for an effective campaign.

Why SMS Could Be Coming Back Strong
While members of our blogging team once said SMS needed to be “put out of its misery” due to all the other messaging tactics in the world at the time, no one could have anticipated the changing landscape brought on by COVID-19. During the pandemic, which caused most people to get stuck in their homes, people gravitated to their phones and electronics more than ever, with 76% of consumers reporting increased screentime.
When it came to texting, 61% of consumers either increased or significantly increased the daily time they spent on their text apps.
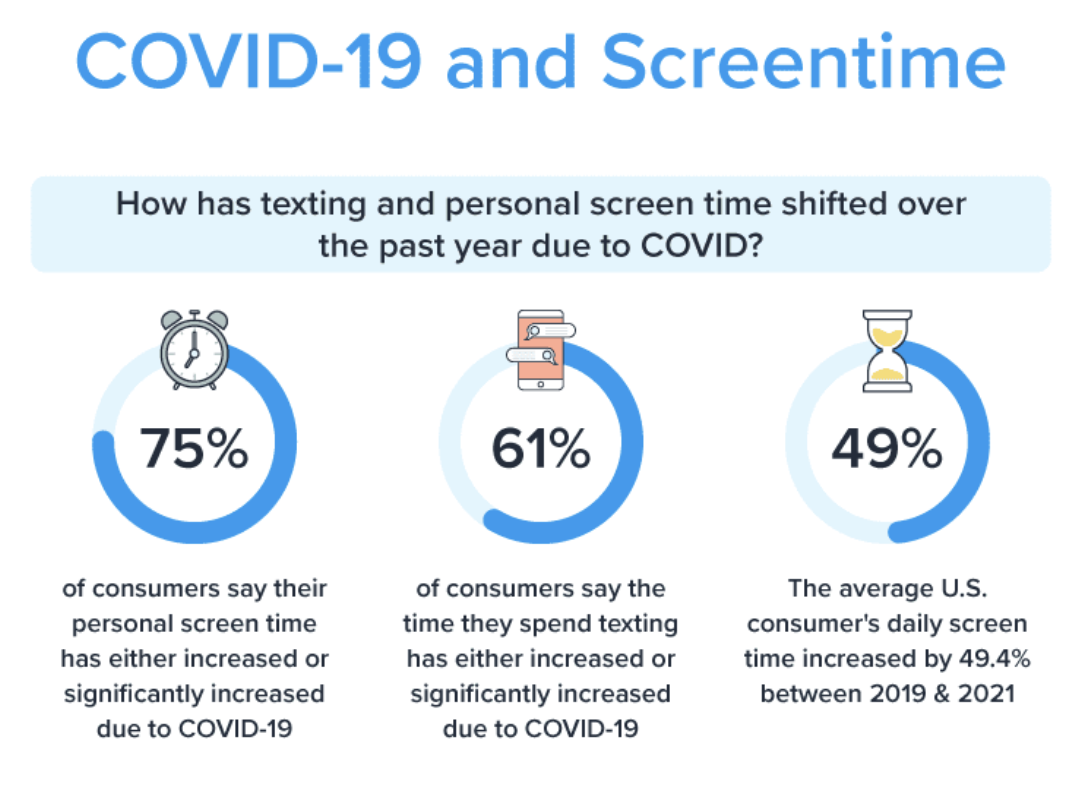
SMS Marketing Effectiveness in 2021
According to SimpleTexting, 62% of consumers have opted into texts from at least one business while 43% of consumers specifically have subscribed to one to three brands.
When it comes to text messaging effectiveness, consumers reply to marketing texts that require a response much faster than email. While most people reply to emails within a half-hour to an hour, 72% of consumers respond to texts within 10 minutes.
Aside from quick response rates, text messages can also receive very high engagement. 43% of surveyed business owners and digital marketers who use SMS marketing report click-through rates between 20% and 35%.
One interesting piece of the SimpleTexting survey reveals that 52% of brands reported increased opt-in rates between 2021. However, nearly 10% reported decreased opt-ins in the same year.
While the increased opt-ins are in line with screen and text-message time increases, the opt-out increases do hint that consumers could be as quick to unsubscribe from text message content as they are to subscribe from it.
The SimpleTexting study and other research points to reasons why people might opt out.
- Too many text messages from one brand: 60% of SimpleTexting respondents say they’ve unsubscribed from SMS alerts from brands that send them too frequently. Furthermore, 56% of those consumers prefer to receive just one text from a brand per week.
- Too many texts from multiple brands: If you do up your text cadence to two, keep in mind that your subscribers might be inundated with tons of texts from other brands as well. While your texts might still be meaningful, you might see more sensitivity to opt-outs simply because subscribers are tired of all the text alerts.
- Meaningless content: Like email marketing, you’ll need to hook your reader and keep them engaged with the content they’ve signed up to receive. Sending too much over-promotional content, boring content, or content that isn’t what they signed up for might cause you to see unsubscribes.
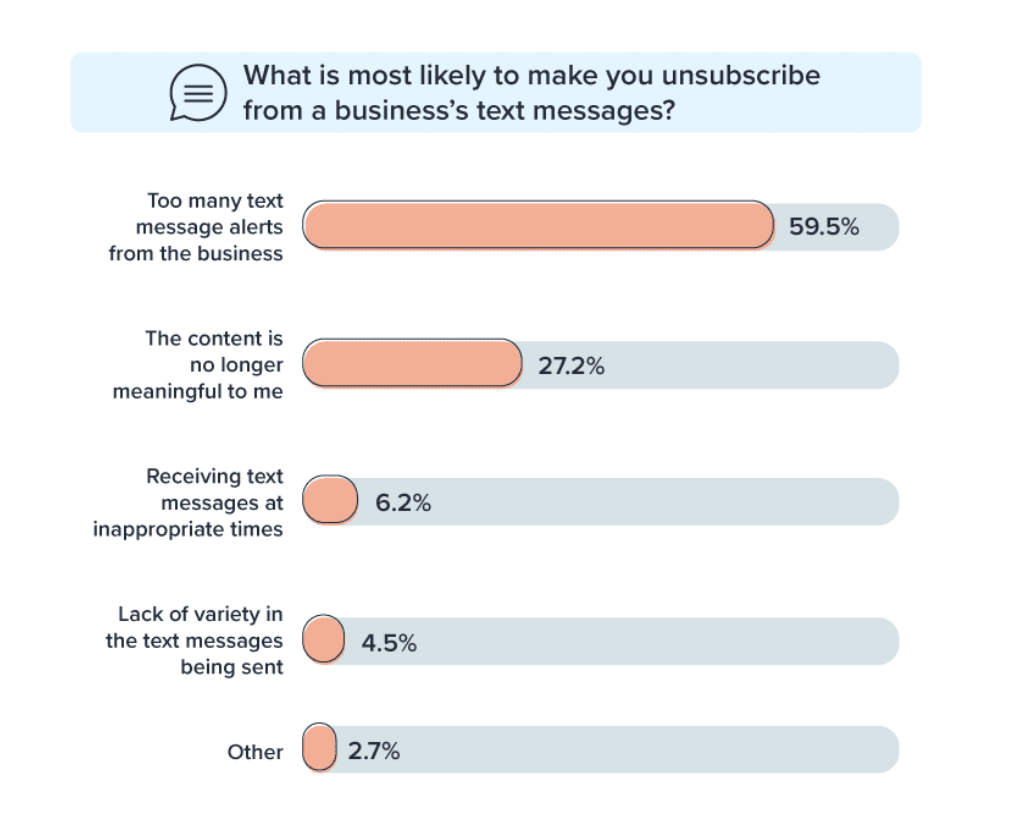
Tips for Launching a Great SMS Strategy
While SMS certainly isn’t dead, text message or conversational marketing platforms can be hard to master. As you consider or build out a text-based strategy, keep these quick tips in mind.
- Know your persona: Although people might quickly sign up to receive your messages, it won’t take much to get them to opt out. Be sure you know exactly what your audience members are looking for and how often they want to receive that content to avoid sending meaningless texts that go ignored.
- Give subscribers what they’ve signed up for: Remember, subscribers are trusting you with their contact information, and if you aren’t transparent about what you’ll be sending or how often you’ll be texting them, they might quickly opt. out. Be sure you stay consistent with what they’re expecting.
- Remember, less is more: No one wants to get their phone blown up with tons of meaningless over-promotional tests. Before you launch an SMS campaign, ask yourself questions like, “Am I contacting people too often?” and “Will they even engage with this content?” If you worry that the content will be ineffective, consider streamlining your SMS schedule and only sending the most important text content.
To learn even more about message-based marketing and SMS strategies, check out the great resource below.


How HubSpot Helps Users Prepare for Google’s Core Web Vitals
It’s no secret that poor user experience (UX) isn’t going to keep your customers and target audience coming back to your website. Poor UX also negatively impacts your ability to rank on Google’s search engine results page (SERP).
To ensure your website has delightful UX for your visitors as well as one that meets Google’s standards for ranking, you’ll want to focus on Core Web Vitals.
Core Web Vitals
At a high level, Google’s Core Web Vitals exist to fix poor user experiences on your website — Google knows that poor UX leads to higher bounce rates and that’s why they take page performance into consideration when determining your page’s ranking.
Core Web Vitals are meant to be applied by all site owners on each of their web pages to ensure all three Vitals — which we’ll talk more about below — are measured.
HubSpot Core Web Vitals
HubSpot’s SEO audit tool reviews all three of Google’s Core Web Vitals metrics for you. Below, we’ll cover the ways in which HubSpot can help you prepare for Core Web Vitals.
How HubSpot Helps Users Prep for Core Web Vitals
Google’s Core Web Vitals metrics are part of the search engine’s page ranking algorithm. HubSpot’s SEO audit tool flags pages with unsatisfactory scores based on Google’s Core Web Vitals metrics. Specifically, HubSpot uses Google Lighthouse to automatically scan all pages that make up a website. The tool then flags pages that fail any of these metrics.
Three Core Web Vitals that HubSpot’s SEO audit tool flags:

1. Largest Contentful Paint (LCP)
LCP is perceived page load speed. It refers to how quickly a page can load and render all of its visual elements to the screen.
2. Cumulative Layout Shift (CLS)
CLS is visual stability. It refers to how often users experience unexpected layout shifts on a web page.
3. First Input Delay (FID)
FID is load responsiveness. It’s a quantifiable measurement of how users feel when a page is unresponsive.
An alternative measurement for FID is Total Blocking Time (TBT). TBT is the quantifiable measurement of how much a non-interactive page is before becoming interactive. In other words, TBT measures the total amount of time that a page is blocked from responding to user input. HubSpot scans and flags web pages that have a TBT of over 300 milliseconds for you (because Google believes a good TBT is anything less than 300 milliseconds).
Who benefits from HubSpot’s SEO audit tool?
HubSpot can help you prepare for Core Web Vitals whether or not you’re a CMS Hub user — in fact, it’s available to those who are CMS Hub Professional and Enterprise users as well as Marketing Hub Professional and Enterprise users. You can use HubSpot’s SEO audit tool whether you’re on a HubSpot-hosted website or a website hosted by another platform.
Pro Tip: Get HubSpot CMS Hub or Marketing Hub to begin measuring your web pages’ UX against Google’s Core Web Vitals.
Start Prepping For Core Web Vitals With HubSpot
With HubSpot, you’ll know if your web pages meet Google Core Web Vitals. As a result, you’ll be able to ensure your web pages are offering your visitors delightful UX. Additionally, you’ll know that your web pages have a significantly better chance at ranking for your keywords and phrases than they would if they didn’t meet Google’s criteria.

5 Successful Email Marketing Strategies for Black-Owned Businesses [+ Examples]
Welcome to Breaking the Blueprint — a new blog series that dives into the unique business challenges and opportunities of Black business owners and entrepreneurs. Learn how they’ve grown or scaled their businesses, explored entrepreneurial ventures within their companies, or created side hustles, and how their stories can inspire and inform your own success.
We live in a digital era, and people are still checking their emails daily, so strong email marketing strategies are essential, especially for Black-owned businesses.
When thinking about creating the best email marketing strategies, make sure you are authentic and tell your community your story.
Do a brain dump of your ideas if you need to find purpose and discover the expected outcome for each marketing strategy you are working to create.
The Black community supports you best when you’re honest, so they can empathize with you.
“The most effective email marketing campaigns we’ve launched have been those that are authentic, tell our story, and bring our audience along for the ride. In the early days before we launched our company, all we had was our story to draw people into our funnel,” THE MOST founder and CEO Dawn Myers told HubSpot.
Myers adds, “Be vulnerable. Show the ups and downs of entrepreneurship. Show that you identify with their pain points and how much you’ve sacrificed to be able to serve them. This tactic builds deep credibility and trust.”
Below, you can find five email strategies that have worked for Black business owners today.

Additionally, for additional email marketing resources, check out these blogs on how to create an outstanding marketing plan and how to craft successful email marketing plans, with downloadable templates included.

Successful Email Marketing Strategies for Black-Owned Businesses
1. Find out what else your audience cares about in correlation with your mission.
If someone subscribes to your email list, it’s safe to say they have already heard of your product or find it interesting, so it’s important to dig deeper beyond that.
Ariel Butler, founder and CEO of hair and skin products company Shea Adé, learned that people mainly care about when the company is emailing about sales when it comes to product-based businesses. It can also get daunting if emails are about the same products consumers have already heard about.
“I’d recommend brands find other topics to email their audience about (blog posts, free ebooks, etc.),” she said. “Everything outside of that should be emails about sales or new product releases as opposed to the emails that look like ‘Hey, don’t forget to buy this full-priced item that I’ve been bugging you about 4X a week!‘”
One strategy that works for Butler is sending daily affirmations to her customers. She started trying out this simple email tactic since her brand’s mission is all about not only healing hair but healing beyond the scalp.
“I want my customers to wake up every day and feel good about how they look,” Butler said. “Since I started sending out those emails, I have been completely blown away by how enjoyable daily affirmations have been for my customers. Some people have only been introduced to my brand because someone told them about our emails, and when they found out that Shea Adé is a hair company, they supported me because they resonated with my brand’s mission to heal.”
2. Connect with your customers weekly.
Every week, Raven Gibson, founder and CEO of Legendary Rootz, sends out a campaign that allows email subscribers to download a free personal digital wallpaper.
She says this is her best email marketing strategy, and she coined it “Wallpaper Wednesday.” Over the years, Gibson’s audience has expressed to her that while they want to support her business, they don’t have the funds to do so. She recognized this problem and came up with a free solution to still connect with her community.
“Typically, the design centers around celebrating Black culture or an important reminder of the day,” Gibson said. “This marketing strategy has allowed for our email list to grow, and given us the opportunity to connect with our community.”
Gibson runs a similar campaign on Tuesdays where she connects with her followers by highlighting their love for natural hair. She sees this as a way to share community and emphasize the importance of Black hair culture. Gibson also uses these emails to share exclusive deals and product restocks specifically for email subscribers.
These weekly email marketing campaigns have helped drive an excellent return on investment, Gibson said.
“Investing in email marketing has allowed us to stretch our marketing dollars while making a meaningful connection with our community,” Gibson said.
3. Launch an engaging outreach campaign.
Creating outreach campaigns can grab people’s attention while providing a more significant incentive beyond expecting folks to just read your emails.
Alvarez Mckendall, a serial entrepreneur and digital marketing strategist, is responsible for social media and email marketing at Real Estate Bees, a technology and marketing platform for the real estate industry. One of his most successful email marketing strategies is interviewing the professionals and business owners with which he’s trying to connect.
Mckendall said this strategy is most effective because it helps consumers understand what the business is offering and how potential customers can benefit from it based on what he learns in those interviews.
Mckendall transformed Real Estate Bees’ previous email questionnaire into an interview-style questionnaire and adjusted email templates and subject lines to indicate his company’s desire to interview the business owner or a key member instead of completing a boring questionnaire.
“Just like your friends and family members, business owners love to get attention and feel important,” Mckendall said. “Appealing to one’s ego is an extremely effective technique whenever you want to get their attention and start building a business relationship.”
When Mckendall launched the outreach campaign, Real Estate Bees’ email open rate was 25-27%, and the response rate was about 1%.
“I was constantly thinking about how we could improve it,” he said.
Based on this campaign, Real Estate Bees’ email open rate has improved to 42%, and the response rate increased by 3%. It’s essential to make your campaigns engaging by including hyperlinks, photos, videos, and whatever else makes sense for your brand.
4. Make allies with other businesses by doing press partnerships.
Networking and building partnerships can be handy for email marketing strategies, too. Francis Perdue, CEO of public relations firm Perdue Inc., suggests Black business owners team up to expand their following by promoting each other.
The free promotion exposes different audiences to new products and services, and it also helps build community by connecting various consumers.
“No money is exchanged, yet it does wonders for your businesses,” Perdue said. “Share each other’s audiences to support one another. Creating an e-blast for an event or cause for someone in exchange for the same will grow your reach and show that you are committed to the community while promoting unity.”
If you don’t know where to start, pick up your phone and see what emails you have in your contact list already. When Perdue launched her firm over a decade ago, she said she didn’t know many people in the industry, but she had a strong community of friends, old colleagues, and former classmates.
She did an e-blast to promote her new business, and right off the back, she got 200 subscribers. More than 2,500 people are subscribed to Perdue Inc.’s email list, all of which came from Perdue’s organic outreach via her network.
“People want to support you; you’d be surprised,” she said. “Get out and network. I own a restaurant, so I know the importance of repeat customers.”
5. Use tools, applications, and other digital resources.
Building email marketing strategies can be tedious and time-consuming, especially if you’re
releasing emails weekly. It’s okay to build out your campaigns yourself, but if you’re looking for something new or different, here are some tools, applications, and resources that Black business owners use to better connect with their audiences:
- “This may sound crazy, but I believe TikTok is an amazing way to drive customers to your brand and your email list.” — Butler.
- “Switching to Klaviyo for all email correspondence helped with increasing our abandoned cart click rate from 4% to 7%. I am so happy that I took the time to switch over from Shopify and set it up.” — Gibson.
- “We have been using the BuzzStream tool to send out emails and monitor all the analytics and stats.” — Mckendall.
- “I love Adobe XD. It’s a prototyping application; however, I use it to craft all of our email marketing collateral. My favorite feature is the ability to duplicate and switch up the content in a split second. After creating specific templates for Wallpaper Wednesday or an exclusive email-only sale, I can reuse them again with just the click of a few buttons. I’ve found that using these templates allows me to streamline the process immensely.” — Gibson.
- “Some email marketing apps range from $0 to $100 a month. The good news is that usually, under 200 contacts are free. Use GoDaddy when you start your website to get coupons for marketing from their partners to cut costs as well.” — Perdue.
- “I love the website Really Good Emails. It is a gold mine for all things email. The site is very well-organized, and you can find just about any topic within the site. It’s almost like the Pinterest of email marketing.” — Gibson.

What is Brand Salience? [+How Do You Measure It?]
While branding can feel like a vague concept, it’s one of the most important elements of a marketing strategy.
Did you know that presenting a brand consistently across all platforms can increase revenue by up to 23%?
Plus, consistently presented brands are 3.5 times more likely to have excellent brand visibility than those with inconsistent branding.
In fact, 82% of investors say name recognition is an important factor guiding them in their investment decisions.
So, what does all this mean? Well, consistent branding leads to increased brand awareness which can then help gain investors and drive revenue to your business. Needless to say, branding is important for your business to succeed.
In this post, let’s review what brand salience is, how you can increase your brand visibility, and how to measure it.
If you have high brand salience, then you have a strong brand presence that consumers recognize and think about when they need a product. If you have low brand salience, then consumers might not know your brand exists and therefore won’t think of your brand when they need to make a purchase.
Essentially, brand salience is a similar metric as brand awareness except it’s focused on measuring awareness during the actual purchasing decision instead of overall brand visibility.
For example, when someone wants to get a cup of coffee and is driving around, what’s the first brand they think of? Probably Starbucks. When they want to buy tissues, they think of Kleenex. When they want to search for something online, they Google it.
All of these brands have transcended the perception of being a random company, and are now household names in their own right. Most people think of these brands and know of them whether they’ve been there or used those products before.
These brands have high brand salience. To have high brand salience, your customers need to think about your brand as the first solution to their wants or needs when they have to make a purchasing decision.
The concept of brand salience is actually psychological in nature. According to research done by Jenni Romaniuk and Byron Sharp, brand salience is “a brand’s propensity to be noticed or come to mind in buying situations.”
This means that you have to capture people’s attention and be memorable enough for consumers to recall your brand when they’re purchasing something.
For example, when a consumer has a choice of brands to purchase from, they’ll rely both on their memory and attention salience. This means they’ll recall brands they know and then see what captures their attention.
This process is actually scientific. People who have studied brand salience have studied the human brain — how do people recall information and how does a brand associate positive memory structure with their product?
To increase your brand salience, some of your marketing campaigns probably won’t even focus on persuading consumers to buy your product. The goal of many branding campaigns is to constantly reinforce positive associations with your brand. Familiarity is important. Constant marketing messages from a brand ensure that the brand is top-of-mind when a consumer is making a purchasing decision.
Brands create high brand salience by using distinctive brand assets that capture attention and create positive memories for their audience. This means your marketing assets promote positive storytelling and create a meaning associated with your brand. When you promote your values, you’re differentiating your brand from the competition and increasing brand salience.
To create campaigns that will improve brand salience, think about the emotional impact of your assets. Your campaigns should be meaningful, authentic, and portray your values as a company.
All of this will help customers create a positive association with your brand and remember your brand when it comes time to make a purchase.
For example, let’s say I want to buy some gum. When I think about gum, one of the first things I think of are the commercials for Extra. I’ve never forgotten those commercials because they were emotional and created a positive experience for me.
Now, when I think about gum, I usually buy Extra even though that brand has never been my favorite gum company (I used to buy Orbit). But since those commercials, I’ve leaned toward Extra because of the positive association and it’s one of the first brands I recall because of those commercials.
Ultimately, brand salience is a combination of brand awareness, familiarity, relevance, frequent communication, and emotional connections between brand and consumer.
Now, you might be thinking, “This all sounds great, but how can I measure this and prove its effectiveness to my managers?”
Let’s dive into that below.
How to Measure Brand Salience
Brand salience is rather conceptual in nature. Unfortunately, it’s not a mathematical metric that is easily measured. So, what do brands do?
Well, one of the only ways to measure brand salience is through surveys and focus groups. It’s important to ask your customers when they think of you, what they associate with your brand, and if they recall your company when making a purchasing decision.
You can ask customers whether they recall or notice your brand relative to competitors. Then, ask whether your brand is just thought of or sought after to determine how favorably your brand is judged.
Your survey can include descriptive assets to track your brand’s distinctive assets. For instance, what tone of voice, logo, color, or slogan comes to mind when users think of soda. They might say red, because they’ve associated Coca-Cola branding with soda in general.
To measure this, you can present survey respondents with a randomized list of cues and attributes by asking them which brands they associate with each statement. It could be questions like “when I want to eat something quick and healthy” or “I know I will not overpay there.”
Using a survey or focus group will help you determine how high your brand salience is compared to competitors.
Now, let’s look at the brand salience model that you can use to strategize your brand positioning.
Brand Salience Model
In his book, Strategic Brand Management: Building, Measuring, and Managing Brand Equity, Kevin Keller developed a model for brand salience that has become popular in digital marketing.
In the graphic below, Keller creates a pyramid of building blocks to pay attention to when you’re trying to increase your brand salience.
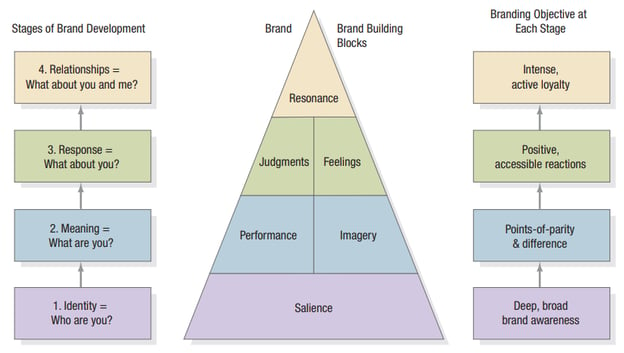
This model focuses on increasing deep, broad brand awareness by creating an identity that customers remember. At the foundation of the pyramid is salience, which you can increase by defining your brand in detail, frequently communicating with your audience, and using creative assets to tell a story.
Then, you create meaning and authenticity to differentiate your brand from the competition. And then, you use frequent messages to create positive, accessible reactions in your customers. And then you create loyalty by building a relationship and emotional connection with your audience.
With this model, you can increase brand salience, drive revenue, and even attract investors. Although this isn’t the easiest metric to track, the science proves that focusing on branding will help your company become a household name for your customers.


How to Write the Perfect Email to Apply for an Unlisted Role [Infographic]
Maybe you’ve been refreshing the Careers page at your dream company for months.
Alternatively, perhaps you’ve heard glowing reviews about a company from friends — but whenever you check, they’re still not hiring for any roles for which you’d qualify.
Whatever the case, if you feel a company’s culture could be a great fit for you, you might consider sending a cold email so hiring managers can keep you in-mind if a role becomes available.
But that’s easier said than done. If you sound too pushy, you risk alienating the hiring manager. A good cold email should be concise and focus on how you can add value to the team. When done correctly, a cold email is a good opportunity to network and get your name in front of the right people.
![→ Download Now: 12 Resume Templates [Free Download]](https://no-cache.hubspot.com/cta/default/53/4ec95757-585e-40cf-9189-6b3885074e98.png)
Fortunately, the folks at Resume.io put together an infographic, which details the 8 essential elements of a persuasive email you can use to apply at your dream company. Take a look now, and then check out How to Write a Letter of Interest in 2021 [Examples + Template].
-min.png?width=1200&name=How-to-Write-a-Persuasive-Email%20(1)-min.png)

8 Best Video Hosting Sites for Businesses in 2021
In middle school, my best friend and I used to have a show on YouTube where we performed a dare from our audience each week.
We actually had some fans that would watch our videos and dare us to do something on a weekly basis.
While hosting these types of videos on YouTube made sense because they were for entertainment purposes, your business needs a platform with more features so you can create videos for marketing campaigns, sales pitches, and customer service knowledge base articles.
In this post, let’s review some of the best video hosting sites for your business.
![→ Access Now: Video Marketing Starter Pack [Free Kit]](https://no-cache.hubspot.com/cta/default/53/8f27c677-d952-4663-8787-bf65c6a1ecf2.png)
Video Platforms
1. HubSpot
If you’re a HubSpot customer, you might already have access to HubSpot’s video hosting, creation, and management tool.
With this tool, you can host and manage video files inside the HubSpot platform and then embed those videos on your website pages, blog posts, social media channels, or knowledge base.
Using the same platform that you use for your marketing, sales, or service tool is a great idea because everything is all in one place. You can optimize your videos for SEO right in the tool.
This video hosting product also allows you to insert CTAs and forms into videos, trigger video workflows that provide targeted content to leads, and video analytics so you know which videos resonate with your audience.
For sales reps, you can use the video hosting tool to send video voicemails or record your screen during a sales call. You can also see if a prospect has watched the video in HubSpot’s tool.
Video can also be used for customer service. You can send video tutorials and record your screen right from a ticket to share it with customers for personalized and quick support. Or you can insert these videos into your knowledge base articles or FAQ page.
2. Twenty Three
Twenty Three is another great video hosting service for your business. You can host and embed videos on your site with Twenty Three’s 4K HD player. You can also directly clip and duplicate videos in the editor.
The best feature of this site is that you can publish and measure your videos across multiple platforms, including Facebook, LinkedIn, Twitter, and YouTube.
Additionally, this hosting site connects with other tools you might be using for marketing software, including HubSpot or Marketo.
Plus, you can use analytics to better understand your marketing data.
Using video for your business can help engage your audience, create a branded experience, and drive results.
3. Cincopa
Cincopa is a video and podcast hosting platform for businesses. With this platform, you can create videos for marketing campaigns, sales prospects, or customer support. Additionally, this platform can host podcasts and images as well.
With this hosting site, you can also combine your media gallery to create a video course with images, video, or podcast files. I don’t know about you, but I’ve seen online courses become all the rage in recent years, so this is a great feature to consider.
You can embed these videos on your site, social media, email, and more.
4. Hippo Video
Hippo Video is a video hosting platform that you can use to personalize your video emails for messages, demos, sales pitches, marketing campaigns, and more.
Using videos in the sales cycle can actually get three times more prospect engagement.
With this tool, you can record and send videos right in your email inbox. Additionally, you can integrate this tool with your current stack, including with Slack, HubSpot, Salesforce, Zoom, Zendesk, and more.
5. SproutVideo
SproutVideo is a great option for a video hosting platform if you’re looking for a no-frills, affordable platform.
With this tool, you can create videos and collaborate with your team. You can share a secure internal video, or live stream a product launch. Whatever your video needs are, this is an excellent option to consider.
Free Video Hosting Sites
6. Vimeo
Vimeo is one of the most popular video hosting sites and for good reason. This simple tool can be used to create, manage, and share high-quality videos.
To create videos, you can use templates, license stock footage, record video messages, or live stream. When you’re editing your videos, you might be able to integrate Vimeo with your editor. Vimeo integrates with Adobe Premiere, Final Cut Pro, and others. Then, your videos will be hosted in one central, secure location so you can seamlessly share them with anyone.
You can even create a subscription streaming service for your videos on this platform.
The best part? Vimeo is free. You can upgrade to paid plans, but you’ll never have to pay for Vimeo if you don’t want or need to.
7. Vidyard
Vidyard is one of the only video hosting sites that is built directly with sales in mind. The idea is to build a great sales process to make remote selling easy, from prospecting to proposals, you can record and send videos that add a personal touch at all stages of the sales cycle.
With Vidyard, you can create your videos in just a few clicks, with no video expertise required (that’s great for tech-challenged people like me).
This tool is also free. You don’t ever have to pay unless you want to upgrade to a different plan with more features.
My favorite feature of this tool is that you can easily create videos, track who watches them, and distribute them an unlimited number of times (yes, even in the free version).
8. Wistia
Another great video hosting site is Wistia. You can host videos and even podcasts on this hosting platform for marketers.
On Wistia, you can upload, customize, and embed branded videos or podcasts on one platform. This also has a free plan that you can use, as long as you don’t need to create too many videos a month (three is the max on the free plan). However, if you need more, there are paid plans as well.
But my favorite feature of this tool is that it can integrate with your tech stack and send engagement data to your CRM, ad platforms, and marketing tools.
Video is only continuing to grow, as people spend more time watching video than reading text. As your business continues to evolve, it’s important to have a video hosting tool that can grow with you and help you use videos to drive results for all aspects of your business.

How to Blend Web Analytics and Digital Marketing Analytics to Grow Better
Measuring the effectiveness of digital marketing is one of the greatest challenges facing organizations today.
Successfully evaluating the impact of marketing campaigns requires the use of comprehensive digital marketing analytics. When most marketers hear the term “digital analytics,” however, they tend to think of the web-based metrics typically associated with familiar analytics like Google Analytics which analyzes traffic, bounce rate, and unique visitors.
But this is just the tip of the marketing insights iceberg. While web analytics can provide you with a wealth of insight into the performance of your website, marketers need richer data to understand the impact of their marketing campaigns on conversion rates and the buyer’s journey.
Digital marketing analytics, meanwhile, offers a much more comprehensive view of what’s working (and what isn’t) when it comes to your marketing strategy.
Regardless of how you fit into your company’s marketing mix, learning how to understand and leverage digital marketing analytics is incredibly important. Analytics data not only tells you if your marketing is working, but it also tells you precisely how and where you can improve. This type of insight can benefit everyone.
That’s why we built this guide. We want you to master marketing analytics so your business can grow better. Below, we’ll talk about what marketing metrics to monitor, how to read and apply them to your marketing decisions, and how to leverage them to grow your business and bottom line.
Bookmark this guide for future reference and use the chapter links below to navigate through the content.
![→ Click here to download our free guide to digital marketing fundamentals [Download Now].](https://no-cache.hubspot.com/cta/default/53/0a42501f-0096-4817-9fbc-923540fe37a6.png)
Put simply? Analytics draw the line between opinion and fact by giving your business data-driven insight into user behavior.
Before we dive into how to use digital analytics for your business, let’s talk about what marketing metrics you’ll be measuring and analyzing.
Digital Marketing Metrics to Know
Digital marketing metrics are statistical measures that marketers use to determine the success of various marketing efforts as they relate to their overall campaign goals and industry standards.
Let’s get vanity metrics out of the way first. These are surface-level numbers that often tease you into thinking your efforts are working. They’re often big numbers tied to nebulous concepts such social media “impact” and they’re more fluff than fact. While they may make your marketing team feel good, they offer little in the way of business value.

To get a clear picture of your campaign’s impact, you need to look at a wider variety of actionable metrics.
Here’s a comprehensive list of all the marketing metrics you need to know — and what they can tell you.
Best Metrics for Website Marketing Analytics
The following are digital marketing metrics associated with websites and web activity — a.k.a. web analytics.
Visitor
A Visitor (or User) is someone who visits your site. Visitors are tracked by a cookie placed in their browser by a tracking code installed on your site.
Page View
A Page View is when a page on your site is loaded by a browser. A page view is measured every time your tracking code is loaded.
Session
A Session is a series of activities taken by a visitor on your website, including page views, CTAs, and events. Sessions expire after 30 minutes of visitor inactivity.
Traffic
Traffic (or Visits) is the total number of site or page visits in a given time period.
Traffic by Channel
Traffic by channel is the total number of site or page visits per referral channel, (e.g., social media, email, landing pages, etc … ).
Traffic by Device
Traffic by device is the total number of site or page visits per device type, ( e.g., smartphone, tablet, desktop, etc … ).
Ratio of New Traffic to Returning Traffic
The ratio of new traffic to returning traffic is the percentage of net new site or page visitors you receive as compared to the total amount of returning traffic.
Time on Page
The time on page is the average time each visitor spends on your site or page.
Interactions per Visit
Interactions per visit are what actions your visitors took when on your site or page.
Bounce Rate
The bounce rate is the percentage of people who visited your site or page but didn’t take any action or look at any other pages as compared to the total number of page or site visitors.
Best Metrics for Lead Generation
The following are digital marketing metrics associated with lead magnets and content offers.
Call-to-Action (CTA) Click-Through Rate
The CTA click-through rate is the percentage of total clicks on a CTA as compared to the total number of page or site visits.
Submissions
Submissions is the percentage of total people who filled out and submitted your web form.
Conversion Rate
The conversion rate is the total number of actions taken (e.g., a download or sign-up) on your lead magnet as compared to the total number of visits.
Free Trial Conversion Rate
The free trial conversion rate is the percentage of free trial users who converted to customers.
Pop-Up Conversions
Pop-up conversions is the percentage of total pop-up form completions that converted to customers.
Ratio of Generated Leads to Marketing-Qualified Leads (MQL)
The ratio of generated leads to MQL is the total number of “good fit” leads collected from your lead magnet as compared to the total number of leads generated.
Leads to Close Ratio
The leads to close ratio is the percentage of leads converted to customers as compared to the total number of leads.
Best Metrics for Email Marketing
The following are digital marketing metrics associated with email marketing.
Open Rate
The open rate is the percentage of opened emails as a proportion of the total number of emails sent.
Opens by Device
Opens by device is the total number of email opens per device type, (e.g., smartphone, tablet, and desktop).
Click-Through Rate
The click-through rate is the percentage of total clicks on an email link, or CTA, as a proportion of the total number of email opens.
Bounce Rate
The bounce rate is the percentage of undeliverable emails as a proportion of the total number of emails sent.
Unsubscribe Rate
The unsubscribe rate is the percentage of people who unsubscribe from your email list over a given period of time.
Best Metrics for Social Media
The following are digital marketing metrics associated with content and social media.
Engagement Rate
The engagement rate is the total number of engagements (e.g., comments, clicks, and likes) as a proportion of the total number of page or post views.
Follows and Subscribes
Follows and subscribes are the total number of people who’ve shown interest in your content and want to receive updates when new posts or pages are published.
Shares
Shares is the total number of times a post or page has been shared on social media, a website, or a blog.
Audience Growth Rate
This refers to the growth of your social audience over time, typically expressed as a percentage. To find it, measure the number of new social followers over a set period (such as two weeks or a month), then divide by your total number of followers and multiply by 100.
Post Reach
The further your social posts reach, the better for your brand. Digital marketing analytics platforms can show you how many of your social followers have seen your last post. Divide by total followers and multiply by 100 again to get your post reach percentage.
Potential Post Reach
It’s also worth evaluating how far your posts could reach. To find this metric, multiply the total number of times your brand is mentioned by the number of followers of the person or brand that mentioned you. The result is your “theoretical reach”, or the maximum number of people it’s possible to reach with your current network. Potential reach is typically two to five percent of this total.
Share of Social Voice
How do your social mentions compare to those of your competitors? Start by searching for mentions of your brand — both the direct @Yourbrand variety and indirect Yourbrand shoutouts — then measure the mentions of your direct competitors for the same time period to see how you stack up.
Approval Rate
While it’s nice to be mentioned, it’s better to be liked. That’s the goal of approval rate measurement — determining how many positive interactions followers have had with your posts. These might include likes, shares, reshares, or even sales conversions, and they can ensure your marketing campaign is on the right track.
Best Metrics for Ecommerce
The following are digital marketing metrics associated with ecommerce.
Shopping Cart Abandonment Rate
The shopping cart abandonment rate is the total number of online shoppers who put items in their shopping cart but don’t complete a purchase as a proportion of the number of people who complete a purchase.
Sales Conversion Rate
More conversions mean more revenue, which means it’s critical to measure your overall sales conversion rate: Out of all customers that visit your site, how many are clicking through to make a purchase?
It’s also worth measuring “mini-conversions” such as moving from home or category pages to specific product pages, which indicates a positive customer inertia toward sales conversion.
Email Marketing Opt-in
Along with purchasing opportunities, e-commerce sites often contain email marketing opt-ins that provide consumers information about new products or sales events. Measuring your total opt-ins and opt-ins by source (mobile, desktop, or platform) can help quantify marketing efforts.
Customer Acquisition Cost
Customers don’t always come cheap. To find your total acquisition cost, divide total marketing budget by total number of customers. The higher the number, the more you’re spending and the narrower your profit margins will be.
Average Order Value
It’s also worth calculating your average order value. Find it by dividing total sales value by number of carts — the higher the number, the better. Then, look for ways to increase average order value, such as offering add-on items, bundle discounts, or even free shipping.
Revenue by Source
Where is your revenue coming from? This metric helps identify where your marketing budget is best spent and where it isn’t working as intended. For example, if traffic analysis shows substantive sales conversion tied to Facebook followers but almost nothing from Instagram, it’s worth reevaluating your marketing campaign approach.
This section serves as a high-level review of the most important marketing metrics per channel. Depending on what software you use or marketing channels you pursue, you may see different metrics.
So, why exactly do digital marketing analytics matter? Let’s take a look at what makes digital analytics so important today, and how they compare to (and improve upon) the insights offered by more basic web analytics.
Quite simply, web analytics (like many of the metrics we defined above)just isn’t enough. The data that web analytics provides alone doesn’t cut it for marketers who need to understand how their work makes an impact throughout the entire marketing and sales flywheel.
Let’s face it: Today’s marketing extends well beyond the bounds of your website. It also includes how your marketing channels interact, the insight you gain from those outcomes, and the progress you track through your reporting.
This perspective provides the foundational data you need to structure your flywheel — delighting your existing customers enough to attract and engage new ones.
Web analytics measure things a webmaster or technical SEO specialist care about, like page load speed, page views per visit, and time on site.
Digital marketing analytics, on the other hand, measures business metrics like traffic, leads, and sales, and allow you to observe which online events determine whether leads will become customers.
Digital marketing analytics include data not only from your website, but also from sources like email, social media, and organic search.
How Digital Marketing Analytics Connects Every Business Activity
With digital marketing analytics, marketers can understand the effectiveness of their entire marketing strategy, not just the effectiveness of their website. Using digital marketing analytics allows marketers to identify how each of their marketing initiatives (e.g., social media vs. blogging vs. email marketing) stack up against one another, determine the true ROI of their activities, and understand how well they’re achieving their business goals.
The central question is: How can you structure an appropriate business goal to visualize your marketing team’s efforts in the most accurate way possible?
As a result of the information they can gather from full-stack digital marketing analytics, marketers can also diagnose deficiencies in specific channels in their marketing mix, and make adjustments to strategies and tactics to improve their overall marketing activity.
You can spend hours slicing and dicing data in web analytics tools, comparing new vs. repeat visitors month over month. But when it comes down to it, you’ll come up short of a truly comprehensive view of your marketing performance.
There’s no doubt that marketers are aware there’s a deficiency in how they’re able to measure the effectiveness of what they do; here’s how full-stack digital marketing analytics makes up for that deficiency.
A digital marketing analysis is the first step to developing a strong digital marketing analytics strategy. This process can be used to structure a business goal into outcomes based on three broad categories:
- The relationship between different marketing channels
- People-centric data on the buyer’s journey
- Revenue attributed to specific marketing efforts
Let’s highlight these main differentiators.
1. The Relationship Between Marketing Channels
Digital marketing analytics provides a solid look into the direct relationships between your marketing channels. It’s great to be able to see how each of your individual channels (e.g., social media, blogging, email marketing, and SEO) is performing, but the true power of analytics comes into play when you can easily tie the effect of multiple channels’ performances together.
For instance, let’s say you sent an email to a segment of your database. Digital marketing analytics not only tells you how many people clicked through from your email to your website but also how many of those people actually converted into leads for your business when they got there.
Furthermore, you can compare the impact of that individual email send with other marketing initiatives. Did that email generate more leads than the blog post you published yesterday? Or was the content you shared via Twitter more effective?
2. People-Centric Data on the Buyer’s Journey
As we mentioned earlier, a key differentiator between web analytics and digital marketing analytics is that the latter uses the person — not the page view — as the focal point.
Digital marketing analytics enables you to track how your individual prospects and leads are interacting with your various marketing initiatives and channels over time. How did an individual lead first come to find your website? From Google? Facebook? Direct traffic? Is that lead an active part of your email subscriber base, clicking and converting on marketing offers presented via email? Do they read your blog, and have they downloaded any content offers that could indicate an interest in your products/services?
Full-stack digital marketing analytics can tell you all of this and more, providing you with extremely valuable lead intelligence that can help inform the direction of your future campaigns.
Looking at all of this information in aggregate can help you understand trends among your prospects and leads and which marketing activities are valuable at different stages in the buyer’s journey.
Perhaps you find that many customers’ last point of conversion was on a certain ebook or white paper. Having this data makes it possible to implement an effective lead management process, enabling you to score and prioritize your leads and identify which activities contribute to a marketing-qualified lead (MQL) for your business.
3. Revenue Attributed to Specific Marketing Efforts
One of the most useful functions of marketing analytics is its ability to attribute specific marketing activities to sales revenue. Sure, your blog may be effective in generating leads, but are those leads actually turning into customers and making your business money? Closed-loop marketing analytics can tell you.
The only requirement here is that your digital marketing analytics system is hooked up to your customer relationship management (CRM) platform.
Having this closed-loop data can help you determine whether your individual marketing initiatives are actually contributing to your business’ bottom line. Through it, you can determine which channels are most critical for driving sales.
Perhaps you find that your blog is your most effective channel for generating customers, or conversely, you find that social media is really only as powerful as an engagement mechanism, not a source of sales.
By measuring the relationship between marketing channels, tracking people-centric data, and analyzing what revenue is linked to which efforts, you’ll be equipped to set goals that support your bottom line.
Now, let’s talk about how to use these marketing analytics effectively.
How to Use Digital Marketing Analytics Effectively
Most marketers know they need to be looking at more than just traffic and website performance to get the insights we’ve talked about so far. But why do so many of us still struggle to measure the impact and prove the ROI of our online marketing activities?
Probably one of two reasons:
- We don’t have solid goals in place for our campaigns, or
- We don’t have the means to measure our success.
Quite often, you’ll find it’s a combination of the two.
Master SMART Marketing with our free, goal-setting Excel template.
S.M.A.R.T. Goals
One way to mitigate this is to have an actionable business goal combining your marketing team’s priorities. Typically, this can be achieved using the S.M.A.R.T. format. In this strategy, each goal you create must be:
- Smart
- Measurable
- Attainable
- Relevant
- Timely
A good business goal will inherently organize your team’s tasks towards producing specific outcomes or metrics to measure their progress. For marketing teams, this can be broadly summarized into three major categories:
- Web traffic and diversity of sources
- Conversions generated from traffic to produce leads and (eventually) customers
- Identifying net new revenue as a direct result of certain marketing efforts, laying a roadmap for further growth and cost-effective marketing investments
The fact is, in order to gain the insights needed to understand their marketing performance and make sound decisions, most marketers balance a number of different digital analytics platforms. (Remember how many categories of marketing metrics we reviewed above?)
For example, they gather data about their email marketing through the analytics provided by their email service provider, information about their social media performance through their social media monitoring tool, blog analytics from their blogging platform … and the list goes on.
But this fragmented approach to reporting makes it really difficult to connect the dots and make informed decisions about the future of your digital strategy.
The ideal solution is to implement an all-in-one marketing and reporting platform that offers end-to-end visibility on your marketing activities, allowing you to measure everything in one place.
Campaign Reporting
Rather than just looking at canned reports for each traffic source you can use custom reporting capabilities to construct data charts that depict an entire marketing campaign’s progress, not just how certain content is doing through certain channels.
Here’s how you can configure your digital analytics to capture this holistic view, showing you where a potential buyer came and where they are going. We’ll use HubSpot’s Marketing Hub as an example. Here are some of the types of analytics you can see in a quality marketing tool:
Web Traffic by Original Source
This is an easy report that you can configure by date range and/or original source to show what marketing channels you can capitalize on to turn more of that traffic into leads and customers. You can use HubSpot’s Traffic Analytics tool to get access to this.
First Conversion by Original Source/Persona
This report quantifies your impact by the number of new contacts you’re able to create based on the first content offer or form submitted, and tie that back to the original source of that lead.
Another way to look at this is to segment your contacts by a particular persona to show which ones are giving the most return for which your team is creating content.
Contacts Funnel Report
This calculates the conversion rates down the marketing and sales funnel, showing new leads that become marketing qualified leads, sales qualified leads, and, ultimately, new customers.
Marketing Contribution to Revenue
This custom report depends on your use of the marketing qualified lead lifecycle stages, visualizing those that converted into customers and their relative value in terms of revenue generated.
Customer Acquisition Cost
This can be seen in HubSpot by using calculated fields or custom properties to depict the amount of money spent by your marketing team to attract, engage, and delight your buyer persona.
These closed-loop reports are just some of the capabilities available to depict your progress towards your business’s bottom line.
All of the insights, information, and data you can gather from your digital marketing analytics tool(s) is really only useful if you do something with it. The true value of analytics isn’t just to prove the value of marketing to your boss; it’s also to help you improve and optimize your marketing performance — on both an individual channel-by-channel basis as well as an overall, cross-channel machine.
With digital marketing analytics, you should also be able to implement closed-loop reporting, making it easier to prove how your marketing efforts are positively impacting your sales team, who are being fed much higher quality leads.
Digital Advertising Analytics
Digital advertising is an important part of any digital marketing strategy. Nearly one quarter of marketers spend the same amount of their marketing budget on advertising (25%).
Traditionally, the effectiveness of digital advertising (e.g., paid search and social media ads) has been measured by click-throughs and the cost of each click (CPC). While these are powerful metrics, you can’t truly know the cost of each click unless you’re measuring the value of your conversions and ROI of your campaigns.
One way to measure this is by putting a full-stack marketing solution in place to join your impression, click, and cost data from all active digital advertising channels to your CRM. Doing so will help you link the cost of each click-through to the value it provides your business.
Moreover, digital display advertising should be considered powerful tools for brand awareness — not measured by click-throughs (or the lack thereof). These types of digital ads can boost organic and cross-channel performance as consumers see your ad, become interested in your brand, and search for your website or social media.
Apply this new perspective on digital advertising analytics and watch how it transforms your overall digital marketing strategy.
Grow Better with Digital Marketing Analytics
The most important takeaway from this article is: If you’re relying solely on top-level web analytics, you’re missing out on a lot of powerful data that can help inform your marketing strategy and better connect with your audience and customers. So, when evaluating digital analytics tools for your business, be sure you’re looking for evidence of digital marketing analytics, not just web analytics.
While web analytics provide a rosy picture of your top-line activity, digital marketing analytics can help you turn your business objectives into measurable outcomes that support your bottom line. Prioritize the data that reflects people — not pageviews — and you’ll be growing better in no time.
Editor’s note: This post was originally published in February 2019 and has been updated for comprehensiveness.

How to Use Excel Like a Pro: 18 Easy Excel Tips, Tricks, & Shortcuts
Sometimes, Excel seems too good to be true. All I have to do is enter a formula, and pretty much anything I’d ever need to do manually can be done automatically. Need to merge two sheets with similar data? Excel can do it. Need to do simple math? Excel can do it. Need to combine information in multiple cells? Excel can do it.
The only problem is that it can be difficult to use for beginners. While inputting the data manually is easy, it can be a nightmare to learn all the formulas and shortcuts you need to master the tool. Plus, even if you use the formulas correctly, there’s always a chance you’ll run into error messages. Simply put, Excel can be extremely hard to use.
Not to worry. In this post, I’ll go over the best tips, tricks, and shortcuts you can use right now to take your Excel game to the next level. No advanced Excel knowledge required.
What is Excel?
Microsoft Excel is a spreadsheet software that marketers, accountants, data analysts, and other professionals use to store, organize, and track data sets. It’s part of the Microsoft Office suite of products. Alternatives include Google Sheets and Numbers. Find more Excel alternatives here.
To jumpstart your Excel education, check out a video below on how to use Excel for beginners.
Excel is primarily used for creating financial documents because of its strong computational powers. You’ll often find the software in accounting offices and teams because it allows accountants to automatically see sums, averages, and totals. With Excel, they can easily make sense of their business’ data.
While Excel is primarily known as an accounting tool, professionals in any field can use its features and formulas — especially marketers — because it can be used for tracking any type of data. It removes the need to spend hours and hours counting cells or copying and pasting performance numbers. Excel typically has a shortcut or quick fix that speeds up the process.
Not sure how you can actually use Excel in your team? Here is a list of documents you can create:
- Income Statements: You can use an Excel spreadsheet to track a company’s sales activity and financial health.
- Balance Sheets: Balance sheets are among the most common types of documents you can create with Excel. It allows you to get a holistic view of a company’s financial standing.
- Calendar: You can easily create a spreadsheet monthly calendar to track events or other date-sensitive information.
Here are some documents you can create specifically for marketers.
- Marketing Budgets: Excel is a strong budget-keeping tool. You can create and track marketing budgets, as well as spend, using Excel. If you don’t want to create a document from scratch, download our marketing budget templates for free.
- Marketing Reports: If you don’t use a marketing tool such as Marketing Hub, you might find yourself in need of a dashboard with all of your reports. Excel is an excellent tool to create marketing reports. Download free Excel marketing reporting templates here.
- Editorial Calendars: You can create editorial calendars in Excel. The tab format makes it extremely easy to track your content creation efforts for custom time ranges. Download a free editorial content calendar template here.
- Traffic and Leads Calculator: Because of its strong computational powers, Excel is an excellent tool to create all sorts of calculators — including one for tracking leads and traffic. Click here to download a free premade calculator.
This is only a small sampling of the types of marketing and business documents you can create in Excel. We’ve created an extensive list of Excel templates you can use right now for marketing, invoicing, project management, budgeting, and more.
You can also download Excel templates below for all of your marketing needs.
After you download the templates, it’s time to start using the software. Let’s cover the basics first.
Excel Basics
If you’re just starting out with Excel, there are a few basic commands that we suggest you become familiar with. These are things like:
- Creating a new spreadsheet from scratch.
- Executing basic computations like adding, subtracting, multiplying, and dividing.
- Writing and formatting column text and titles.
- Using Excel’s auto-fill features.
- Adding or deleting single columns, rows, and spreadsheets. Below, we’ll get into how to add things like multiple columns and rows.
- Keeping column and row titles visible as you scroll past them in a spreadsheet, so that you know what data you’re filling as you move further down the document.
For a deep dive on these basics, check out our comprehensive Microsoft Excel guide.
In the spirit of working more efficiently and avoiding tedious, manual work, here are a few Excel formulas and functions you’ll need to know.
Excel Formulas
It’s easy to get overwhelmed by the wide range of Excel formulas that you can use to make sense out of your data. If you’re just getting started using Excel, you can rely on the following formulas to carry out some complex functions — without adding to the complexity of your learning path.
- Equal sign: Before creating any formula, you’ll need to write an equal sign (=) in the cell where you want the result to appear.
- Addition: To add the values of two or more cells, use the + sign. Example: =C5+D3.
- Subtraction: To subtract the values of two or more cells, use the – sign. Example: =C5-D3.
- Multiplication: To multiply the values of two or more cells, use the * sign. Example: =C5*D3.
- Division: To divide the values of two or more cells, use the / sign. Example: =C5/D3.
Putting all of these together, you can create a formula that adds, subtracts, multiplies, and divides all in one cell. Example: =(C5-D3)/((A5+B6)*3).
For more complex formulas, you’ll need to use parentheses around the expressions to avoid accidentally using the PEMDAS order of operations. Keep in mind that you can use plain numbers in your formulas.
Excel Functions
Excel functions automate some of the tasks you would use in a typical formula. For instance, instead of using the + sign to add up a range of cells, you’d use the SUM function. Let’s look at a few more functions that will help automate calculations and tasks.
- SUM: The SUM function automatically adds up a range of cells or numbers. To complete a sum, you would input the starting cell and the final cell with a colon in between. Here’s what that looks like: SUM(Cell1:Cell2). Example: =SUM(C5:C30).
- AVERAGE: The AVERAGE function averages out the values of a range of cells. The syntax is the same as the SUM function: AVERAGE(Cell1:Cell2). Example: =AVERAGE(C5:C30).
- IF: The IF function allows you to return values based on a logical test. The syntax is as follows: IF(logical_test, value_if_true, [value_if_false]). Example: =IF(A2>B2,”Over Budget”,”OK”).
- VLOOKUP: The VLOOKUP function helps you search for anything on your sheet’s rows. The syntax is: VLOOKUP(lookup value, table array, column number, Approximate match (TRUE) or Exact match (FALSE)). Example: =VLOOKUP([@Attorney],tbl_Attorneys,4,FALSE).
- INDEX: The INDEX function returns a value from within a range. The syntax is as follows: INDEX(array, row_num, [column_num]).
- MATCH: The MATCH function looks for a certain item in a range of cells and returns the position of that item. It can be used in tandem with the INDEX function. The syntax is: MATCH(lookup_value, lookup_array, [match_type]).
- COUNTIF: The COUNTIF function returns the number of cells that meet a certain criteria or have a certain value. The syntax is: COUNTIF(range, criteria). Example: =COUNTIF(A2:A5,”London”).
Okay, ready to get into the nitty-gritty? Let’s get to it. (And to all the Harry Potter fans out there … you’re welcome in advance.)
Note: The GIFs and visuals are from a previous version of Excel. When applicable, the copy has been updated to provide instruction for users of both newer and older Excel versions.
1. Use Pivot tables to recognize and make sense of data.
Pivot tables are used to reorganize data in a spreadsheet. They won’t change the data that you have, but they can sum up values and compare different information in your spreadsheet, depending on what you’d like them to do.
Let’s take a look at an example. Let’s say I want to take a look at how many people are in each house at Hogwarts. You may be thinking that I don’t have too much data, but for longer data sets, this will come in handy.
To create the Pivot Table, I go to Data > Pivot Table. If you’re using the most recent version of Excel, you’d go to Insert > Pivot Table. Excel will automatically populate your Pivot Table, but you can always change around the order of the data. Then, you have four options to choose from.
- Report Filter: This allows you to only look at certain rows in your dataset. For example, if I wanted to create a filter by house, I could choose to only include students in Gryffindor instead of all students.
- Column Labels: These would be your headers in the dataset.
- Row Labels: These could be your rows in the dataset. Both Row and Column labels can contain data from your columns (e.g. First Name can be dragged to either the Row or Column label — it just depends on how you want to see the data.)
- Value: This section allows you to look at your data differently. Instead of just pulling in any numeric value, you can sum, count, average, max, min, count numbers, or do a few other manipulations with your data. In fact, by default, when you drag a field to Value, it always does a count.
Since I want to count the number of students in each house, I’ll go to the Pivot table builder and drag the House column to both the Row Labels and the Values. This will sum up the number of students associated with each house.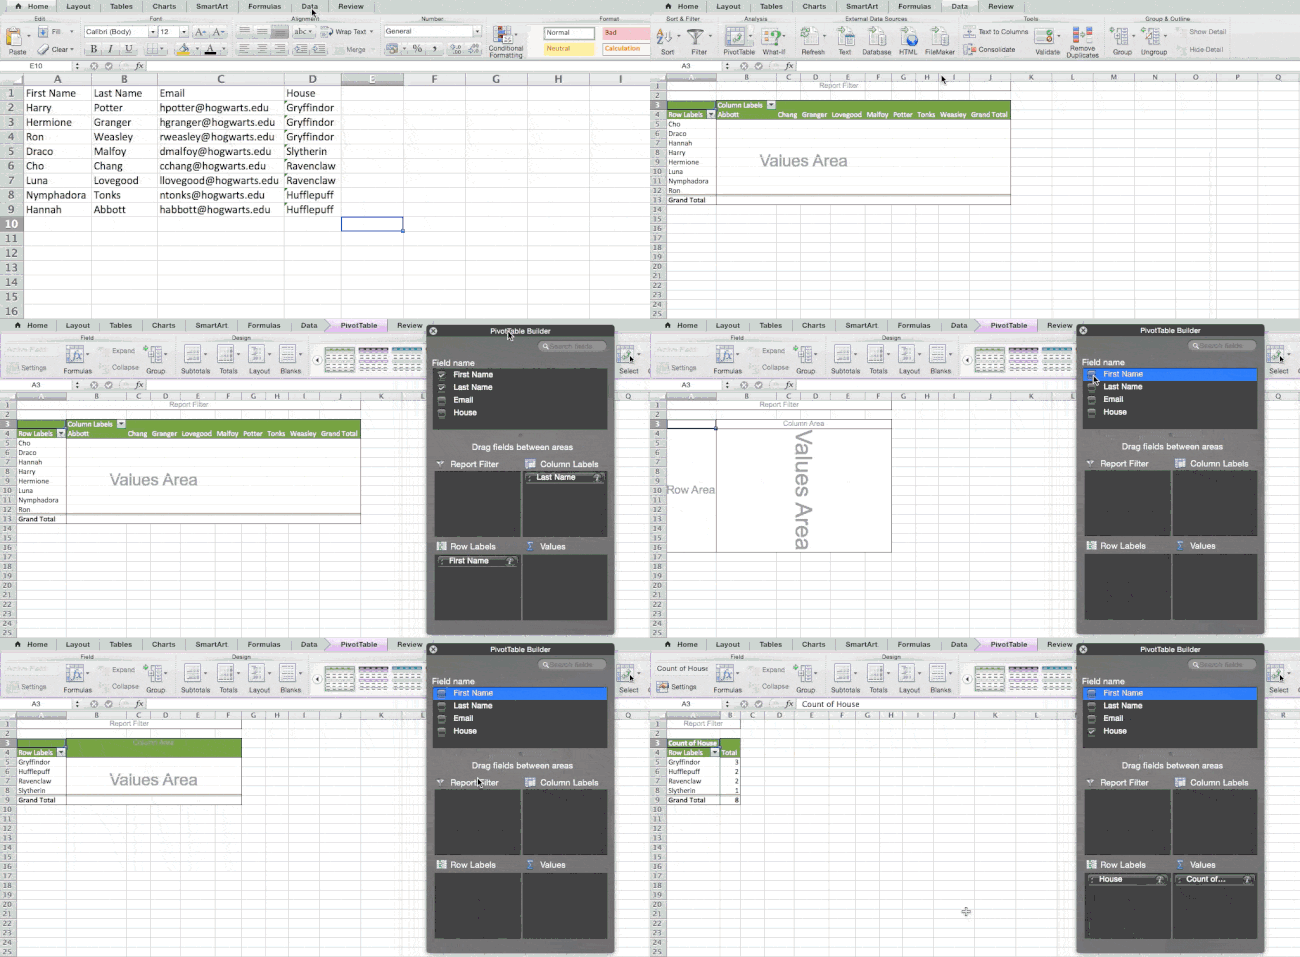
2. Add more than one row or column.
As you play around with your data, you might find you’re constantly needing to add more rows and columns. Sometimes, you may even need to add hundreds of rows. Doing this one-by-one would be super tedious. Luckily, there’s always an easier way.
To add multiple rows or columns in a spreadsheet, highlight the same number of preexisting rows or columns that you want to add. Then, right-click and select “Insert.”
In the example below, I want to add an additional three rows. By highlighting three rows and then clicking insert, I’m able to add an additional three blank rows into my spreadsheet quickly and easily.
3. Use filters to simplify your data.
When you’re looking at very large data sets, you don’t usually need to be looking at every single row at the same time. Sometimes, you only want to look at data that fit into certain criteria.
That’s where filters come in.
Filters allow you to pare down your data to only look at certain rows at one time. In Excel, a filter can be added to each column in your data — and from there, you can then choose which cells you want to view at once.
Let’s take a look at the example below. Add a filter by clicking the Data tab and selecting “Filter.” Clicking the arrow next to the column headers and you’ll be able to choose whether you want your data to be organized in ascending or descending order, as well as which specific rows you want to show.
In my Harry Potter example, let’s say I only want to see the students in Gryffindor. By selecting the Gryffindor filter, the other rows disappear.
 Pro Tip: Copy and paste the values in the spreadsheet when a Filter is on to do additional analysis in another spreadsheet.
4. Remove duplicate data points or sets.
Larger data sets tend to have duplicate content. You may have a list of multiple contacts in a company and only want to see the number of companies you have. In situations like this, removing the duplicates comes in quite handy.
To remove your duplicates, highlight the row or column that you want to remove duplicates of. Then, go to the Data tab and select “Remove Duplicates” (which is under the Tools subheader in the older version of Excel). A pop-up will appear to confirm which data you want to work with. Select “Remove Duplicates,” and you’re good to go.
You can also use this feature to remove an entire row based on a duplicate column value. So if you have three rows with Harry Potter’s information and you only need to see one, then you can select the whole dataset and then remove duplicates based on email. Your resulting list will have only unique names without any duplicates.
5. Transpose rows into columns.
When you have rows of data in your spreadsheet, you might decide you actually want to transform the items in one of those rows into columns (or vice versa). It would take a lot of time to copy and paste each individual header — but what the transpose feature allows you to do is simply move your row data into columns, or the other way around.
Start by highlighting the column that you want to transpose into rows. Right-click it, and then select “Copy.” Next, select the cells on your spreadsheet where you want your first row or column to begin. Right-click on the cell, and then select “Paste Special.” A module will appear — at the bottom, you’ll see an option to transpose. Check that box and select OK. Your column will now be transferred to a row or vice-versa.
On newer versions of Excel, a drop-down will appear instead of a pop-up.

6. Split up text information between columns.
What if you want to split out information that’s in one cell into two different cells? For example, maybe you want to pull out someone’s company name through their email address. Or perhaps you want to separate someone’s full name into a first and last name for your email marketing templates.
Thanks to Excel, both are possible. First, highlight the column that you want to split up. Next, go to the Data tab and select “Text to Columns.” A module will appear with additional information.
First, you need to select either “Delimited” or “Fixed Width.”
- “Delimited” means you want to break up the column based on characters such as commas, spaces, or tabs.
- “Fixed Width” means you want to select the exact location on all the columns that you want the split to occur.
In the example case below, let’s select “Delimited” so we can separate the full name into first name and last name.
Then, it’s time to choose the Delimiters. This could be a tab, semi-colon, comma, space, or something else. (“Something else” could be the “@” sign used in an email address, for example.) In our example, let’s choose the space. Excel will then show you a preview of what your new columns will look like.
When you’re happy with the preview, press “Next.” This page will allow you to select Advanced Formats if you choose to. When you’re done, click “Finish.”

7. Use formulas for simple calculations.
In addition to doing pretty complex calculations, Excel can help you do simple arithmetic like adding, subtracting, multiplying, or dividing any of your data.
- To add, use the + sign.
- To subtract, use the – sign.
- To multiply, use the * sign.
- To divide, use the / sign.
You can also use parentheses to ensure certain calculations are done first. In the example below (10+10*10), the second and third 10 were multiplied together before adding the additional 10. However, if we made it (10+10)*10, the first and second 10 would be added together first.
8. Get the average of numbers in your cells.
If you want the average of a set of numbers, you can use the formula =AVERAGE(Cell1:Cell2). If you want to sum up a column of numbers, you can use the formula =SUM(Cell1:Cell2).
9. Use conditional formatting to make cells automatically change color based on data.
Conditional formatting allows you to change a cell’s color based on the information within the cell. For example, if you want to flag certain numbers that are above average or in the top 10% of the data in your spreadsheet, you can do that. If you want to color code commonalities between different rows in Excel, you can do that. This will help you quickly see information that is important to you.
To get started, highlight the group of cells you want to use conditional formatting on. Then, choose “Conditional Formatting” from the Home menu and select your logic from the dropdown. (You can also create your own rule if you want something different.) A window will pop up that prompts you to provide more information about your formatting rule. Select “OK” when you’re done, and you should see your results automatically appear.
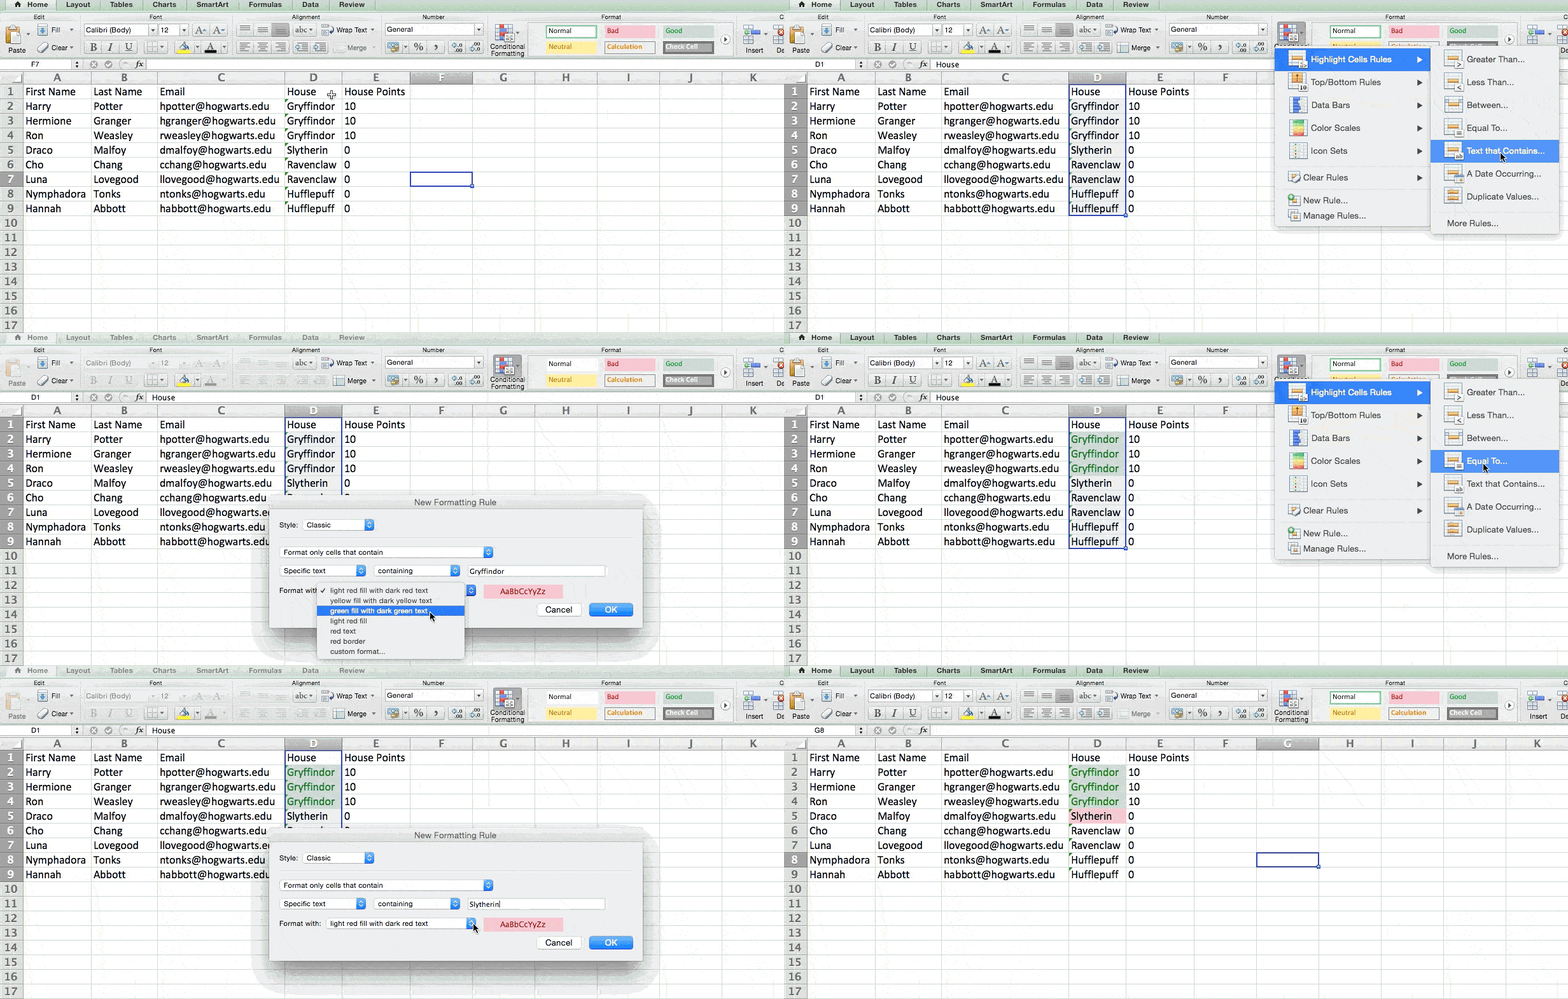
10. Use the IF Excel formula to automate certain Excel functions.
Sometimes, we don’t want to count the number of times a value appears. Instead, we want to input different information into a cell if there is a corresponding cell with that information.
For example, in the situation below, I want to award ten points to everyone who belongs in the Gryffindor house. Instead of manually typing in 10’s next to each Gryffindor student’s name, I can use the IF Excel formula to say that if the student is in Gryffindor, then they should get ten points.
The formula is: IF(logical_test, value_if_true, [value_if_false])
Example Shown Below: =IF(D2=”Gryffindor”,”10″,”0″)
In general terms, the formula would be IF(Logical Test, value of true, value of false). Let’s dig into each of these variables.
- Logical_Test: The logical test is the “IF” part of the statement. In this case, the logic is D2=”Gryffindor” because we want to make sure that the cell corresponding with the student says “Gryffindor.” Make sure to put Gryffindor in quotation marks here.
- Value_if_True: This is what we want the cell to show if the value is true. In this case, we want the cell to show “10” to indicate that the student was awarded the 10 points. Only use quotation marks if you want the result to be text instead of a number.
- Value_if_False: This is what we want the cell to show if the value is false. In this case, for any student not in Gryffindor, we want the cell to show “0”. Only use quotation marks if you want the result to be text instead of a number.
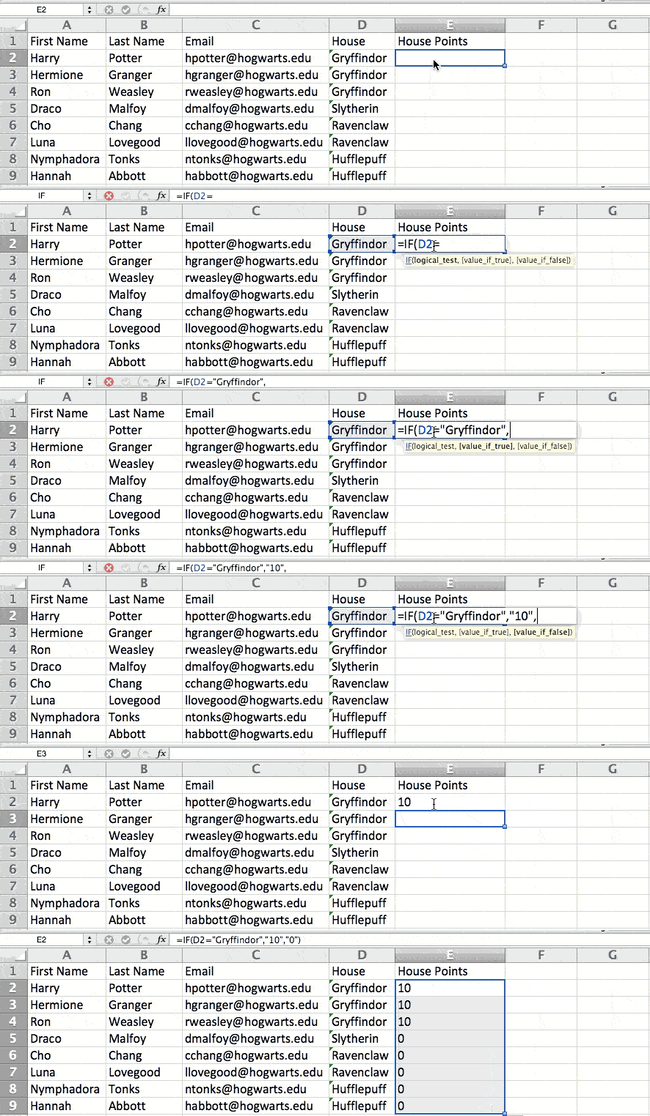
Note: In the example above, I awarded 10 points to everyone in Gryffindor. If I later wanted to sum the total number of points, I wouldn’t be able to because the 10’s are in quotes, thus making them text and not a number that Excel can sum.
11. Use dollar signs to keep one cell’s formula the same regardless of where it moves.
Have you ever seen a dollar sign in an Excel formula? When used in a formula, it isn’t representing an American dollar; instead, it makes sure that the exact column and row are held the same even if you copy the same formula in adjacent rows.
You see, a cell reference — when you refer to cell A5 from cell C5, for example — is relative by default. In that case, you’re actually referring to a cell that’s five columns to the left (C minus A) and in the same row (5). This is called a relative formula. When you copy a relative formula from one cell to another, it’ll adjust the values in the formula based on where it’s moved. But sometimes, we want those values to stay the same no matter whether they’re moved around or not — and we can do that by turning the formula into an absolute formula.
To change the relative formula (=A5+C5) into an absolute formula, we’d precede the row and column values by dollar signs, like this: (=$A$5+$C$5). (Learn more on Microsoft Office’s support page here.)
12. Use the VLOOKUP function to pull data from one area of a sheet to another.
Have you ever had two sets of data on two different spreadsheets that you want to combine into a single spreadsheet?
For example, you might have a list of people’s names next to their email addresses in one spreadsheet, and a list of those same people’s email addresses next to their company names in the other — but you want the names, email addresses, and company names of those people to appear in one place.
I have to combine data sets like this a lot — and when I do, the VLOOKUP is my go-to formula.
Before you use the formula, though, be absolutely sure that you have at least one column that appears identically in both places. Scour your data sets to make sure the column of data you’re using to combine your information is exactly the same, including no extra spaces.
The formula: =VLOOKUP(lookup value, table array, column number, Approximate match (TRUE) or Exact match (FALSE))
The formula with variables from our example below: =VLOOKUP(C2,Sheet2!A:B,2,FALSE)
In this formula, there are several variables. The following is true when you want to combine information in Sheet 1 and Sheet 2 onto Sheet 1.
- Lookup Value: This is the identical value you have in both spreadsheets. Choose the first value in your first spreadsheet. In the example that follows, this means the first email address on the list, or cell 2 (C2).
- Table Array: The table array is the range of columns on Sheet 2 you’re going to pull your data from, including the column of data identical to your lookup value (in our example, email addresses) in Sheet 1 as well as the column of data you’re trying to copy to Sheet 1. In our example, this is “Sheet2!A:B.” “A” means Column A in Sheet 2, which is the column in Sheet 2 where the data identical to our lookup value (email) in Sheet 1 is listed. The “B” means Column B, which contains the information that’s only available in Sheet 2 that you want to translate to Sheet 1.
- Column Number: This tells Excel which column the new data you want to copy to Sheet 1 is located in. In our example, this would be the column that “House” is located in. “House” is the second column in our range of columns (table array), so our column number is 2. [Note: Your range can be more than two columns. For example, if there are three columns on Sheet 2 — Email, Age, and House — and you still want to bring House onto Sheet 1, you can still use a VLOOKUP. You just need to change the “2” to a “3” so it pulls back the value in the third column: =VLOOKUP(C2:Sheet2!A:C,3,false).]
- Approximate Match (TRUE) or Exact Match (FALSE): Use FALSE to ensure you pull in only exact value matches. If you use TRUE, the function will pull in approximate matches.
In the example below, Sheet 1 and Sheet 2 contain lists describing different information about the same people, and the common thread between the two is their email addresses. Let’s say we want to combine both datasets so that all the house information from Sheet 2 translates over to Sheet 1.
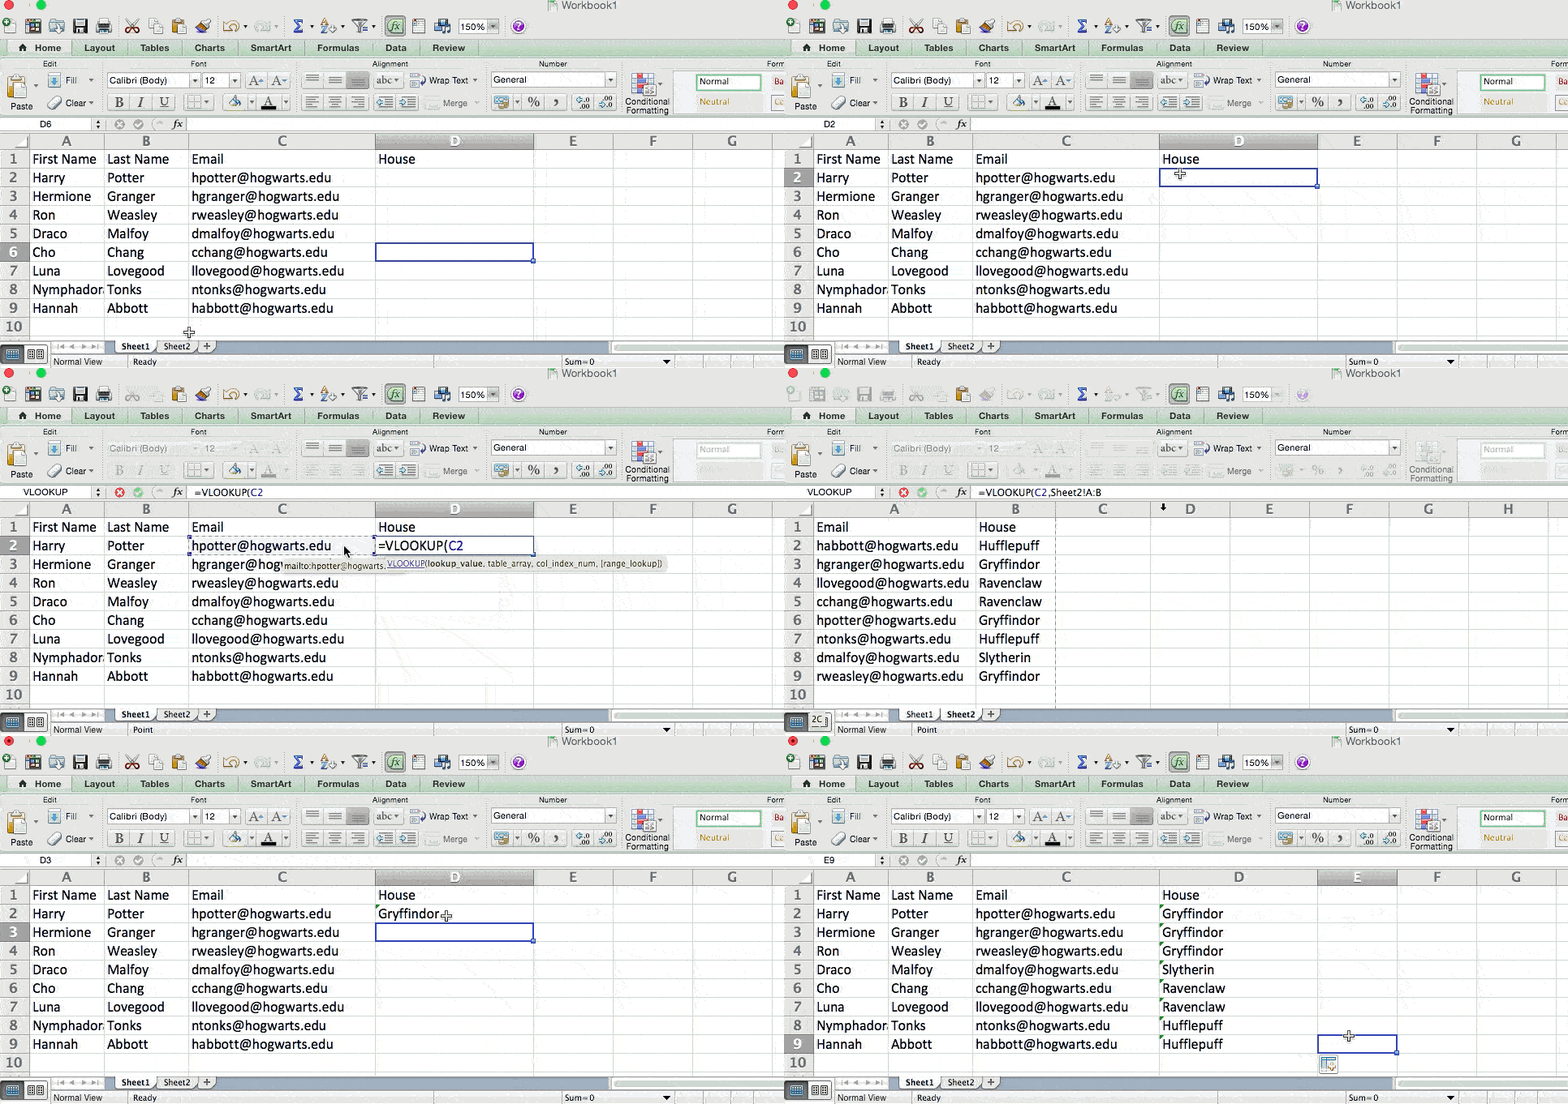
So when we type in the formula =VLOOKUP(C2,Sheet2!A:B,2,FALSE), we bring all the house data into Sheet 1.
Keep in mind that VLOOKUP will only pull back values from the second sheet that are to the right of the column containing your identical data. This can lead to some limitations, which is why some people prefer to use the INDEX and MATCH functions instead.
13. Use INDEX and MATCH formulas to pull data from horizontal columns.
Like VLOOKUP, the INDEX and MATCH functions pull in data from another dataset into one central location. Here are the main differences:
- VLOOKUP is a much simpler formula. If you’re working with large data sets that would require thousands of lookups, using the INDEX and MATCH function will significantly decrease load time in Excel.
- The INDEX and MATCH formulas work right-to-left, whereas VLOOKUP formulas only work as a left-to-right lookup. In other words, if you need to do a lookup that has a lookup column to the right of the results column, then you’d have to rearrange those columns in order to do a VLOOKUP. This can be tedious with large datasets and/or lead to errors.
So if I want to combine information in Sheet 1 and Sheet 2 onto Sheet 1, but the column values in Sheets 1 and 2 aren’t the same, then to do a VLOOKUP, I would need to switch around my columns. In this case, I’d choose to do an INDEX and MATCH instead.
Let’s look at an example. Let’s say Sheet 1 contains a list of people’s names and their Hogwarts email addresses, and Sheet 2 contains a list of people’s email addresses and the Patronus that each student has. (For the non-Harry Potter fans out there, every witch or wizard has an animal guardian called a “Patronus” associated with him or her.) The information that lives in both sheets is the column containing email addresses, but this email address column is in different column numbers on each sheet. I’d use the INDEX and MATCH formulas instead of VLOOKUP so I wouldn’t have to switch any columns around.
So what’s the formula, then? The formula is actually the MATCH formula nested inside the INDEX formula. You’ll see I differentiated the MATCH formula using a different color here.
The formula: =INDEX(table array, MATCH formula)
This becomes: =INDEX(table array, MATCH (lookup_value, lookup_array))
The formula with variables from our example below: =INDEX(Sheet2!A:A,(MATCH(Sheet1!C:C,Sheet2!C:C,0)))
Here are the variables:
- Table Array: The range of columns on Sheet 2 containing the new data you want to bring over to Sheet 1. In our example, “A” means Column A, which contains the “Patronus” information for each person.
- Lookup Value: This is the column in Sheet 1 that contains identical values in both spreadsheets. In the example that follows, this means the “email” column on Sheet 1, which is Column C. So: Sheet1!C:C.
- Lookup Array: This is the column in Sheet 2 that contains identical values in both spreadsheets. In the example that follows, this refers to the “email” column on Sheet 2, which happens to also be Column C. So: Sheet2!C:C.
Once you have your variables straight, type in the INDEX and MATCH formulas in the top-most cell of the blank Patronus column on Sheet 1, where you want the combined information to live.
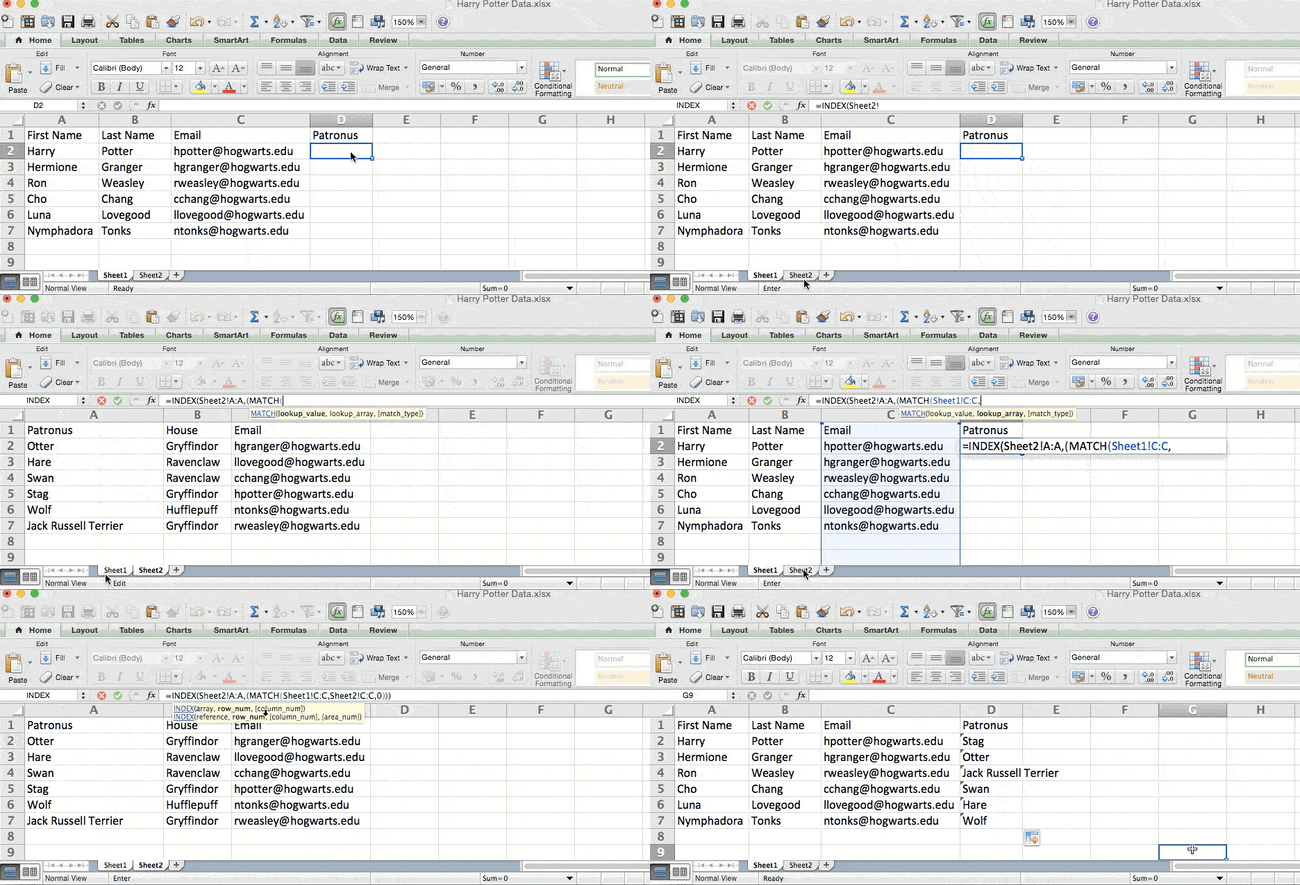
14. Use the COUNTIF function to make Excel count words or numbers in any range of cells.
Instead of manually counting how often a certain value or number appears, let Excel do the work for you. With the COUNTIF function, Excel can count the number of times a word or number appears in any range of cells.
For example, let’s say I want to count the number of times the word “Gryffindor” appears in my data set.
The formula: =COUNTIF(range, criteria)
The formula with variables from our example below: =COUNTIF(D:D,”Gryffindor”)
In this formula, there are several variables:
- Range: The range that we want the formula to cover. In this case, since we’re only focusing on one column, we use “D:D” to indicate that the first and last column are both D. If I were looking at columns C and D, I would use “C:D.”
- Criteria: Whatever number or piece of text you want Excel to count. Only use quotation marks if you want the result to be text instead of a number. In our example, the criteria is “Gryffindor.”
Simply typing in the COUNTIF formula in any cell and pressing “Enter” will show me how many times the word “Gryffindor” appears in the dataset.
15. Combine cells using &.
Databases tend to split out data to make it as exact as possible. For example, instead of having a column that shows a person’s full name, a database might have the data as a first name and then a last name in separate columns. Or, it may have a person’s location separated by city, state, and zip code. In Excel, you can combine cells with different data into one cell by using the “&” sign in your function.
The formula with variables from our example below: =A2&” “&B2
Let’s go through the formula together using an example. Pretend we want to combine first names and last names into full names in a single column. To do this, we’d first put our cursor in the blank cell where we want the full name to appear. Next, we’d highlight one cell that contains a first name, type in an “&” sign, and then highlight a cell with the corresponding last name.
But you’re not finished — if all you type in is =A2&B2, then there will not be a space between the person’s first name and last name. To add that necessary space, use the function =A2&” “&B2. The quotation marks around the space tell Excel to put a space in between the first and last name.
To make this true for multiple rows, simply drag the corner of that first cell downward as shown in the example.
16. Add checkboxes.
If you’re using an Excel sheet to track customer data and want to oversee something that isn’t quantifiable, you could insert checkboxes into a column.
For example, if you’re using an Excel sheet to manage your sales prospects and want to track whether you called them in the last quarter, you could have a “Called this quarter?” column and check off the cells in it when you’ve called the respective client.
Here’s how to do it.
Highlight a cell you’d like to add checkboxes to in your spreadsheet. Then, click DEVELOPER. Then, under FORM CONTROLS, click the checkbox or the selection circle highlighted in the image below.
Once the box appears in the cell, copy it, highlight the cells you also want it to appear in, and then paste it.
17. Hyperlink a cell to a website.
If you’re using your sheet to track social media or website metrics, it can be helpful to have a reference column with the links each row is tracking. If you add a URL directly into Excel, it should automatically be clickable. But, if you have to hyperlink words, such as a page title or the headline of a post you’re tracking, here’s how.
Highlight the words you want to hyperlink, then press Shift K. From there a box will pop up allowing you to place the hyperlink URL. Copy and paste the URL into this box and hit or click Enter.
If the key shortcut isn’t working for any reason, you can also do this manually by highlighting the cell and clicking Insert > Hyperlink.
18. Add drop-down menus.
Sometimes, you’ll be using your spreadsheet to track processes or other qualitative things. Rather than writing words into your sheet repetitively, such as “Yes”, “No”, “Customer Stage”, “Sales Lead”, or “Prospect”, you can use dropdown menus to quickly mark descriptive things about your contacts or whatever you’re tracking.
Here’s how to add drop-downs to your cells.
Highlight the cells you want the drop-downs to be in, then click the Data menu in the top navigation and press Validation.
From there, you’ll see a Data Validation Settings box open. Look at the Allow options, then click Lists and select Drop-down List. Check the In-Cell dropdown button, then press OK.
Other Excel Help Resources
- How to Make a Chart or Graph in Excel [With Video Tutorial]
- Design Tips to Create Beautiful Excel Charts and Graphs
- Totally Free Microsoft Excel Templates That Make Marketing Easier
- How to Learn Excel Online: Free and Paid Resources for Excel Training
Use Excel to Automate Processes in Your Team
Even if you’re not an accountant, you can still use Excel to automate tasks and processes in your team. With the tips and tricks we shared in this post, you’ll be sure to use Excel to its fullest extent and get the most out of the software to grow your business.
Editor’s Note: This post was originally published in August 2017 but has been updated for comprehensiveness.
