
Welcome to My Blog
Project Management Phases: Exploring Phase #2 – Planning
“Planning is bringing the future into the present so that you can do something about it now.” (Alan Lakein) Roli Pathak introduced the 5 phases of project management in her article Top 5 Project Management Phases. Phase #2 is the Planning phase.
You will recall from Project Management Phases: Exploring Phase #1 – Initiation that the final documentation of the initiation phase includes an informal project plan. It contains your team’s task order, estimated resources, and a projected completion date.
Exploring Phase #2 – Planning
Roli stated in her overview “a project management plan is developed comprehensively of individual plans for – cost, scope, duration, quality, communication, risk, and resources.” Let’s take a closer look at each item the project manager and planning team should investigate or fine tune during this phase.
- Costs – Your team will create a plan for cost management detailing every action regarding how you plan and oversee your project costs. Next, you must estimate costs for each activity on that list. From there, your team determines the project budget.
- Scope – With initiation phase documentation in hand, your planning team will make fixed determinations regarding project assignments, costs and outcomes drafting necessary supporting documentation.
- Duration – Your team has refined the scope, so you can add to the planning documentation your estimates for the best-case timing scenario. At this juncture, your planning group will propose what the most likely timeline would be including potential delays, etc.
- Quality – During this step, your team will evaluate and detail how deliverables will adhere to expected quality standards and criteria outlined for by clients, stakeholders, and/or investors. In addition, you will brain storm ideas for process improvement during this stage noting enhancements in the planning documentation.
- Communication – Your project group will describe how you plan to communicate with executive management, etc. as well as define an escalation strategy process.
- Risk – You and your team can use the risk assessment created by decision makers during the initiation proposal step to describe how you will manage those risks. If you identify additional risks, update the project documents. Since a risk can mean a plus or minus impact on the project, your team will outline contingencies for both scenarios.
- Resources – Be sure to consider everything necessary for your team to deliver on the project goals. Include financial resources, equipment needs, supplies, and materials, creating an itemized list.
In her phase 2 introduction, Roli mentioned several important actions and tools unique to this phase. Activities that mark the planning phase are creating a WBS, developing a schedule, using milestone and/or GANTT charts, resource estimation, establishing communication and assessing risk. Here are some brief descriptions for these specific tasks with additional resources for info on each topic.
- WBS – The WBS, work breakdown structure, is an outline your team will use to rank every project task. Your planning group breaks down larger responsibilities on the outline into sub-tasks. Work Breakdown Structure (WBS), the Basic Building Block for a Project Plan
- Scheduling – Define what activities to include in your project, determine the best sequence of tasks and estimate the resources and duration to create your schedule. Time Management for Project Success | How to Avoid Project Failure: Effective Scheduling
- Gantt Charts – A Gantt chart uses horizontal bars to illustrate the progress on the project timeline. What is a Gantt Chart?
- Milestone Charts – Milestone charts serve as an abbreviated visual representation of progress. A milestone indicates an action or responsibility planned at a specific time during the life cycle of a project. This chart type contains triangles to indicate a single date, and you can integrate them into Gantt charts.
The Project Management Question and Answer Book Figure 5-12: MILESTONE CHART
- Resource Estimation – To determine what assets are essential for your project, your team should record each item you intend to use. Be sure to include equipment, human capital and any other materials or financial considerations. Then, you can schedule each expense and distinguish the total cost of the project per activity.
- Communication – Poor communication is one of the most common reasons why projects fail. Good communication requires that you deliver the correct message to the appropriate audience at the best time. Communication Theories Applied on Project Management.
- Risk Assessment – It’s imperative that you and your team assess risks properly. Roli cautioned in her overview of the planning phase that “A plan for managing identified and unidentified risks is determined as this may affect aspects of a project later on. Risk management planning includes risk identification and analysis, risk mitigation approaches, and risk response planning.” Understanding the 4 Types of Risks Involved in Project Management |The Rules of Project Risk Management – A Book Review
Wrap-Up
Take the time to plan thoroughly. Success is contingent upon creating a solid strategy for the project.
Check out these additional resources that detail activities of the planning phase and how to stay on track. 8 Signs You Are Managing Your Project The Wrong Way
The post Project Management Phases: Exploring Phase #2 – Planning appeared first on Project-Management.com.
from Project Management Articles – Project-Management.com http://ift.tt/2bBYU7z
via Project-Management.com
BMW now includes a $300 CarPlay option on almost all its vehicles in US
CarPlay has been a long time coming to BMW, but it now looks like the system is available as a $300 option across almost all models.
We saw back in May that it was on the way to the X5 and X6 M, and a month later the same option appeared for the M3 and M4, suggesting that BMW might have been reserving it for higher-end models. As of today, though, ‘Apple CarPlay Compatibility’ appears as an entertainment option across most of the range …
Filed under: Apple
B&O announces two new AirPlay speakers with 360-degree sound, the BeoSound 1 & 2
Bang & Olufsen has announced two new wireless speakers, featuring a conical design and 360-degree sound projection. Both speakers support Apple’s AirPlay – as well as Google Cast, DNLA and plain old Bluetooth – and are compatible with the company’s BeoLink system for multi-room setups.
B&O has a reputation for great aesthetics and hi-tech features as well as fantastic sound, and Engadget reports that you won’t be disappointed on this score …
Filed under: Apple
Data Visualization 101: How to Choose the Right Chart or Graph for Your Data
You and I sift through a lot of data for our jobs. Data about website performance, sales performance, product adoption, customer service, marketing campaign results … the list goes on.
When you manage multiple content assets, such as social media or a blog, with multiple sources of data, it can get overwhelming. What should you be tracking? What actually matters? How do you visualize and analyze the data so you can extract insights and actionable information?
More importantly, how can you make reporting more efficient when you’re busy working on multiple projects at once?
One of the struggles that slows down my own reporting and analysis is understanding what type of chart to use — and why. That’s because choosing the wrong type of chart or simply defaulting to the most common type of visualization could cause confusion with the viewer or lead to mistaken data interpretation.
Consider this chart from The New York Times‘ project on where people born in a state move to. It visualizes a large amount of data accumulated during more than 100 years. Yet, it is easy to understand, and it clearly highlights interesting trends.
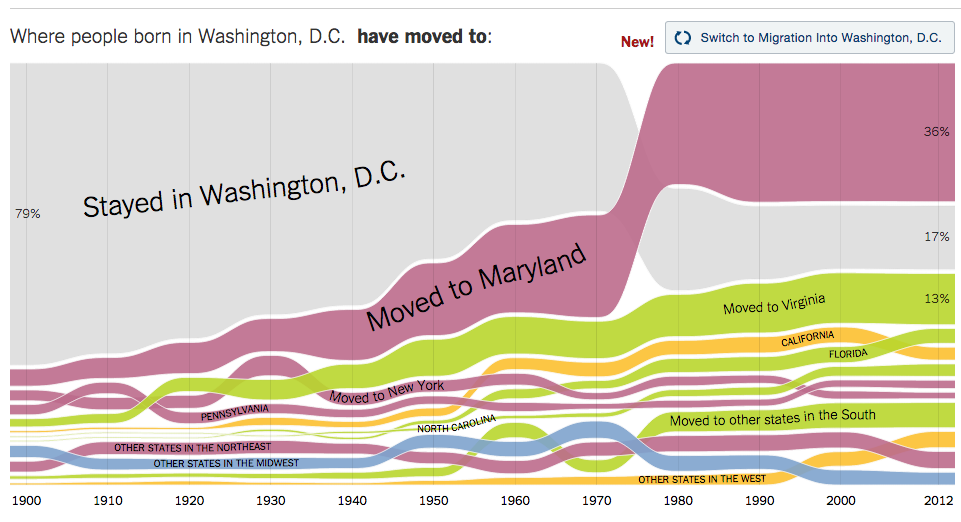
To create charts that clarify and provide the right canvas for analysis, you should first understand the reasons why you might need a chart. In this post, I’ll cover five questions to ask yourself when choosing a chart for your data. Then, I’ll give an overview of 13 different types of charts you have at your disposal.
5 Questions to Ask When Deciding Which Chart to Use
1) Do you want to compare values?
Charts are perfect for comparing one or many value sets, and they can easily show the low and high values in the data sets. To create a comparison chart, use these types of graphs:
- Column
- Bar
- Circular Area
- Line
- Scatter Plot
- Bullet
2) Do you want to show the composition of something?
Use this type of chart to show how individual parts make up the whole of something, such as the device type used for mobile visitors to your website or total sales broken down by sales rep.
To show composition, use these charts:
- Pie
- Stacked Bar
- Stacked Column
- Area
- Waterfall
3) Do you want to understand the distribution of your data?
Distribution charts help you to understand outliers, the normal tendency, and the range of information in your values.
Use these charts to show distribution:
- Scatter Plot
- Line
- Column
- Bar
4) Are you interested in analyzing trends in your data set?
If you want to know more information about how a data set performed during a specific time period, there are specific chart types that do extremely well.
You should choose a:
- Line
- Dual-Axis Line
- Column
5) Do you want to better understand the relationship between value sets?
Relationship charts are suited to showing how one variable relates to one or numerous different variables. You could use this to show how something positively effects, has no effect, or negatively effects another variable.
When trying to establish the relationship between things, use these charts:
- Scatter Plot
- Bubble
- Line
13 Different Types of Charts for Analyzing & Presenting Data
To better understand each chart and how they can be used, here’s an overview of each type of chart.
1) Column
A column chart is used to show a comparison among different items, or it can show a comparison of items over time. You could use this format to see the revenue per landing page or customers by close date.
Design Best Practices for Column Charts:
- Use consistent colors throughout the chart, selecting accent colors to highlight meaningful data points or changes over time.
- Use horizontal labels to improve readability.
- Start the y-axis at 0 to appropriately reflect the values in your graph.
2) Bar
A bar chart, basically a horizontal column chart, should be used to avoid clutter when one data label is long or if you have more than 10 items to compare. This type of visualization can also be used to display negative numbers.
Design Best Practices for Bar Charts:
- Use consistent colors throughout the chart, selecting accent colors to highlight meaningful data points or changes over time.
- Use horizontal labels to improve readability.
- Start the y-axis at 0 to appropriately reflect the values in your graph.
3) Line
A line chart reveals trends or progress over time and can be used to show many different categories of data. You should use it when you chart a continuous data set.
Design Best Practices for Line Charts:
- Use solid lines only.
- Don’t plot more than four lines to avoid visual distractions.
- Use the right height so the lines take up roughly 2/3 of the y-axis’ height.
4) Dual Axis
A dual axis chart allows you to plot data using two y-axes and a shared x-axis. It’s used with three data sets, one of which is based on a continuous set of data and another which is better suited to being grouped by category. This should be used to visualize a correlation or the lack thereof between these three data sets.
Design Best Practices for Dual Axis Charts:
- Use the y-axis on the left side for the primary variable because brains are naturally inclined to look left first.
- Use different graphing styles to illustrate the two data sets, as illustrated above.
- Choose contrasting colors for the two data sets.
5) Area
An area chart is basically a line chart, but the space between the x-axis and the line is filled with a color or pattern. It is useful for showing part-to-whole relations, such as showing individual sales reps’ contribution to total sales for a year. It helps you analyze both overall and individual trend information.
Design Best Practices for Area Charts:
- Use transparent colors so information isn’t obscured in the background.
- Don’t display more than four categories to avoid clutter.
- Organize highly variable data at the top of the chart to make it easy to read.
6) Stacked Bar
This should be used to compare many different items and show the composition of each item being compared.
Design Best Practices for Stacked Bar Charts:
- Best used to illustrate part-to-whole relationships.
- Use contrasting colors for greater clarity.
- Make chart scale large enough to view group sizes in relation to one another.
7) Pie
A pie chart shows a static number and how categories represent part of a whole — the composition of something. A pie chart represents numbers in percentages, and the total sum of all segments needs to equal 100%.
Design Best Practices for Pie Charts:
- Don’t illustrate too many categories to ensure differentiation between slices.
- Ensure that the slice values add up to 100%.
- Order slices according to their size.
8) Scatter Plot
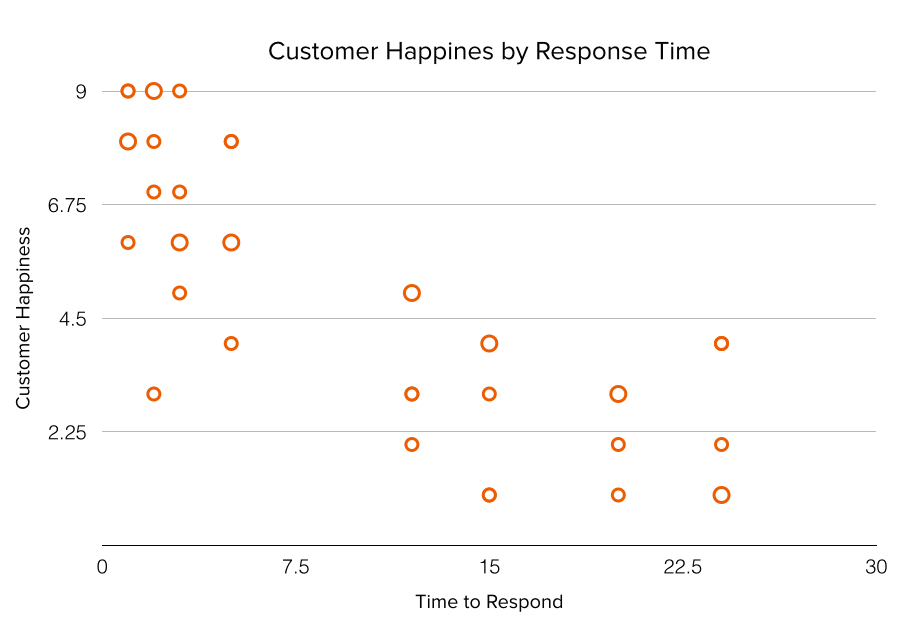
A scatter chart will show the relationship between two different variables or it can reveal the distribution trends. It should be used when there are many different data points, and you want to highlight similarities in the data set. This is useful when looking for outliers or for understanding the distribution of your data.
Design Best Practices for Scatter Plots:
- Include more variables, such as different sizes, to incorporate more data.
- Start y-axis at 0 to represent data accurately.
- If you use trend lines, only use a maximum of two to make your plot easy to understand.
9) Bubble
A bubble chart is similar to a scatter plot in that it can show distribution or relationship. There is a third data set, which is indicated by the size of the bubble or circle.
Design Best Practices for Bubble Charts:
- Scale bubbles according to area, not diameter.
- Make sure labels are clear and visible.
- Use circular shapes only.
10) Waterfall
A waterfall chart should be used to show how an initial value is affected by intermediate values — either positive or negative — and resulted in a final value. This should be used to reveal the composition of a number. An example of this would be to showcase how overall company revenue is influenced by different departments and leads to a specific profit number.
Chart via Baans Consulting
Design Best Practices for Waterfall Charts:
- Use contrasting colors to highlight differences in data sets.
- Choose warm colors to indicate increases and cool colors to indicate decreases.
11) Funnel
A funnel chart shows a series of steps and the completion rate for each step. This can be used to track the sales process or the conversion rate across a series of pages or steps.
Design Best Practices for Funnel Charts:
- Scale the size of each section to accurately reflect the size of the data set.
- Use contrasting colors or one color in gradating hues, from darkest to lightest as the size of the funnel decreases.
12) Bullet
A bullet graph reveals progress toward a goal, compares this to another measure, and provides context in the form of a rating or performance.
Design Best Practices for Bullet Graphs:
- Use contrasting colors to highlight how the data is progressing.
- Use one color in different shades to gauge progress.
13) Heat Map
A heat map shows the relationship between two items and provides rating information, such as high to low or poor to excellent. The rating information is displayed using varying colors or saturation.
Design Best Practices for Heat Map:
- Use a basic and clear map outline to avoid distracting from the data.
- Use a single color in varying shades to show changes in data.
- Avoid using multiple patterns.
What tips do you have for visualizing data? Check out our ebook on how to use data to win over your audience, and share your tips in the comments below!
Editor’s Note: This post was originally published in May 2015 and has been updated for accuracy and comprehensiveness.
Apple’s effective Irish tax rate of 0.005% described as ‘brazen’ and ‘unsustainable’
After it was revealed that Apple paid an effective tax rate on its European profits of just 0.005% in 2014, a local tax and advisory firm has said that while other multinational companies had similar arrangements with Ireland, Apple’s deal was ‘the most brazen.’ The comment was made by Aisling Donohue, a partner at tax and business advisory firm MGPartners, reports Bloomberg.
The European Commission yesterday ordered the Irish government to recover €13B ($15B) in taxation from Apple after it was ruled to have offered the company illegal tax breaks. Apple is appealing the ruling.
Netflix says that it believes that the type of tax avoidance measures employed by Apple and other U.S. tech companies are ‘unsustainable’ …
Filed under: Apple
Court rejects Monster founder’s claim that Beats tricked him out of his share of Apple’s $3B
AP reports that an LA judge has dismissed a claim by Monster founder and former Beats shareholder that the company tricked him out of his share of the company prior to its acquisition by Apple. Noel Lee had claimed that double-dealing and misrepresentation by Dr. Dre and Jimmy Iovine cost him a between $30M and $150M.
Lee filed the lawsuit back in January of 2015, making two main claims against Beats. The first alleged that the company entered a ‘sham’ deal with a smartphone maker, selling 51% of the company to HTC before later buying it back. The sale triggered a clause in the contract that ended the partnership between Beats and Monster …
Filed under: Apple
Leaked ‘iPhone 7 Plus’ packaging indicates Lightning EarPods and Lightning 3.5mm headphone jack adaptor bundled in the box
An interesting image is making the rounds today: a photograph of a purported packaging insert for Apple’s upcoming new phone. If the photo is to be believed, Apple will indeed be calling its larger new phone the ‘iPhone 7 Plus’, with the ‘iPhone 7’ name being taken by the 4.7 inch sibling.
It also indicates that Apple will be bundling Lightning EarPods in the box with every iPhone 7, as a consequence of the missing 3.5mm headphone jack. More interestingly, the leak suggests Apple will also be including a Lightning to 3.5mm Headphone Jack adaptor as a bundled accessory.
Full photo of the pamphlet after the jump …
Filed under: Apple
5 Ways to Enhance YouTube Videos for Marketers
Do you use YouTube for your business? Looking for ways to create more visibility for your videos? YouTube offers a number of helpful features to optimize your videos for more views, subscribers, or conversions. In this article, you’ll discover five ways to improve the performance of your YouTube videos. #1: Add a Watermark to Your […]
This post 5 Ways to Enhance YouTube Videos for Marketers first appeared on .
– Your Guide to the Social Media Jungle
from http://ift.tt/2bUZIYe
via socialmediaexaminer
8 Time Management Tips to Help You Hit Your Long-Term Deadlines
While intended to make life easier, sometimes putting together a to-do list can feel like a bigger undertaking than accomplishing the actual tasks at hand. This concept is referred to as the procrastination “doom loop” — a cycle of putting off tasks, feeling anxiety and guilt, and consequently working with lower productivity and efficiency due to these negative feelings.
This is especially true when it comes to long-term projects, as it can be easy to lose focus and diligence when working toward monthly or quarterly deadlines. But when you’re forced to work as your own project manager, organization is the name of the game.
8 Time Management Tips to Help You Hit Your Long-Term Deadlines
1) Set short-term SMART goals to benchmark your success, and don’t be afraid to adjust them.
If your long-term goal is months away, and the final product is the completion of a large project, such as an ebook publication or new product launch, short-term benchmarks for success will keep you on track and help you stay motivated and productive throughout the process.
We recommend setting SMART goals, which stands for:
Specific
Ensure that your short-term goals are as specific as your final goal. For example, instead of “work on ebook every day for three months,” set a specific goal to complete a certain amount of pages each week. Specific goals are easier to track and report on and more difficult to de-prioritize.
Measurable
Trackable goals allow you to measure your progress toward your final goal and report on your successes and challenges. If your long-term goal is to launch a social media campaign, a measurable short-term goal would be “secure one press mention per week” in lieu of “spread campaign awareness.”
Attainable
According to Harvard Business Review, being challenged is motivating, but working towards goals that you can’t reach is not. Establish goals that you can work to achieve and not be discouraged by. For example, it may not be attainable for your branded hashtag to start #trending on Twitter. Instead, you could aim to get a thought leader in your space to tweet using your hashtag to generate awareness on social media.
Realistic
When you’re strategizing for a big project, plan for the unexpected in the same way that you plan for success. Don’t be dishonest with yourself or your team about your daily productivity potential or how long different processes could take working toward the final goal. With eight hours in a typical workday, make sure you’re not biting off more than you can chew.
Time-Bound
Set mini-deadlines for yourself throughout the project timeline to give you a rough outline of what metrics you should be hitting each week. This approach helps break up your larger project into more achievable sections to prioritize. Balance your deadlines to provide you with motivation and some urgency, but if the deadline is too high-pressure and unrealistic, your creativity and productivity could actually diminish, based on results from a Harvard Business School study.
The key to setting these shorter-term benchmarks is flexibility, according to psychologist Tamar Chansky. Throughout your process, ensure that you are checking to ensure that these smaller goals are staying SMART — with emphasis on “realistic.”
If you’re falling behind on a deadline or a process is proving more challenging than anticipated, adjust your measures of success to stay on-track.
2) Create a reverse to-do list for your projects.
When working on a deadline that is a month or more away, my favorite strategy for project management is a reverse to-do list, which I create by starting with my final, long-term deadline, then working backwards by building in milestones to complete during the process.
Here’s an example of how I might use this approach when planning for an ebook launch:
It’s important to keep updating the deadlines and timeframes as your project evolves to account for any delays or unanticipated challenges to keep yourself on track.
Another key for making this a successful tool is building buffer time into your mini-deadlines to account for those delays. Even if it doesn’t normally take you a full week to incorporate edits, building extra days into each mini-deadline will ensure that your final deadline isn’t delayed by obstacles earlier in the process.
These mini-deadlines help promote prioritization of important tasks and prevent burnout, according to Harvard Business Review.
3) Create accountability for yourself.
You may be responsible for keeping track of your progress toward achieving your goal, and holding yourself accountable to the timelines and benchmarks you’ve established will help you stay motivated and positive at work.
Personal accountability leads to increased feelings of workplace satisfaction, creativity, and innovation, and there are a few ways to promote that while working on your long-term project, including:
- Sharing progress toward goals with others. For some people, being vocal about your goals and progress can make a huge difference. For example, one study found that participants in weight-loss programs are more motivated and likely to succeed if they share progress photos on social media.
- Setting up a personal reward system for each benchmark you achieve on the path to project completion. Our brains are wired to be more productive the more we achieve goals and reward ourselves, so be sure to keep progress benchmarks short-term and realistic.
- Tracking your progress so you can visualize what portion of your project you’ve successfully completed. Measuring progress helps you to evaluate your weaknesses, celebrate your strengths, and see the bigger picture of how your project is unfolding.
- Being honest with yourself and your colleagues about your achievements. If you’re transparent about what you are (or aren’t) able to achieve in a given timeframe, your experience will inform future strategy for long-term projects. This may take the shape of an informal conversation or an official performance review; in any case, be positive, focus on your achievements, and maintaining a growth mindset about your weaknesses to continually identify ways to improve and continue to excel.
4) Use a responsive to-do list.
If you’re working on a deadline that’s months away, flexibility is a must. You’ll need to be able to multitask, re-prioritize, and press pause on one piece of your project to focus on another depending on your organization’s needs. Responsive to-do lists and organizational tools are helpful ways to keep track of the various elements of a long-term project and to track daily, weekly, and monthly priorities all in one place. Check out tools that allow you to customize different types of lists, such as:
- Asana allows teams to create collaborative to-do lists and project management lists (Free for up to 15 users; Premium available for $8.33/member/month)
- Trello allows users to customize the names of their to-do lists, share them among their team members, and assign them to different people using due dates (Free for Basic; $9.99/user/month for Business Class; $20.83/user/year for Enterprise)
- todoist allows users to share unlimited tasks with colleagues and edit to-do lists offline (Free for Basic; $29/year for Premium)
- Google Keep is a digital sticky-note system that syncs to Google Drive (Free)
5) Create a schedule where you can be most productive.
Adam Rogers suggests finding your “biological prime time,” as coined by Sam Carpenter, author of Work the System, as key to becoming a more productive writer. This time can vary from person to person, but according to the Harvard Business Review, many traditional work schedules go against our natural circadian sleep rhythms that determine our peak and low energy levels.
Researcher Christopher Barnes learned that workers typically approach peak productivity around 12 p.m. and experience a sharp decline at roughly 3 p.m.. Towards the end of the afternoon, energy starts to return again, with another peak around 6 p.m..
The lesson here? Plan your most important tasks around these energy peaks, and your least important tasks around these lows. Barnes notes that this is not typical of many workers, who spend their mornings responding to emails and completing other administrative tasks, but who don’t start tackling bigger challenges requiring high levels of productivity until they have already missed their 12 p.m. peak and begun approaching the 3 p.m. slump.
Try to create a daily schedule that allows you to get the most out of your high-energy times, and if it operates contrary to the rest of your organization, communicate that with your supervisor.
In the example calendar below, events requiring higher levels of productivity and cognitive thought, such as meetings, presentations, and writing, are scheduled around peak productivity times. In contrast, answering emails and eating lunch are scheduled near productivity dips because, unless the emails are time-sensitive, these to-dos aren’t typically top-priority and can be scheduled around bigger tasks.
This isn’t an exact science, so finding your ideal schedule may require some testing to determine when you’re most efficient and when you hit that afternoon slump.
6) Ask for help when you need it.
This is necessary advice for anyone working on a team, as using resources around you is integral to most workplace success, according to Fortune. If you’re being tripped up by an obstacle, are experiencing a production delay, or simply have writer’s block that could throw a wrench in your timeline, and you should use resources around you for guidance and assistance.
This is particularly essential if your deadlines are for finished products months in advance. Missing one internal mini-deadline probably won’t be an insurmountable issue, but if you’re consistently falling behind on benchmarks towards the final goal, staying silent and trying to fix the problem yourself could result in a missed deadline.
Don’t be afraid to reach out to peers or managers for help with brainstorming, editing, or any other roadblock you might be encountering. They would rather you reached out for help before missing a deadline than after missing a deadline, and remember: the most successful people ask for help.
Lean on resources around you to make your life easier and your project better, but remember to be a good coworker, too. When you’re asking for help:
- Outline your SMART goals so your colleagues understand your project.
- Provide them with resources, such as project specs or prior drafts, to make it easier to help you.
- Be specific about what you’re asking for and when your deadlines are.
- Say thank you! Acknowledge their above-and-beyond efforts by letting their supervisor know how they collaborated with you and offering to return the favor with one of their projects.
- Offer help to colleagues on a regular basis, not just when you need help, to cultivate good faith in your workplace so you’re a person people want to help again in the future.
7) Commit to work-life balance.
When your project requires months of hard work, it might feel difficult to step away from your desk or computer at the end of each day with so much left to complete. However, you shouldn’t give in to the temptation of workaholism.
According to the Organization for Economic Cooperation and Development, working long (more than 50) hours can negatively impact your levels of productivity, innovation, and efficiency.
Even if you can’t turn in your final product right away, you shouldn’t stay at work burning the midnight oil trying to get it done early. You’ll work more efficiently by setting daily priorities that allow you to step away from work and recharge once you’ve completed them.
8) Analyze and report on successes and challenges of projects for future goal-setting.
Once you’ve successfully completed a long-term project, don’t move on to the next one without first reflecting on your strategies for project management. What went well, and perhaps more importantly, what didn’t?
If your work is primarily comprised of long-term projects, you will need to continually refine and improve your approach to be as efficient as possible. Document your processes and share them with your team so they can learn from your triumphs and struggles for their projects as well.
Just because your deadline is months away doesn’t mean that you shouldn’t start planning and strategizing for it today. Once you’re ready to dive into a project, learn more about strategies for successful, and not overwhelming, priority-setting and project management.
What are your tips and tricks for project management strategies? Share with us in the comments below!
What Do Agency Employees Really Want? [Survey]
Employees are the lifeblood of the agency business, and maintaining a productive and engaged workforce is one of the most challenging aspects of running an agency. But it can be hard for owners to understand the attitudes and goals of an increasingly diverse workforce, and employees may find it difficult to give honest feedback anonymously.
To find out how the attitudes of agency employees shape their goals and opinions about agency work, HubSpot is partnering in a new Agency Employee Attitudes Survey.
The survey is anonymous, and should take less than 15 minutes to complete. Respondents who participate by September 15th can enter to win a $250 Amazon.com gift card.
TAKE THE AGENCY EMPLOYEE SURVEY
The results of this study will be presented at INBOUND 2016 in November.
The Agency Employee Attitudes Survey explores topics such as:
- How do agency employees view the importance of work, play, and balancing the two?
- What expectations do they have from their agency employers, and how do they view their own responsibilities?
- How do they compare the pros and cons of working in an agency versus in a client-side organization?
- How did they first choose to work in an agency, and how likely would they be to recommend an agency career to others?
- Which features and benefits of an agency career are most important to them?
- Do millennial employees actually feel differently about work than other age groups?
- How can agency owners better understand their employees and offer them features and benefits they will value?
All participants can get free access to the results, which will be shared for the first time at HubSpot’s INBOUND Conference in November 2016.
Corning unveils Gorilla Glass SR+ offering for wearables, possibly headed to the Apple Watch
Just a month after introducing Gorilla Glass 5 for smartphones, Corning today has introduced Gorilla Glass SR+, its new cover glass for smartwatches. In 2015, Corning announced “Project Phire,” which was said to be its efforts to create a material for wearables that combines the durability of Gorilla Glass with the scratch-resistance level of sapphire. A year later, we have Gorilla Glass SR+ and it’s ready to hit the market now…
Filed under: Apple
First hands-on with third-party app integration in Siri calls it a ‘long-overdue’ update
At WWDC earlier this summer, Apple announced that iOS 10 would bring a host of new features to its Siri virtual assistant, the biggest of which being integration with third-party applications. With the public launch of iOS 10 nearing, Nathan Olivarez-Giles of the WSJ has had an opportunity to go hands-on with the more capable and more powerful Siri, calling it a “long-overdue” enhancement…
Filed under: Apple
Apple launches $20/mo 2TB iCloud storage plan ahead of iPhone 7 event
Apple has launched a new 2TB iCloud storage tier a little over a week out from the iPhone 7 launch event. The new 2TB plan, which is its largest plan available, will set users back $19.99 a month.
Filed under: Apple
Apple’s Austin campus evacuated due to solar panel fire on roof
Comment: iPhone killed the point-and-shoot, now the iPhone 7 is coming after DSLRs
The new iPhones might look strikingly similar to outgoing models, but just because the casing looks familiar doesn’t mean that it should be dismissed as more of the same. Why? Because at least one of the new iPhone 7 models will likely feature major camera improvements that make the iPhone much more competitive with standalone shooters.
more…
Filed under: Apple
Snapchat simplifies geofilter creation, brings new customization tools to iOS app
9to5Toys Lunch Break: Stainless Steel 42mm Apple Watch $200, Belkin surge protector $14, AirPort Express $40, more
Keep up with the best gear and deals on the web by signing up for the 9to5Toys Newsletter. Also, be sure to check us out on: Twitter, RSS Feed, Facebook, Google+ and Safari push notifications.
TODAY’S CAN’T MISS DEALS:
Save big on the Space Black Stainless Steel 42mm Apple Watch (Geek Squad refurb): $200 shipped (Orig. $599)
Belkin’s travel size 3-outlet surge protector includes a pair of USB ports: $14 Prime shipped (Reg. $20+)
Daily Deals: Apple AirPort Express Base Station (Refurb) $40, Foscam Wireless/Wired Network Camera $65, more
Save $100 on Apple’s Time Capsule 802.11ac Wi-Fi Router and enjoy “effortless back ups” – 2TB $199 or 3TB $299
Save up to $199 on Apple iPad Air 2 including Cellular configurations: Wi-Fi 16GB $300 shipped (Reg. $399), more
Apple’s powerful 13-inch Retina MacBook Pro 256GB is now $299 off: $1,200 shipped
Spigen launches iPhone 7 & 7 Plus cases available now ahead of Apple’s event
Assassin’s Creed Identity for iOS is now matching its lowest price ever: $3 (Reg. $5)
App Store Free App of the Week: MindNode for iOS/Apple Watch goes free for the first time (Reg. $10)
The new Riptide Renegade hydro-jet racer title for iOS is now $3 (Reg. up to $10)
The best DJI Phantom Accessories to take your flights to the next level: filters, lenses, backpacks, more
MORE NEW GEAR FROM TODAY:
Store documents, pictures, and more: SanDisk Ultra 16GB USB 3.0 Flash Drive $6 Prime shipped (Orig. $22)
- This Brother All-in-One Printer with AirPrint is priced to move at $50 shipped (Orig. $100)
- 15-inch Acer Chromebook 4GB/32GB/HDMI out: $347 shipped (Reg. $425+)
- Vantrue’s N1 Mini 1080p Dash Cam on sale for $60 shipped (Reg. $90)
- Office Supplies: 12-Pack Gel Pens $11, 24-Pack Sharpies $10, 60-Pack Glue Sticks $14, more
- Games/Apps: Dust Elysian Tale $1, LIMBO $1, iOS freebies, more
- Smartphone Accessories: Klipsch GiG Bluetooth/NFC Speaker $50 shipped (Reg. $65), more
MORE DEALS STILL LIVE:
The WD 2TB My Passport Ultra USB 3.0 Portable Hard Drive is on sale for $70 shipped (Reg. $90)
Store your data in style: Samsung 128GB Metal USB 3.0 Flash Drive $30 shipped (Orig. $40)
Filed under: Apple
Limited time only: 40% off all 9to5Mac Academy courses
9to5Academy is proud to offer the web’s best online courses at the lowest prices–everything from web development to design, and much more. That’s why we’re excited to announce a storewide 40% off sale on all the courses in our Academy, running through August 31, 2016.
All our courses are an additional 40% off with use of coupon code 40SALE. If you need pointers as to where to start, we’ve highlighted a few courses for you:
Interested in becoming a well-rounded web designer? Grab The Start-to-Finish Web Design Bundle (just $50, or 89% off). It offers 5 premium courses on all things web design: Photoshop, HTML5 and CSS3, front-end development, mobile design, and more. You’ll learn not just how to code your site from scratch, but also give it a sleek design certain to impress users.
If you’re into iOS development, dive into The Complete iOS 9 & 10 Development Bundle (just $35, or 94% off). This course collection features 30 hours of content on Swift, Xcode, SiriKit, and more to help you master Apple’s biggest mobile update yet. You’ll learn from renowned instructor Rob Percival, and even get in on a bonus course on iOS 9 to sharpen your skills.
Or if hacking for a living appeals to you, the Become an Ethical Hacker Bonus Bundle (just $49, or 92% off) is your ticket. This collection features nine courses on all things penetration testing, or the act of hacking a system’s defenses in order to reveal (and shore up) weaknesses. You’ll learn everything you need to hack for the good guys–and make a pretty penny in the process.
This is a limited time offer so jump in soon!
Filed under: Apple