
Welcome to My Blog
How to Write a Professional Resignation Letter [Samples + Template]
Telling your boss that you’re leaving the company is never an easy conversation.
But a respectful resignation letter can mean the difference between an awkward goodbye, and a chance for a long-term professional connection.
Ideally, you’ll provide a resignation letter two weeks before you leave the company. A resignation letter lets you officially announce your termination at the company, and also provides important housekeeping information, like your last day and other details about your departure.
Arming yourself with a powerful resignation letter helps you ensure a positive conversation with your boss, and a smooth transition to your next journey.
But how do you write a good resignation letter? What should you include, and exclude?
Writing a resignation letter can feel like a daunting task, so we’ve created a professional resignation letter template to get you started, and included examples for inspiration.
How to Write a Professional Resignation Letter (Template)
Below is a professional resignation letter template. Remember, your letter should be brief, and only include relevant and helpful information. Don’t focus on the advantages of your next role. Instead, take the time to reflect on any appreciation you feel for the company you’re leaving behind.
Your Name
Your Address
Your City, State, Zip Code
Your Phone Number
Your Email
Date
Name
Title
Organization
Address
City, State, Zip Code
Dear Mr./Ms. Last Name:
I would like to inform you that I am resigning from my position as X for Company A, effective December 21.
I appreciate the opportunities for professional development that you have provided me over the past two years. I have enjoyed my tenure at Company A, and in particular feel honored to have been apart of such a supportive team.
If I can be of any help during this transition, please let me know. I am available to help train my replacement, and will ensure all my reports are updated before my last day of work.
Thank you again for the opportunity to work at Company A. I wish you all the best and look forward to staying in touch. You can email me at X.
Sincerely,
Your Signature (hard copy letter)
Your Typed Name
Paragraph 1: Identify yourself.
Begin your letter by stating your position, and the company. This might seem superfluous if you work at a small company and your boss knows you well, but since the letter is your official termination, it’s important to include. Then, quickly follow this information with a simple statement of your resignation.
Also, providing an end date in the first body paragraph is helpful, since that’s one of the first questions your employer is going to have.
Paragraph 2: Reflect on the positives.
Take the time to consider how you’ve grown, or what you’ve appreciated most about your time at the company. Be as specific as possible — perhaps the company provided professional development opportunities, or maybe you’ve appreciated the climate the company fostered, and the supportive atmosphere. It’s nice for your employer to receive a thank you for the time and resources she’s used to support your career growth.
If you’d like, you can include where you’re headed next, too. If you’re switching industries to pursue a passion, or going to graduate school, it might be appropriate to include. However, if you’re leaving the company for a competitor, you might feel it better to omit.
Paragraph 3: Offer to assist in the transition.
In the third paragraph, mention your willingness to make the transition easier. I’ve written, “I am available to help train my replacement, and will ensure all my reports are updated …” This sentence might look different for you; regardless of what you write, it’s impressive if you include specific details regarding how you’ll help.
*Paragraph 4: Outline your workload.
As an optional follow-up paragraph, briefly review the work you’ll be surrendering when you officially leave the company. Although it is technically your manager’s responsibility to pick this work up and determine how it will continue, it’s helpful to list all the projects and tasks you’ve been in charge of to make the transition even easier on the company in the interim.
This is especially true if you managed any direct reports or collaborated with other departments.
*Paragraph 5: Provide personal contact information.
Lastly, I’ve written, “You can email me at X.” This is optional, but if you truly want to keep in touch with your old employer or use her as a resource, it might be a good addition.
*These two paragraphs are optional sections. Depending on your position and your relationship with the company, you might not need to include.
Resignation Letter Samples
With the above template in mind, let’s take a look at a few sample resignation letters for different positions, each of them taking a slightly different but amicable tone to their resignations.
Sample 1
Focuses: Gratitude, new opportunity, contact info
Dear Mr./Ms. Last Name:
I would like to inform you that I am resigning from my position as Data Analyst for Company A, effective January 3.
I appreciate the opportunities for professional development that you have provided me over the past four years. I have enjoyed my tenure at Company A, and feel grateful to have started my career alongside such a dedicated team.
I have accepted a teaching position in Virginia. While my experience at Company A was rewarding, I’m excited to pursue my passion for teaching.
If I can be of any help during this transition, please let me know. I am willing to help out with freelance work until you find a replacement.
Thank you again for the opportunity to work at Company A. I wish you all the best and look forward to staying in touch. You can email me at X.
Sincerely,
Caroline
Sample 2
Focuses: Brevity, Gratitude
Dear Mr./Ms. Last Name:
Please accept this letter of resignation from my position as content creator at Company Y. My last day of employment will be June 1.
It has been a pleasure working with you and the team for the past two years. In particular, I’ve enjoyed tackling extensive copywriting projects as the business has grown. I’m very appreciative for the opportunities to develop my skills in the field, and want to thank you for all your guidance and insight. I wish your company much success.
Please let me know if you need any assistance with the transition.
Sincerely,
Caroline

Why This New VR Headset Could Be a Game-Changer
There are some days that make us want to escape reality. And it could be said that there’s no better place to do that than a conference dedicated entirely to virtual reality (VR).
This week saw the fifth occurrence of Oculus Connect: Facebook’s annual VR conference. And while this year was a bit skimpy on flashy product announcements, it did see the debut of the latest in the company’s line of VR headsets, the Oculus Quest.
A natural skeptic, I wondered what made the Quest so special. What merited its $399 price tag (as opposed to the $199 Go, an earlier wireless Oculus headset)? And why did Facebook CEO Mark Zuckerberg describe it as “just wonderful” during the event’s opening keynote?
FB has been prototyping this for a while under the code name Project Santa Cruz. Now it’s an official consumer product.
“It’s just wonderful,” Zuckerberg says https://t.co/CJbZrTIAkE
— Kurt Wagner (@KurtWagner8)
September 26, 2018
To find out, I decided to take it for a spin.
The Oculus Quest Experience
Whenever I try a new VR headset, I immediately have to warn the person running the demo that I historically get motion sickness from the technology.
I’m not alone (that’s probably why they keep a bowl of ginger candies at the demo stations) but with the Oculus’s two existing headsets, the Rift and the Go, I’ve had to end the demonstrations after only a few minutes.
But the gentleman running this demo, Thomas, told me that this experience might be different. “A lot of people have told me that,” he said, “and then tell me they don’t have that experience with the Quest.”
Sure, Thomas. I’ll believe that when I see it.
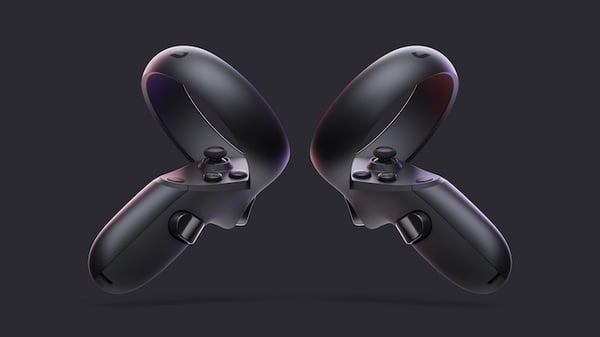
Oculus Quest controllers
As I put on the headset and controllers, and the game commenced, two things were immediately apparent to me: 1) how much more intuitive the hand controls felt, and 2) how much more realistic the visuals seemed.
The game was Superhot: an almost dystopian-like scenario in an airport setting, where the player has to destroy her enemies (which come in the form of opaque red, mannequin-like creatures) by punching them, or grabbing and throwing whatever nearby objects she can find at them.

Source: Oculus
It felt less like I was in a game — and more like I could actually walk around the environment portrayed, duck for cover, and hide when my enemies where coming for me (I was sweating by the time my demo was over). Throwing virtual clay pots at my adversaries felt quite natural — so much, Thomas told me at the end of my seven minutes, I won the game.
The coolest part about this game in particular was how it forced me to slow down. The faster the player moves, it turns out, the faster the enemies move toward her. Not only was it actually fun for a non-gaming-enthusiast like myself, but it was also a bit of an exercise in self-moderation.
Even better: No motion sickness.
But what was to explain for these three stark distinctions — the ease of the controls, the natural feel of the environment and movement through the game, and the lack of motion sickness? What differentiated my Oculus Quest experience from those with the Go and Rift?
To find out, I spoke with Allison Berliner, a product marketing manager for the Oculus Quest, and Andrea Schubert, the company’s product communications lead.
The Tech Behind the Experience
First of all, I had to know: Why was my motion sickness non-existent while using the Quest?
Berliner explained that it all comes down to Oculus Insight: the headset’s four wide-angled sensors, which understand the user’s physical environment, and where she is within that space.
“The tracking is super accurate and super reliable,” Berliner said, “and that’s why it feels really comfortable.”
I wondered if that had something to do with the green grid that would pop up whenever I was about to crash into a wall. It did.
As it turns out, the folks at Oculus were able to “tell” the headset and the game what that physical player environment looked like through a system called Guardian, which lets users know when they’re about to step out of the game’s bounds.

The Oculus boundary system. Source: Oculus
And once the Oculus Quest ships this spring, users will be able to dictate their own environments in the same way.
Then what’s to explain for the natural feeling of the movement? I asked Berliner if it had something to do with the somewhat elusive concept of “six degrees of freedom” (6DOF): the ability of a single, physical body to move freely throughout a three-dimensional space.
“Exactly!” she told me. “The reason it feels really fluid and free is because you have the six degrees of freedom, which is all about the kinds of movements you can do while you’re being tracked” by the VR platform.
Why the Oculus Quest Is a Game-Changer
Since the physical and emotional experience of using the Quest was so saliently different from those I had with other headsets — no motion sickness, intuitive movement, and actual fun — I wondered how else it might be put to use. Could this platform be a game-changer for those in marketing or non-gaming sectors?
“We’re seeing a lot of interesting use cases for VR in general — for healthcare, for education, for training,” Berliner said. “I think it’ll be great to see how the same partners and consumers using the Oculus Go and Oculus Rift for those other industries can do with the Oculus Quest.”
The area of healthcare was of particular interest. With the ease of movement on the Oculus Quest, perhaps it could be used for things like rehabilitation or injury recovery.
It reminded me of something that a gentleman named Steve from DrashVR — which develops educational programs and curricula in VR — told me on day one of Oculus Connect.
.jpg?t=1538153709072&width=600&name=Oculus_Quest_Back%20(2).jpg)
“You can cram a lot more information that’s ‘learning by accident’ or ‘learning by play’ when it’s in VR,” he said. “That’s the feedback I’ve heard first-hand: that people can learn more from 10 minutes of VR than in a semester of classes.”
So if VR for educational purposes could be that effective on earlier, less precise platforms, was their potential on the Quest even greater, especially with such freedom of movement?
“We’re all really interested to see how Oculus Quest changes not only how people play games and people build games,” Berliner said, “but also how people learn and communicate, and connect with each other.”
Kind of like reenacting Gettysburg, without actually visiting the battlefield?
Berliner laughed. “Virtual field trips are super exciting.”
But as admittedly remarkable as the Quest experience is, I did wonder if it was enough to make VR go mainstream. As Zuckerberg himself acknowledged on day one, the company is less than 1% of its way to the goal of getting one billion people in VR.
Zuck is feeling funny today. Here’s a graphic showing the progress to his projection/goal last year of getting 1 billion people into VR #oc5 pic.twitter.com/hsHmmIo0s9
— Amanda Zantal-Wiener (@Amanda_ZW)
September 26, 2018
So what will make VR go mainstream? Ask Berliner, and she’ll tell you — it’s offering options to all users, no matter which industries they’re in.
“The combination of completing this first generation of products means that now we have a great set and a great portfolio,” she said. “Anybody who wants to do something in VR should be able to find the product for them.”
So there’s the marketing lesson — not just the principle of offering options for your audience, but in a way to leverage VR for your overall strategy. What does your audience want to do in VR, or where could VR enhance an already existing experience, and how can you create that experience?
Berliner encouraged leaning into the narrative — and Oculus’s own credo — of breaking down distance barriers. Put the user somewhere they want to be, she emphasized, especially when they can’t get there without your help.
“It comes down to our vision of defying distance. There are moments when you just can’t be [somewhere],” she said. “That’s where virtual reality can play such a huge role.”

The Straightforward Guide to Twitter Analytics
When it launched in 2014, Twitter Analytics marked a solid (if long overdue) move toward greater transparency and measurement abilities for all its users.
Since then, Twitter has continued to make upgrades to the tool, having created a standalone analytics app called Engage in 2016 and launching analytics for Twitter Moments.
Though users now have more insight into their Twitter account metrics, you might not be using this data to its full potential.
Perhaps you’ve poked around the Twitter Analytics homepage and figured out you can track impressions and metrics by promoted or organic activity … and that’s about it. The good news is there’s much more you can discover in your Tweet activity dashboard — you’ve just need to know where to look.
Beyond the basic metrics, here are some incredibly important things you can discover about your Twitter account and audience using Tweet Analytics.
How to Use Twitter Analytics
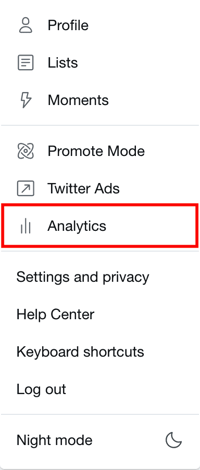
You can access Twitter Analytics by tapping your profile and selecting “Analytics” from the dropdown menu:
1. See Which Content Resonates With Your Audience
Understanding which types of content and topics your audience members most enjoy can help drive your social marketing and content strategy. What’s the point in sharing content no one cares about or enjoys?
On the “Tweets” tab, you can see Impressions, Engagements and Engagement Rate (Engagements divided by Impressions) for each tweet, for paid and organic posts. Engagements include all activity on the tweet: retweets, follows, replies, favorites, and all clicks on the tweet, link, hashtag, etc.
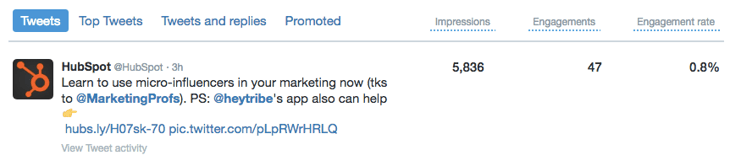
For a more granular view of the volume of each type of engagement, you can click on the specific tweet:
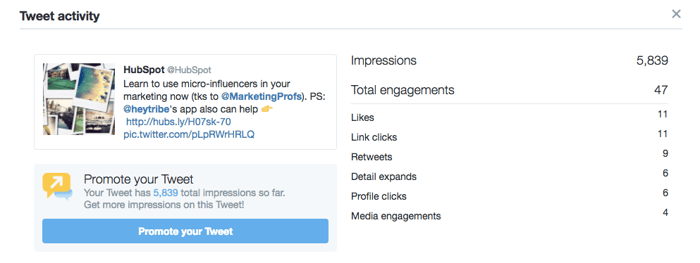
Understanding which content items get the most engagement on Twitter is huge. If you can even commit 10 minutes a week to recording your top five or ten tweets by engagement so you can start seeing trends over time — and then applying those insights to future tweets — you’ll be able to better connect with your audience.
2. Understand How People Interact With Your Tweets Over Time
This is a really common question among social media marketers and brands: What made my tweet take off?
Some tools can analyze your Twitter followers and recommend the best day of the week for you to tweet. There’s also research out there showing when people are most likely to be active on Twitter. But of course, the best way to get to know your own audience is from your own account data.
On the Tweets dashboard, you can customize the date range you want to analyze to see when you published your highest-performing tweets:
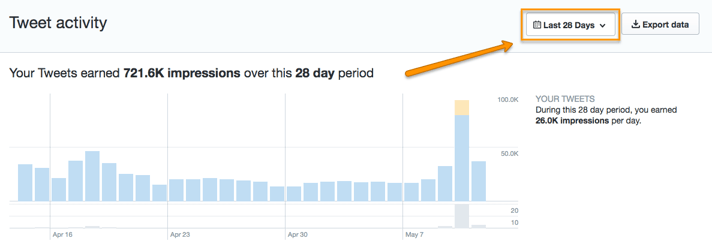
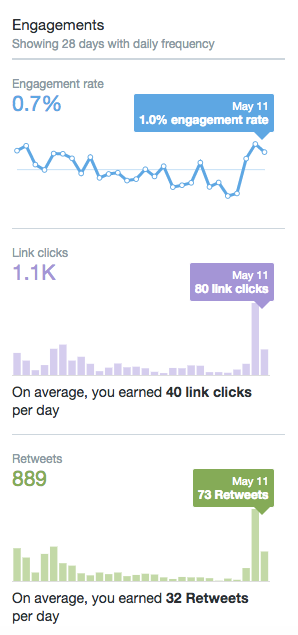
Twitter used to allow you to view a tweet’s engagement over the course of a day, and I personally think it was a mistake to remove that feature. I hope they bring it back in an update soon so users can analyze the best time of day to tweet from their account.
3. Get to Know Your Followers
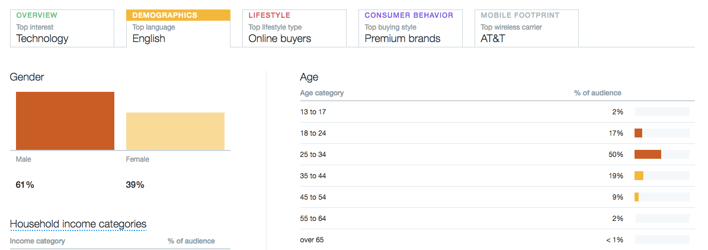
Twitter’s audience data in the “Followers” tab contains a ton of valuable and useful insights. This is where you can really get to know the people who follow you.
You’ll find answers to questions like: Are your audience members more likely to be male or female? Which countries and cities are the majority from? What are their top interests? You can also see who your followers follow as well as your follower’s top five most unique interests. Answering these questions can help you better identify what content to create and share on Twitter — and when to share it.
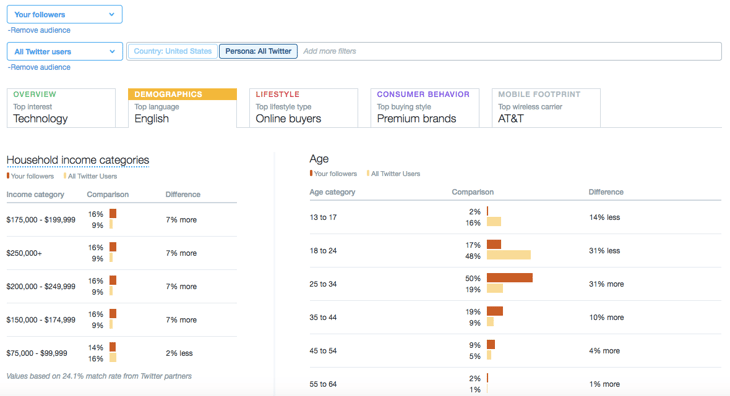
You can also compare your Twitter followers to different segments — for example, to all Twitter users total:
4. See Whether Your Follower Base Is Growing (or Shrinking)
I’d call myself a Twitter power user now, but it wasn’t always so. For several years, I slowly grew my following up to about 8,000 followers. In the past few years that I’ve really focused on my Twitter presence, I’ve picked up another 704,000.
Now, Twitter allows you to track your follower growth. Twitter Analytics shows you how many followers you had on any given day with the interactive timeline pictured below. Hovering over various points on the timeline will show you the exact follow count on that day. It dates back to the day your account was started.
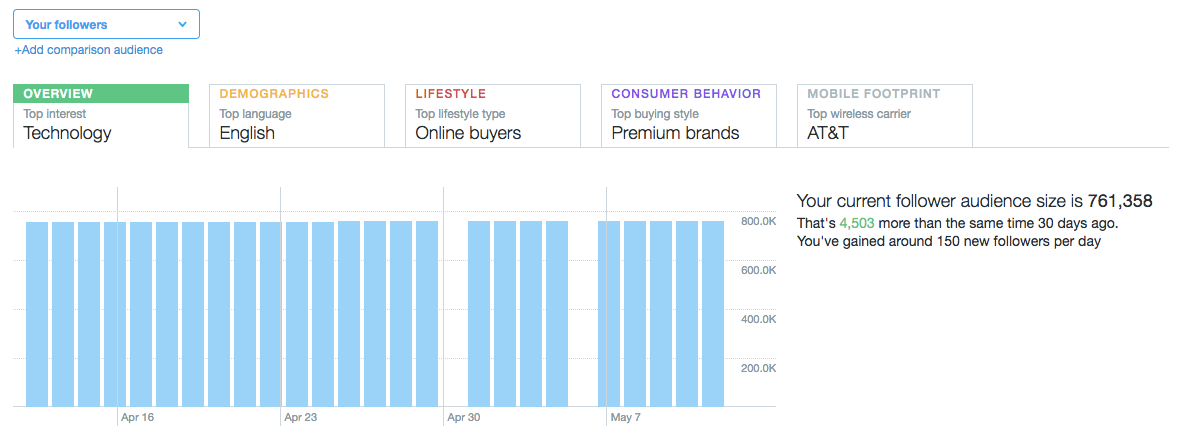
If you’re seeing blips in your follower count over time, it’s important to revisit your activity in those periods and see if you can learn from it. How often were you posting then — and what were you posting about? Were you taking the time to reply to folks, too? Answering questions like these can help you explain these blips — and avoid the same mistakes in the future.
5. Determine If Your Twitter Ads Are Worth the Money
I’ve been experimenting recently with paid promotions on Twitter. After reviewing my own data in Twitter Analytics, I realized my ads weren’t as effective as I thought they would be.
In the Tweets tab, right at the top, there’s a chart that gives an overview of your paid and organic tweet performance. Like other Twitter Analytics charts, this one is interactive, so hovering over specific parts will show you more precise numbers, as in the example below. Keep in mind that the data only goes back 91 days, so take advantage of the ability to export it regularly. You can make comparisons over longer periods of time in another program.
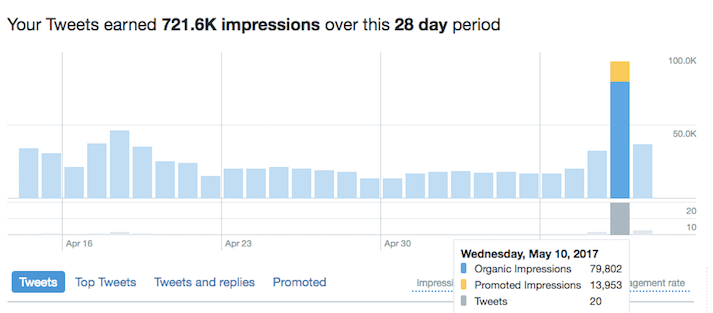
I’m not spending a ton on paid promotions — around $100 a day when I use them — but at a glance, I can see that compared to organic posts, they’re not having a huge effect. If I were running specific promotions, I’d be interested in the Conversions information available in Twitter Analytics. But for getting more impressions on my content, it doesn’t seem worth it because I could get that exposure for free by just tweeting a few extra times per day.
Obviously, this will vary for every user, but this panel in Twitter Analytics is a pretty simple way to see what you need to make that decision.
Just below that chart, you can click “Promoted” to see all of your paid promotions in chronological order. This shows you how many engagements and impressions each one earned, helping you pinpoint which paid promotions are working (and which ones aren’t).
Free Twitter Analytics Tools
- TweetReach
- Klear
- Keyhole
- Twitonomy
- Tweet Binder
- RiteTag
- Mentionmapp
- Hashtagify
Still other third-party analytics tools can help you do a deeper dive into content properties that Twitter Analytics won’t give you as much data on. Want specifics on hashtag performance? Maybe you want more information on the most influential Twitter handles in your industry. These are the metrics you’ll need outside help to find.
Below are some of the most widely used Twitter analytics apps and the types of data they’re best for reporting on. Although most of them have paid plans that afford you multiple features, each of these tools offer free services that can give your Twitter game a boost of intelligence.
TweetReach
User, Keyword, and Hashtag Analytics
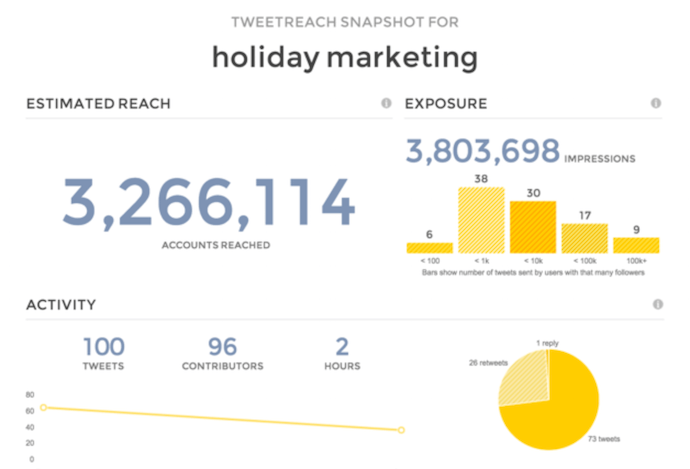
TweetReach is a free reporting tool that allows you to see how far your tweets and hashtags have traveled and who’s engaged with them. You can also get “snapshot” reports of any user, hashtag, or tweets with certain keywords in them so you can understand what’s being talked about in your industry in real time.
Klear
Influencer Analytics
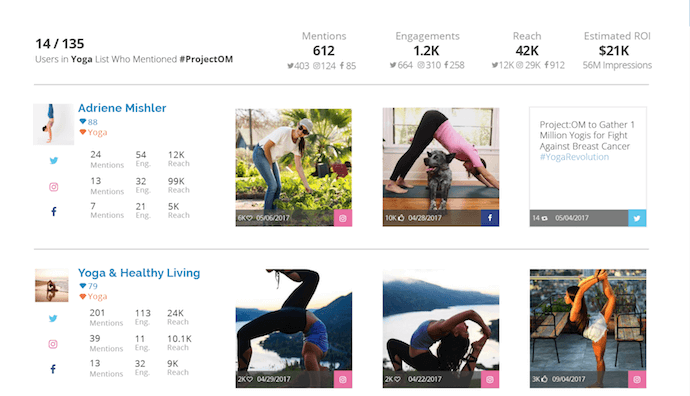
Klear focuses specifically on influencer marketing, tracking Twitter’s most influential users and helping you determine who’s making the most noise and greatest impact on certain topics of conversation. Compatible with Instagram, YouTube, and Twitter, the tool makes it easy to find, analyze, and manage your relationships with the people you want your brand to be associated with on social media.
Keyhole
Hashtag Analytics
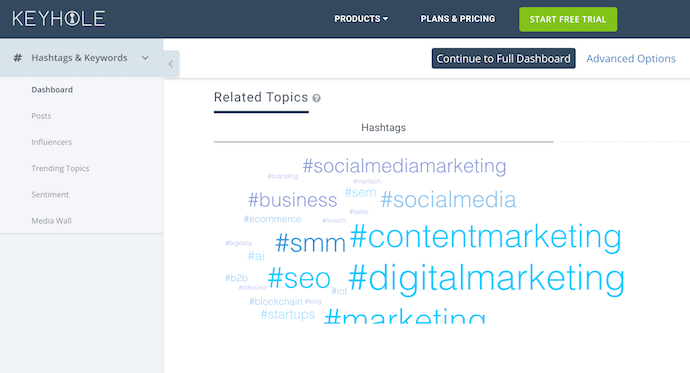
Keyhole takes Twitter users on a deep dive into the hashtags and topics they might like to create entire social media campaigns around. Start by performing free searches for hashtags, accounts, and topics you want to track. Then, for a paid subscription, use these insights to set up monitoring programs so you can find out who’s saying what about you, your event, or your market.
Twitonomy
User, Keyword, and Hashtag Analytics
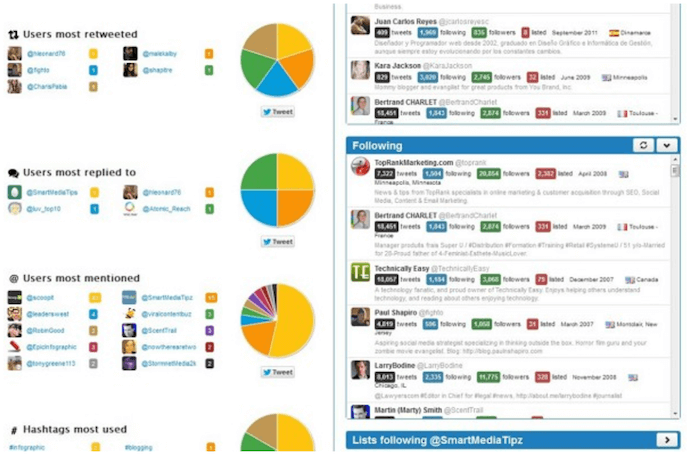
Twitonomy offers a full portfolio of data about the content you tweet and the users you follow. Most of this data is completely free, and you have multiple ways to visualize and report on this information. You can track posts from specific users, get smarter insights about your own followers, and more by signing into Twitonomy through Twitter directly.
Tweet Binder
Campaign Analytics
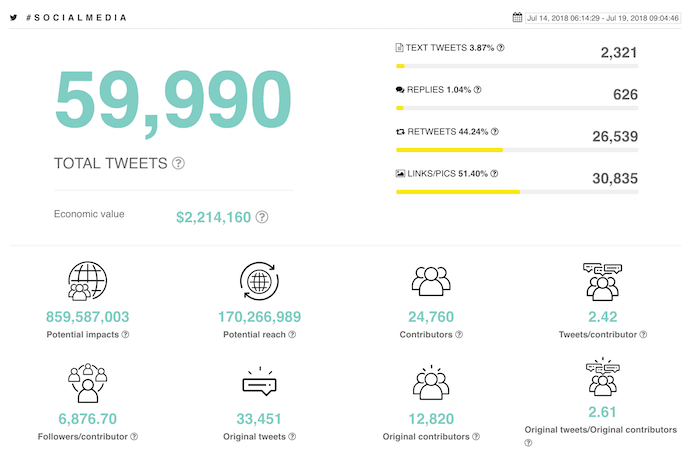
Tweet Binder is a campaign-focused analytics tool that allows you to view activity behind any hashtag, user, or keyword for free. Under its paid plans, the product gives you both Twitter and Instagram “walls” where you can see the impact of your own campaigns, making you a smarter promoter and event marketer over time. Tweet Binder’s free hashtag report, shown above, gives you an idea of just how easy it is to see the data behind various Twitter trends.
RiteTag
Hashtag Analytics
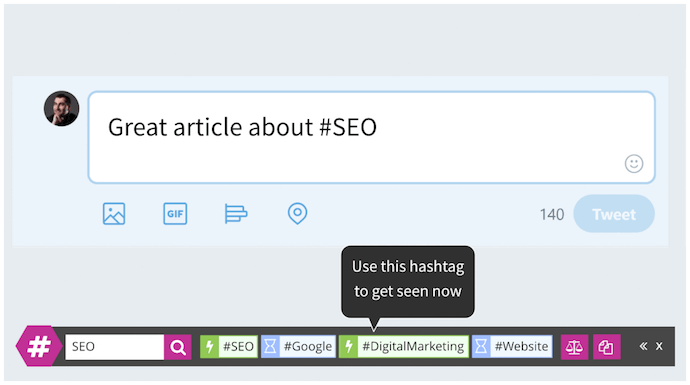
RiteTag doesn’t just give you engagement metrics behind a hashtag — it uses that data to give you real-time suggestions for which hashtag to use in each tweet you create. The platform integrates with a variety of marketing tools and social networks, allows you to create “tag sets” to refer back to, and recommends hashtags based on both text and visual media you want to post.
Mentionmapp
User, Mention, and Hashtag Analytics
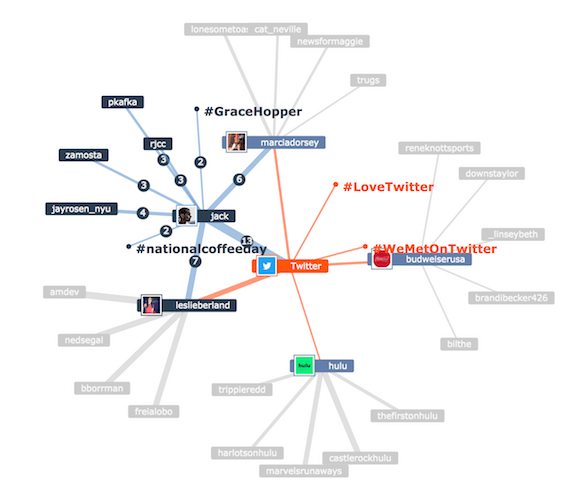
Mentionmapp is one of few Twitter analytics tools that presents conversation data in “map” form. Most of the tool is free to use under the “Seeker” platform, showing you not just who’s talking to whom, but who’s expanding on which topics and where a topic began. The map you create stays updated to Twitter trends as they happen.
Hashtagify
Hashtag Analytics
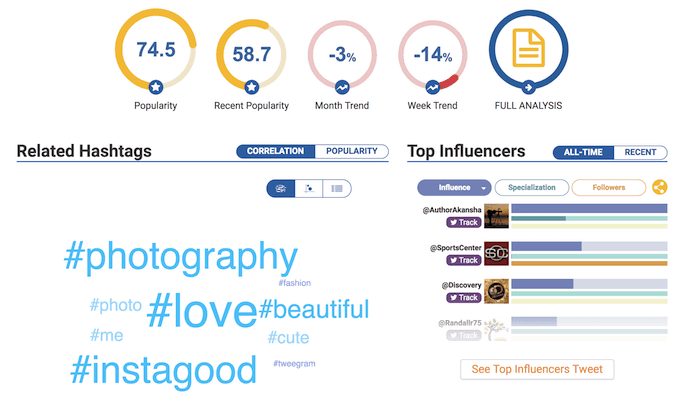
Hashtagify, as you might’ve guessed from its name alone, is a hashtag analytics tool that serves up a dashboard of information related to any hashtag you search. The product works for both Twitter and Instagram, organizing its data into various visual categories so you can properly decide with hashtags and topics you should get in on. As with each tool on this list, the free version of Hashtagify offers the dashboard above and a lightweight version of the full suite of analytics — which is available through paid plans.
Exporting Data: How to Discover Even More Trends in Twitter Analytics
Twitter Analytics is great as an interactive dashboard for accessing increasingly granular data about your Twitter account performance.
The most useful feature I’ve found is the ability to export data from the Twitter API as a CSV file. Even power users with a ton of account activity can fairly quickly export their Analytics data.
To export your data, select the timeframe you’d like to use, and click the “Export Data” button in the top right corner of your Twitter Analytics Dashboard.
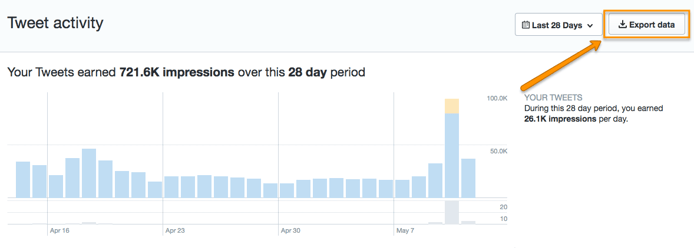
You can then sort through your exported data using Excel in ways not possible within the platform itself. For example, I extracted the time of day of my last 2500 tweets and plotted the tweet engagement rate vs. time of day, as shown here:
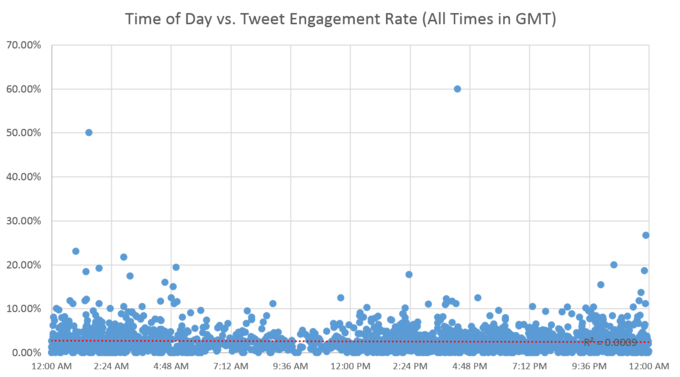
What I found was that the engagement rate (i.e. the # of engagements/impressions) held steady (on average) regardless of the time of day — possibly because I have a ton of international followers. It got me thinking that I really ought to be scheduling my content for all hours of the day, not just during business hours in my local time zone. Sure, fewer people will see my updates at 2 a.m. local time, but those who do are just as likely to engage with the content as those who see it during business hours.
There are so many other columns of data in the CSV export, including the number of favorites, retweets, link clicks, replies, URL clicks, follows, etc. So you can do this kind of customized analysis on whatever metrics you care most about.
Ultimately, the best data is your own, so make time to check out Twitter Analytics and see what you can learn and do with it. Figure out which tweets resonate and why. Then, work those insights into your social media marketing strategy for a more successful way forward.
For more ideas, download HubSpot’s guide to getting more Twitter followers.


Image Alt Text: What It Is, How to Write It, and Why It Matters to SEO
If you spend time optimizing your blog or website’s content, headers, subheaders, and meta descriptions for search engines, the following image should alarm you:
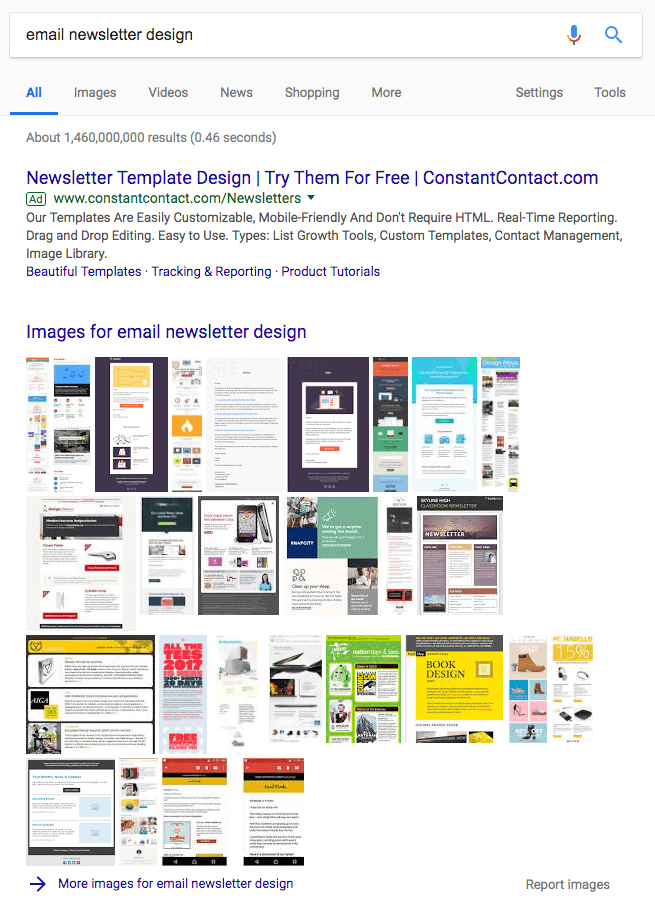
Today, Google’s search engine results pages (SERPs) deliver just as many image results as they do text-based results. The screenshot above is the first SERP Google produces for the search term, “email newsletter design.” Notice how, in addition to the “Images” tab at the top, Google pulls in a substantial pack of clickable images to the beginning of the main results page — before any organic text results are even visible.
Despite your best SEO efforts, you could still be missing out on another source of organic traffic: your website’s images. How do you get in on this traffic source? Image alt text.

More and more, the topics that many businesses and publishers create content on require images to accompany their words. If you’re writing about photography, for instance, photographic examples of your insight are crucial to your visitors’ reading experience. When explaining how to use a certain type of software, screenshots of that software are often the best way to demonstrate it.
If you’re creating content on a topic that requires the support of visuals, consider how your audience might prefer to find answers to their questions on that topic. In many cases, Google searchers don’t want the classic blue, hyperlinked search result — they want the image itself, embedded inside your webpage.
One of the most important things image alt text can do for you is turn your images into hyperlinked search results — giving your website yet another way to receive organic visitors.
What Is Alt Text?
Also called “alt tags” and “alt descriptions,” alt text is the written copy that appears in place of an image on a webpage if the image fails to load on a user’s screen. This text helps screen-reading tools describe images to visually impaired readers and allows search engines to better crawl and rank your website.
Whether or not you perform SEO for your business, optimizing your website’s image alt text is your ticket to creating a better user experience for your visitors, no matter how they first found you.
How to Add Alt Text to Your Images
In most content management systems (CMSs), clicking on an image in the body of a blog post produces an image optimization window, where you can create and change the image’s alt text.
HubSpot users: Here’s what this image optimization window looks like in the CMS inside your HubSpot portal:
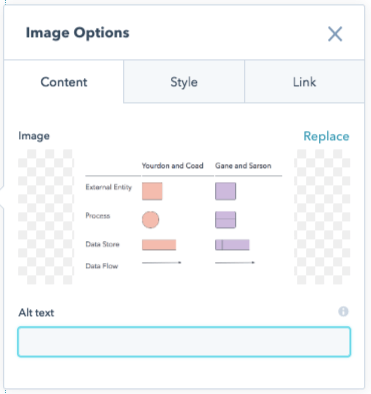
Your alt text is then automatically written into the webpage’s HTML source code, where you can edit the image’s alt text further if your CMS doesn’t have an easily editable alt text window. Here’s what that alt tag might look like in an article’s source code:
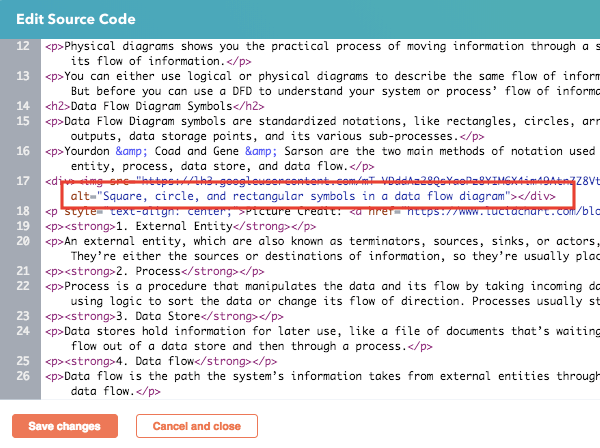
The most important rule of alt text? Be descriptive and specific. Keep in mind, however, that this alt text rule can lose its value if your alt text doesn’t also consider the image’s context. Alt text can miss the mark in three different ways. Consider the examples below.
3 Image Alt Text Examples (the Good and the Bad)
1. Keyword vs. Detail

Bad Alt Text
alt="HubSpot office wall Singapore inbound marketing workplace murals orange walls ship it"
What’s wrong with the line of alt text above? Too many references to HubSpot. Using alt text to stuff keywords into fragmented sentences adds too much fluff to the image and not enough context. Those keywords might be important to the publisher, but not to Google.
In fact, the alt text above makes it hard for Google to understand how the image relates to the rest of the webpage or article it’s published on, preventing the image from ranking for the related longtail keywords that have higher levels of interest behind them.
Good Alt Text
With the bad alt text (above) in mind, better alt text for this image might be:
alt="Orange mural that says 'ship it' on a wall at HubSpot's Singapore office"
2. Detail vs. Specificity

Image by Winslow Townson
Bad Alt Text
alt="Baseball player hitting a ball at a baseball field"
The line of alt text above technically follows the first rule of alt text — be descriptive — but it’s not being descriptive in the right way. Yes, the image above shows a baseball field and a player hitting a baseball. But this is also a picture of Fenway Park — and the Red Sox’s #34 David Ortiz clocking one over right field. These are important specifics Google would need to properly index the image if it’s on, say, a blog post about Boston sports.
Good Alt Text
With the bad alt text (above) in mind, better alt text for this image might be:
alt="David Ortiz of the Boston Red Sox batting from home plate at Fenway Park"
3. Specificity vs. Context

Image via UCLA
Both images above have clear context that can help us write good alt text — one is from a HubSpot office, and the other is Fenway Park. But what if your image doesn’t have official context (like a place name) by which to describe it?
This is where you’ll need to use the topic of the article or webpage to which you’re publishing the image. Here are some bad and good examples of alt text based on the reason you’re publishing it:
For an Article About Attending Business School
Bad Alt Text
alt="Woman pointing to a person's computer screen"
The line of alt text above would normally pass as decent alt text, but given that our goal is to publish this image with an article about going to business school, we’re missing out on some key word choices that could help Google associate the image with certain sections of the article.
Good Alt Text
With the bad alt text (above) in mind, better alt text for this image might be:
alt="Business school professor pointing to a female student's computer screen"
For a Webpage on Education Software for Business School Teachers
Bad Alt Text
alt="Teacher pointing to a female student's computer screen"
The line of alt text above is almost as descriptive and specific as the good alt text from the previous example, so why doesn’t it suffice for a webpage about education software? This example dives even deeper into the topic of business school, and specifies that the ideal audience for this webpage is teachers. Therefore, the image’s alt text needs to reflect that.
Good Alt Text
With the bad alt text (above) in mind, better alt text for this image might be:
alt="Professor using education software to instruct a female business school student"
Alt Text Best Practices
Ultimately, image alt text needs to be specific but also representative of the topic of the webpage it’s supporting. Get the idea so far? Here are a few important keys to writing effective image alt text with SEO in mind:
- Describe the image, and be specific. Use both the image’s subject and context to guide you.
- Keep your alt text fewer than 125 characters. Screen-reading tools typically stop reading alt text at this point, cutting off long-winded alt text at awkward moments when verbalizing this description for the visually impaired.
- Don’t start alt text with “picture of…” or “Image of…” Jump right into the image’s description. Screen-reading tools (and Google, for that matter) will identify it as an image from the article’s HTML source code.
- Use your keywords, but sparingly. Only include your article’s target keyword if it’s easily included in your alt text. If not, consider semantic keywords, or just the most important terms within a longtail keyword. For example, if your article’s head keyword is “how to generate leads,” you might use “lead generation” in your alt text, since “how to” might be difficult to include in image alt text naturally.
- Don’t cram your keyword into every single image’s alt text. If your blog post contains a series of body images, include your keyword in at least one of those images. Identify the image you think is most representative of your topic, and assign it your keyword. Stick to more aesthetic descriptions in the surrounding media.
So, where do you start when developing alt text for your blog posts and webpages? Consider performing a basic audit of your existing content to see where you can incorporate alt text into previously untagged pictures. Watch to see how your organic traffic changes among the pages that you give new alt tags.
The more images you optimize, the better your SEO strategy will be moving forward.


How to Sell With Facebook Lead Ads

Want your Facebook funnel to be more profitable? Wondering how Facebook lead ads can help? To explore how to sell with Facebook lead ads in an unconventional way, I interview Oli Billson. More About This Show The Social Media Marketing podcast is designed to help busy marketers, business owners, and creators discover what works with […]
The post How to Sell With Facebook Lead Ads appeared first on Social Media Examiner.
from Social Media Examiner https://ift.tt/2NJDVYi
via socialmediaexaminer
20 of the Best Form Builder Tools for 2018
You’ve heard it before — forms are the gold standard when it comes to capturing leads, learning about industry trends, doing market research, and even just getting some customer feedback. It might be one of the older methods in the book, but old is gold.
Before we dive into the best form builder tools for 2018, though, let’s talk about what a form builder exactly is.
With no shortage of options, the best form builder apps tend to be quite similar and user-friendly. Whether you want to make a contact form, a sign-up form, or a survey, form tools are the easiest way to create web forms, with drag and drop questions, multiple form fields, and different color and structure options.
Once your responses start coming in, most forms will also import each entry into a spreadsheet or centralized database and send you notifications when people complete them.
Form tools today usually offer many different features too, like progressive profiling, smart fields, and interactivity.
Easily build and embed forms on your site. Try HubSpot Forms for free!
Ultimately, there’s a form for each of your business’ needs and goals — and we’re here to help you pick the best-fit tool specifically for you.
20 of the Best Form Builder Tools for 2018
1. HubSpot’s Free Online Form Builder
HubSpot’s online form builder is one of the most powerful form builder tools available. The tool combines the foundations of form creation with cutting-edge technology to give you much more capability than a normal online form builder can — and it’s also free.
Even though it’s one the more advanced form builder tools, you don’t need any technical expertise when you use HubSpot’s form builder. You can quickly create forms with the drag-and-drop form builder and convert anonymous website visitors into leads with unlimited forms, fields, submissions, and custom forms that all connect to your contact database.
Once someone fills your form out, they’re automatically routed to HubSpot CRM. Once they’re in your CRM system, you can set reminder tasks, call them, and send them one-to-one personalized emails, letting you better manage and nurture relationships with your contacts.
HubSpot’s form builder also has data enrichment for contact profiles and deep integration with HubSpot’s marketing hub, making it a good option for teams who want a single system to manage their forms, contacts, and marketing efforts.

2. Google Forms
Google Forms’ unique selling point is that it’s fast, free, and easy to use, with unlimited forms and entries. It’s also built into the Google Docs suite, so it automatically pulls your data into a Google Sheet for you to analyze.
While Google Forms’ design may not be customizable, this form tool is best for quick market surveys, rather than a professional survey or lead capture form placed on your website.

Image Source: Google
3. Typeform
Typeform takes an innovative approach to the world of form building. With an intuitive design, the tool guides you through the form creation process one question at a time and makes the experience of building a survey fun and interactive.
Typeform is also great for customer surveys and user research — you can create and send standalone survey links out to your list. If you want to try something with an engaging, straightforward user experience, the tool is a solid option.

Image Source: Typeform
4. Microsoft Forms
Microsoft Forms is a simple, easy-to-use form creator that integrates with the Microsoft Office suite. With full customization options, users can quickly make surveys, feedback forms, quizzes, and lead forms.
Since Microsoft forms doesn’t integrate directly with an online CMS, the tool might not be the best option for lead generation. But the form builder can collect data in real-time and import all your responses in an Excel spreadsheet, so you can perform powerful yet simple analysis with Excel filters and pivot tables.
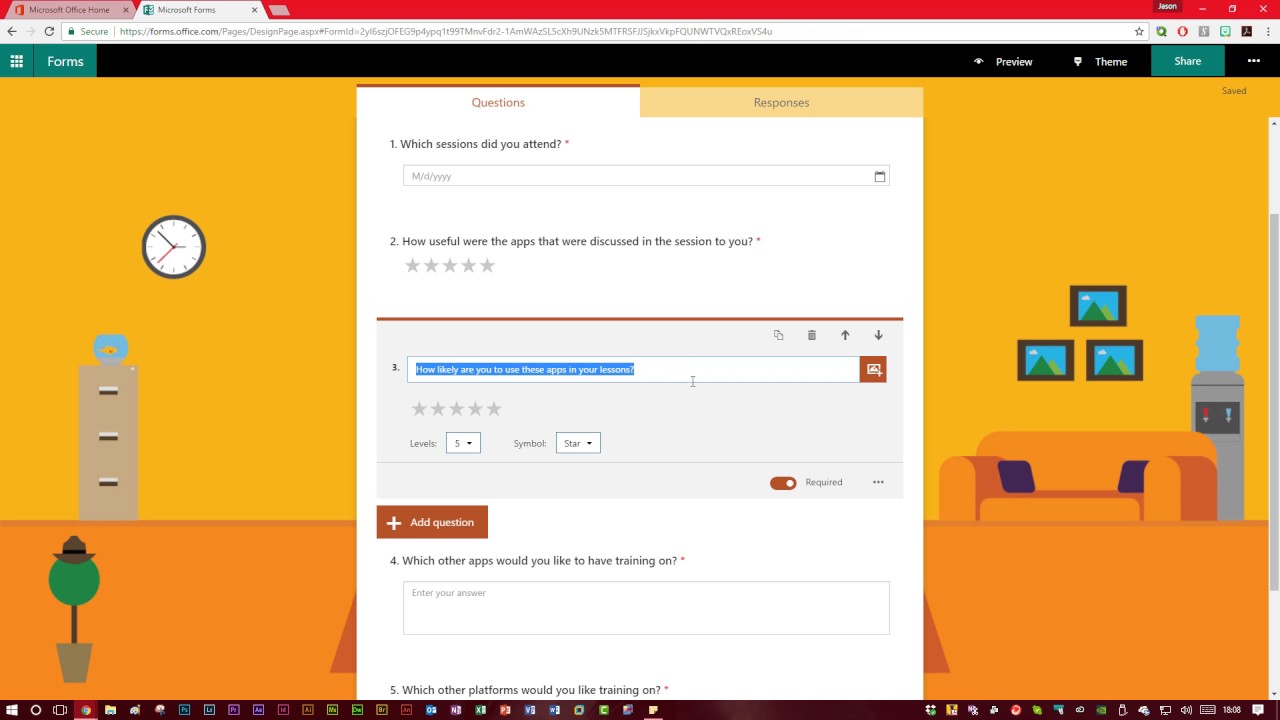
Image Source: YouTube
5. Form Crafts
Form Crafts is a basic form builder tool that has a user-friendly interface and simple design.
The WordPress plugin allows you to create moderately customizable lead capture forms, email sign-up forms, surveys, and feedback collection forms. One of Form Crafts’ best features is that it’ll send you email notifications about your lead generation process, so you don’t need to constantly monitor your results anymore.

Image Source: WordPress
6. FormTools
FormTools is a flexible form creator that focuses on feedback, data, insights, and beautiful form building.
The form builder tool allows you to create most types of forms and tracks your results on a visually appealing dashboard. FormTools also give you an option to integrate their app with a third party provider of your choosing, like Salesforce or Dropbox.

Image Source: Form Tools
7. Wufoo
Part of the SurveyMonkey family, Wufoo is one of the oldest form tools in the space. You can design some appealing online forms with it and it’s super easy to use.
The app also allows you to embed forms on your website, set up payment fields that are compatible with a number of payment processing services, and turn on automatic email notifications to alert you when someone fills out your form.

Image Source: WuFoo
8. Ninja Forms
Ninja Forms is a powerful WordPress form tool that’s used by wide range of marketers, from novices to gurus.
The tool is free, integrates quickly and easily with a number of different tools, and it can greatly boost your marketing efforts. Ninja Forms also offers unlimited forms, fields and submissions. But, sometimes, the tool lacks clear documentation and can be difficult to use when you want to customize your forms.

Image Source: CodeCanyon
9. Cognito Forms
If you’re looking for a form builder with sound logic branches and robust payment fields, Cognito Forms is for you. The form tool also offers calculated fields, conditional logic, repeating fields, and more, making it easy and simple to create advanced forms.
Cognito Forms integrates with Stripe, PayPal, and Square and offers a free version that includes unlimited forms with 500 entries per month.

Image Source: Microsoft Store
10. FormStack
FormStack is mostly focused on building business and professional style forms. The tool’s best features include intelligent forms, built-in workflows, and seamless integrations with Google Sheets, PayPal, and MailChimp (and others through their API).
One of FormStack’s more sophisticated features is an A/B testing tool that can compare different versions of your forms and tell you what performs better.
The tool also offer electronic signatures and payments, and users can save their form drafts and return later to finish them.

Image Source: GetApp
11. FormSite
FormSite has all the essential features you need for cranking out some quick “prototypical” web forms. As one of the more basic form builders, it’s often used for simple contact or feedback forms.
The tool also has a number of pricing plans that can suit your specific business needs. The free version offers 5 forms each month with 10 results per form.
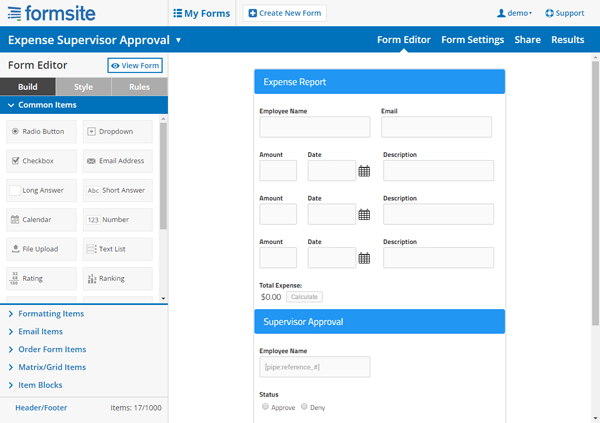
Image Credit: FormSite
12. Clearbit Forms
Clearbit Forms lets you leverage smart forms and flexible data enrichment technology to automatically collect specific user information. This lets you create shorter forms with less fields, and, in turn, produce happier customers (because who doesn’t love a short survey?)
With two plans designed for startups and enterprises, Clearbit can definitely meet your modern marketing needs.

Image Source: Clearbit
13. FormKeep
FormKeep is a tool unlike most on this list — it’s an easy-to-use tool that finds a happy medium between coded and drag and drop forms.
With FormKeep, you have the option to code your own form, style it according to your brand guidelines, and integrate it with Zapier to manage your submission data.

Image Source: Intercom
14. Gravity Forms
Another WordPress-powered plugin, Gravity Forms helps you create amazing forms with the help of multi-page/multi-step forms and a number of time-saving features.
With this tool, you have access to a variety of integration options and add-ons for email software, messenger platforms, payment options, and automation software. You can also create advanced forms, but, for non-techies, they can be a little complicated to set up.

Image Source: WPML
15. Jotform
Jotform is an online form builder with an intuitive visual editor, known for making form building faster than ever.
The tool has all the normal form building capabilities as well as unique fields to customize your own forms. It also integrates with almost every marketing platform.The free plan caps out at 5 forms, with up to a 100 entries per month.

Image Source: Weebly App Center
16. SurveyAnyPlace
SurveyAnyPlace has proven that surveys don’t have to be boring. With their gamification elements, interactive features, and incentives like coupon codes, you can make all your surveys and quizzes fun and enjoyable.
By leveraging SurveyAnyPlace’s unique approach to form building, you can easily collect leads, information, and insights from visitors.

Image Source: GetApp
17. Contact Form 7
One of the most popular WordPress plugins, Contact Form 7, has upwards of 5 million active installations on the CMS.
A free tool for everyone to use, it’s a super simple and basic form creator with a heavy focus on contact forms. But it’s also important to note that the tool has some limitations, especially with its customization options.

Image Source: WordPress
18. Conversational Form
An open source platform, Conversational Form lets you transform your web form into a simple chatbot.
By using a novel and clever way to gather data, this form builder is bound to drive user engagement. At the same time, though, due to its new entrance into the marketing space, it might be difficult to learn your way around the tool.

Image Source: Pagely
19. FormBakery
As one of the easiest drag and drop form tools out there, FormBakery lets you build professional forms in the most straightforward way possible.
For those looking to build a super simple form in under 5 minutes, the tool is a great choice. You can quickly customize forms with your own designs, with no coding necessary. If you’re looking to build a more advanced form, though, FormBakery may not be the right choice for you.

Image Source: AppStorm
20. DeviceMagic
DeviceMagic is a mobile form solution on a mission to ditch all paperwork, automate lead generation processes, and enhance data collection.
Since the tool solely focuses on building mobile forms, it has a number of great benefits over other form builders, like quick and accurate data collection, lower operations costs, and less time wasted on administrative work.

Image Source: Device Magic
The options are endless for form builder tools.
Most form builders offer all the essentials needed to make a basic form, but your options start to narrow down when you want better customization and deeper data analysis. Ultimately, for you, the best form tool depends on your team’s purpose and particular business needs.

Gender Neutral Pronouns: What They Are & How to Use Them
In the past few years, the U.S. has made some small but mighty strides towards inclusivity, and language plays a big part in that.
We’ve become rightfully cautious when we label other people, and are learning the importance of asking permission before identifying someone as a certain gender.
In my English class in college, for instance, my teacher was progressive enough to say, “Please let me know which pronoun you’d prefer I use for you.” While this might seem arbitrary or unnecessary, it’s not — everyone has the right to self-identify with whatever pronoun they feel comfortable (or, to avoid identifying altogether).
To avoid accidentally offending someone at the office before you know their preferred pronouns, it’s important to use gender-neutral pronouns in your workplace conversations.
Gender-neutral pronouns
Gender-neutral pronouns are words that don’t specify whether the subject of the sentence is female or male. ‘They’, for instance, is a third-person pronoun that is gender neutral. Other gender-neutral pronouns include ‘them’, ‘this person’, ‘everyone’, ‘Ze’, or ‘Hir’. If you’re not sure which pronoun to use, you can also use that person’s name.
Since gender-neutral pronouns have only recently become more commonplace, it’s likely you aren’t sure how to use them, or even what they are. Here, we’ve provided you with a list of gender-neutral pronouns and examples of how to use them, so you can begin creating a more inclusive workplace.
Gender-neutral Pronouns, and How to Use Them
There are a few benefits to using gender-neutral pronouns. First, in the English language, “He” has often been used as an automatic fill-in for generic individuals. By using gender-neutral language, you’re ensuring your sentences are inclusive for everyone.
Second, “he and she” are two extreme binaries that don’t leave room for other gender identities. This can be hurtful for individuals, such as transgender or gender queer communities, who don’t identify with “he” or “she”.
Ultimately, you don’t want to make incorrect or hurtful assumptions about someone’s gender. Just because someone appears feminine or masculine doesn’t mean they are a man or woman — they could be agender, nonbinary, or uncomfortable identifying with “he” or “she”.
Here is a list of gender-neutral pronouns:
- He/She — Zie, Sie, Ey, Ve, Tey, E
- Him/Her — Zim, Sie, Em, Ver, Ter, Em
- His/Her — Zir, Hir, Eir, Vis, Tem, Eir
- His/Hers — Zis, Hirs, Eirs, Vers, Ters, Eirs
- Himself/Herself — Zieself, Hirself, Eirself, Verself, Terself, Emself
Typically, you won’t use one of these gender-neutral pronouns unless a colleague asks you to identify them as such.
However, there are more traditional gender neutral pronouns you can introduce into your everyday conversation, regardless of the individual. These include “Them”, “They”, “Their”, “Everyone”, and “That Person”.
When in doubt, refer to someone by their name, rather than “him” or “her”.
“They” is one of the more common gender-neutral pronouns, and it’s easy to incorporate into your daily conversations. Here are some examples of how to use it:
- “I spoke to the marketing director and they said they’d get back to me.”
- “I think someone left their laptop behind.”
- “Who’s in charge of that campaign? I’ll email them.”
You probably use “they” “them” and “their” often in your everyday language, even when you know someone identifies as “he” or “she”. It’s a natural substitute, but can go a long way towards creating a more inclusive office culture.
Finally, when addressing people in a meeting, it’s best to say, “Hello, everyone,” or “Hey, team.” You’ll want to avoid “Hey, guys”, or similar phrases, since “guys” is typically masculine.
How to Learn Someone’s Pronouns
When you first meet someone, you don’t want to ask about their pronouns. This could make them feel like you’re asking them to out themselves as transgender, agender, or nonbinary, which they might not want to do, particularly if you work in a conservative office.
Instead, introduce yourself with your pronouns: “Hi, I’m Caroline, and my pronouns are she/her.” By sharing your own pronouns, you’re allowing the other person to share theirs, but not forcing them to.
Additionally, avoid saying “preferred” pronouns. Despite the popularity of the term, it’s incorrect, since “preferred” implies someone’s gender is a preference.
Ultimately, using gender-neutral pronouns doesn’t require too much effort on your part, but it could make a huge difference in creating a warmer, more inclusive workplace environment for everyone.

How to Make a Good Impression on your New Boss

A Beginner’s Guide to Data Flow Diagrams
Ask any professional athlete or business executive how they became successful, and they’ll tell you they mastered a process. By figuring out which of their habits led to success, which didn’t, and learning from past successes and failures, they could improve their efficiency, effectiveness, and productivity at work.
But implementing a process into a business, department, or even a team is a completely different animal than honing your own personal process. With so many moving parts, how do you track each aspect of your process, and, more challenging yet important than that, how do you refine it?
For almost 50 years, data flow diagrams have been one of the most simple and effective tools for organizations to understand, perfect, and implement new processes or systems. They’re visual representations of your process or system, so they make it easy to understand and prune.
Before we dive into how data flow diagrams can help you refine any of your business’ systems or processes, though, let’s go over what it exactly is.
What is a data flow diagram (DFD)?
A data flow diagram, or a DFD, is a visual representation of any process or system’s flow of information. By mapping out your process or system’s flow of data, DFDs help you better understand your process or system, uncover its kinks, improve it, and can even help you implement a new process or system. DFDs can range from simple overviews to complex, granular displays of a process or system.
DFDs became popular in the 1970s and have been able to maintain their widespread use by being easy to understand. Visually displaying how a process or system works can hold people’s attention and explain complex concepts better than blocks of text can, so DFDs are able to help almost anyone grasp a system or process’ logic and functions.
There are two types of DFDs — logical and physical. Logical diagrams display the theoretical process of moving information through a system, like where the data comes from, where it goes, how it changes, and where it ends up.
Physical diagrams shows you the practical process of moving information through a system, like how your system’s specific software, hardware, files, employees, and customers influences its flow of information.
You can either use logical or physical diagrams to describe the same flow of information or you can use them in conjunction to understand a process or system on a more granular level. But before you can use a DFD to understand your system or process’ flow of information, you need to know the standard notations or symbols used to describe it.
Data Flow Diagram Symbols
Data Flow Diagram symbols are standardized notations, like rectangles, circles, arrows, and short-text labels, that describe a system or process’ data flow direction, data inputs, data outputs, data storage points, and its various sub-processes.
Yourdon & Coad and Gene & Sarson are the two main methods of notation used in DFDs, and they both use shapes and labels to represent the four main elements of a DFD — external entity, process, data store, and data flow.

Picture Credit: Lucidchart
1. External Entity
An external entity, which are also known as terminators, sources, sinks, or actors, are an outside system or process that sends or receives data to and from the diagrammed system. They’re either the sources or destinations of information, so they’re usually placed on the diagram’s edges.
2. Process
Process is a procedure that manipulates the data and its flow by taking incoming data, changing it, and producing an output with it. A process can do this by performing computations and using logic to sort the data or change its flow of direction. Processes usually start from the top left of the DFD and finish on the bottom right of the diagram.
3. Data Store
Data stores hold information for later use, like a file of documents that’s waiting to be processed. Data inputs flow through a process and then through a data store while data outputs flow out of a data store and then through a process.
4. Data flow
Data flow is the path the system’s information takes from external entities through processes and data stores. With arrows and succinct labels, the DFD can show you the direction of the data flow.
But before you start mapping out data flow diagrams, you need to follow four rules of thumb to create a valid DFD.
1. Each process should have at least one input and one output.
2. Each data store should have at least one data flow in and data flow out.
3. A system’s stored data must go through a process.
4. All processes in a DFD must link to another process or data store.
The Different Levels of DFDs and the Context level Data Flow Diagram
DFDs can range from simple overviews to complex, granular representations of a system or process with multiple levels, numbered from 0 to beyond. But the most common and intuitive DFDs are Level 0 DFDs, which are called context diagrams. They’re digestible, high-level overviews of the flow of information through a system or process, so almost anyone can understand it.
Level 1 DFDs are still broad overviews of a system or process, but they’re also more detailed — they break down the system’s single process node into subprocesses. Level 2 DFDs dive even deeper into detail by breaking down each process into granular subprocesses. Any DFD that goes past level 2 is rare — there would be too much detail, which defeats its original purpose of being easy to understand.
DFD Example
Professionals in various industries, like software engineering, IT, business, and product management & design, can use DFDs to better understand, refine, or implement a new system or process.
And to help you develop a concrete understanding of what a DFD looks like and how it can simplify your organization’s complex systems and processes, here’s an example of a context level data flow diagram of a DVD borrowing system, like Redbox.
In this DFD, the customer is the source of information, the DVD borrowing system is the process, data flow, and data store, and the shopkeeper is the destination of information.

Picture Credit: Lucidchart
Perfecting Your Process
Every great athlete, executive, business, or service are not only focused on following a stellar process, but they’re also obsessed with perfecting it. That said, creating and honing an effective process is one of the most challenging tasks in the working world. But if you can evaluate your organization’s process with data flow diagrams, your company will have a firm grasp on how to master it.

New Research: Social Marketers Still Can’t Prove ROI
Do you struggle to measure the return on investment (ROI) for your social media activity? Turns out you aren’t alone. In this article, you’ll discover insights from new research that addresses the age-old ROI challenge. #1: Measuring Return on Investment Remains Marketers’ Biggest Challenge Social Media Examiner’s 2018 Social Media Marketing Industry Report found that […]
The post New Research: Social Marketers Still Can’t Prove ROI appeared first on Social Media Examiner.
from Social Media Examiner https://ift.tt/2xWKege
via socialmediaexaminer
Building Blocks: The Journey: Season 2, Episode 4

Have you ever struggled with setting a hard date to start something? Then watch The Journey, Social Media Examiner’s episodic video documentary that shows you what really happens inside a growing business. Watch the Journey In episode 4, Michael Stelzner (founder of Social Media Examiner) and his marketing team are wrestling with a common theme—when […]
The post Building Blocks: The Journey: Season 2, Episode 4 appeared first on Social Media Examiner.
from Social Media Examiner https://ift.tt/2R1h8VT
via socialmediaexaminer
The Key to Productivity Isn’t Your Mind, It’s Your Body
Welcome to The Science Behind Success — a new blog series that explores the best ways to help our brains perform better at work. With psychological research and interviews with leaders in the field, we’re showing you how psychology can help you overcome workplace obstacles and excel in your career. Because a little mindset change could go a long way.
If you’re anything like me, you don’t feel like the day is over until your to-do list is complete.
You wake up in the morning with a long list of everything you need to get done, and you move on autopilot throughout the day, checking off tasks as you go.
When you feel you’ve hit a good spot to pause (after a few hours laboring away), you eat a quick meal and maybe grab a second cup of coffee. Then it’s back to work.
You finish most days around 5 or 6 PM, wishing you had more hours to tackle your projects. You hit the gym for an hour, and then head home for a quick dinner and maybe some TV.
Oftentimes, the only real break you give yourself is when your head hits the pillow.
Sound familiar?
Here’s the problem — in our quest for optimal productivity, we often ignore our body’s needs. But, unbeknownst to most, that actually makes us far less productive.
Josh Davis, Ph.D., the Director of Research and Lead Professor at the NeuroLeadership Institute, addresses this very paradox in his international best-seller, Two Awesome Hours: Science-Based Strategies to Harness Your Best Time and Get Your Most Important Work Done.
In his book, Davis writes, “Staying on task without a break and working longer hours are wonderful solutions for a computer or machine. But … We are biological creatures. Continually demanding one kind of work — and a consistent level of effectiveness — from our brains is like continually demanding the same speed from a runner under any circumstances.”
Davis argues we don’t take our biological factors into consideration enough when making decisions regarding our efficiency and productivity at work.
He’s not wrong — when was the last time you stopped and said, “Hang on a minute, I bet I’d be better in this meeting if I got my blood sugar levels up with a snack?” Or, when was the last time you considered jogging in place at your office desk, just to relieve some stress? Probably never.
Davis’s research is based on the theory of embodied cognition, a psychological phenomenon that suggests our biological needs should be considered more prevalently when we structure our days.
Essentially, Davis surmises that if we can change how we treat our bodies at work, we can change how our brain functions as well.
I spoke with Davis to gain unique insights into his research regarding how our bodies affect our productivity.
He told me, “The more we can all become educated about what really leads to being most effective, the more we can create work cultures that support the right behaviors. Rather than reinforcing cultures that reward trying to be busy all the time, we can support one another in becoming our best, most effective selves.”
Here, we’re going to dive into Davis’ tips for learning how to use our biology to achieve better results in the workplace. But first, in order to fully grasp the concept of Davis’ research, it’s critical you understand what embodied cognition is, and how it affects the decisions we make every day.
Embodied Cognition — What Is It, and How Can It Help You?
Embodied cognition is essentially the idea that our bodies can influence our minds just as much as our minds can influence our bodies.
Rather than assuming your brain is the center of all knowledge and command, embodied cognition proposes that any solution we come up with when we’re decision-making includes elements from our physiological and neurological systems, as well. In other words, our brain isn’t solely responsible for our thoughts and behavior — our body’s play a part, too.
There have been numerous studies to support the notion that our body influences our thoughts. For instance, the way you sit can increase your testosterone levels, a concept known as “power posing“. You might think your confidence and assertive behavior comes solely from your brain, when really, your body language and hormones have a lot more to do with it.
In another example, John Bargh, a social psychologist at Yale, conducted an experiment and found participants who interviewed job candidates took their roles more seriously if they held a very heavy clipboard, versus a light one.
Ultimately, understanding your environment’s impact on your body is critical for knowing when and how you’ll perform best at work. Productivity isn’t only a matter of willpower, or telling yourself, “Come on, I’ve got to focus now.” It’s more than that — it’s linked to your body, and how your environment affects it.
Davis’s Tips for Tricking Your Brain Into Working Better in Less Time
The premise of Davis’ book centers around the notion that staying on task and working long hours without breaks is a fundamental misunderstanding of how our brains work.
We don’t need more hours in the day, or to work faster. We simply need to create optimal conditions for our bodies, and brains, to function at peak efficiency for shorter periods of time.
When I spoke with Davis, he mentioned a familiar scenario — “There is a culture in many places where people try to impress one another with how exhausted they are from work. Endless hours, no down time. They pride themselves on being responsive to every email within minutes at any time of day. It helps them look and feel busy, and the culture of many workplaces rewards them. Coworkers are impressed by it and often feel embarrassed that they have not done the same.”
But, he goes on to note, “I can usually correctly expect that those same people who are constantly working and are primarily being reactive are feeling like they are treading water and hardly get a chance to come up for air.”
Ultimately, the solution for feeling overworked is simple. If you learn how to listen to your body, and use your natural biological needs to your advantage, you can structure your day to ensure you’re working when your body’s at its peak efficiency level, and taking breaks when it’s not.
Let’s dive into some examples of these strategies to see how you can put them to use immediately.
1. Exercise for immediate, daily benefits.
We often think about exercise in the long-term: “I want to live longer, I want to lose weight, I want to lower my cholesterol”.
This type of thinking makes us feel like exercise must happen, but it can happen after work. We compartmentalize our lives — we tell ourselves we can exercise at 6 PM, after our workday.
While there’s nothing inherently wrong with this way of thinking, Davis explains it can cause us to miss a more immediate benefit of exercise.
“The cognitive and emotional benefits include reducing anxiety and making it easier to focus or be present. Various studies put it around 20 minutes, and some as little as about 10,” Davis told me, adding, “It was surprising that moderate, rather than intense, exercise was actually better for the cognitive and emotional benefits.”
There are plenty of short-term benefits of exercise for daily productivity. A brief, 20 minute workout, like walking up and down the stairs at your office, can decrease your stress hormones, and allow you to think more clearly.
Next time you have an important meeting or upcoming deadline you’re stressed about, give yourself some time for moderate exercise. Take a walk, jog in place, or walk up and down the stairs to reap the benefits. While it might make you feel like you’re procrastinating or wasting time, remind yourself you’re not — you’re actually setting yourself up to perform better.
2. Eat and drink for increased productivity.
While you might not think about it a lot, food is critical for stable blood sugar, which is necessary for productivity and focus.
If you don’t believe me, consider this: in one 2012 study, employees with unhealthy diets were 66 percent more likely to report losing focus.
If you think of food as the fuel for your career success, it might increase your motivation to eat small, healthy snacks throughout the day. Rather than waiting until you’re starving at lunch and then quickly eating a Chipotle burrito, Davis recommends potentially splitting up a healthy lunch into two parts, and eating them at different times. By splitting up your food breaks, you’re more likely to reap the benefits all day long, rather than only right after lunch.
If you don’t want to split up your lunch, Davis also recommends eating snacks to maintain energy, like a handful of nuts. When you’re losing focus at work, it’s critical you consider eating food that can help you get back on-track. Rather than considering food a nuisance to your productivity, you should begin viewing it as a necessary component to your efficiency.
Davis also urges people to stay away from too much caffeine. Your third cup of coffee might make you feel like you’re a superhero, but in reality, the increased caffeine could distract you and make you less focused.
3. Use mindfulness to assess your body’s cognitive energy.
In his book, Davis describes a situation where a man is sitting at his desk with ten minutes until an important meeting, and he knows he should be preparing for the meeting, but then he sees an email in his inbox.
The temptation to feel accomplishment is too much — he ends up wasting time trying to respond to the email, and before he knows it, he only has one minute until the meeting, he hasn’t finished the email, and now he’s rushing off, frustrated and unprepared.
We’ve all felt this similar desire to check things off our list for the sake of checking them off. That sense of accomplishment can make you feel productive, but in reality, it’s not important enough to necessitate time during your peak productivity window.
Davis’ advice for combatting this is relatively simple, but it requires practicing mindfulness when making decisions, and assessing how your body actually feels. He says we often behave on autopilot — we respond to that email because that’s what we do whenever we see an email in our inbox.
As Davis described to me, “What is absolutely key [ … ] is pausing. For example, I know I can easily tell myself after working for two hours, ‘I still feel energetic. I’ll just keep going.’ But most of the time, when I pause and walk away for a minute or two, I realize how much harder it is to think than when I’m fresh.”
If the man sitting at his desk who received an email took a moment to intentionally connect with his priorities, he’d recognize that the email could wait until after the meeting. That action — pausing — could be the difference between wasted time and ultimate productivity.
4. Let your mind wander.
In his book, Davis writes, “Our attention systems are designed to regularly refresh — to be ready to discover what is new in the environment and help us navigate a constantly changing world.”
You can’t fault yourself for losing focus when you hear colleagues chatting behind you, or when a car drives by the window. Those are primitive and healthy responses. Biology has given us the advantage of awareness to the outside world.
It’s important to recognize how biology might work against our preconceived notion of what it means to be productive. We might feel frustrated when we are distracted by our environment, believing it to reflect a lack of focus or willpower — but it’s our body’s natural response, and doesn’t need to be fought.
When you’re distracted, Davis says it’s important you let your mind wander. Then, when you return to your work, you will be cognitively refreshed from the momentary distraction.
5. Create an ideal physical environment.
In his book, Davis talks about how the mood we set can genuinely affect our performance. There’s a lot of research to support your environment’s impact on your productivity.
You’ll want to create a restorative rather than distracting workplace environment. Choose bright and cool lighting (rather than warm and dim), keep your desk clean, and whenever possible, find a quiet place to focus.
Ultimately, the benefits of tricking your brain into working harder aren’t just obvious in the workplace. Increased productivity can lend itself to a happier lifestyle overall, as you make space for hobbies, passions, and people.
Davis writes, “We must choose to either enjoy life or succeed. The good news is this is a false choice. We feel pressured to choose when we mistakenly assume that productivity depends on finding enough hours in the day.”
Hopefully, his research gives you hope that productivity and career growth don’t have to come at a cost to your passions, family, or genuine enjoyment. If we learn to work with our biology, rather than in spite of it, we can become more efficient at all facets of our life, in far more balanced ways.

The Ultimate Guide to the Internet of Things (IoT)
Raise your hand if you’ve heard of the Internet of Things (IoT).
I’m guessing most of you have your hand up.
Now, keep your hand raised if you understand how the Internet of Things (IoT) actually works.
If you’re anything like me, you’re probably scanning your brain trying to recall information from an article you read about smart homes two or three years ago … and your arm is probably getting tired. I get it. I’d lower mine, too.
The Internet of Things (IoT) was so elusive to me that I found myself thinking, I know the Internet of Things (IoT) is “here,” but what exactly is it? And how is it impacting my life?
Let’s dive into what IoT is, how it will change the future, and how you can put it to use for your business.
Feel free to jump to a specific section or email this to yourself for later:
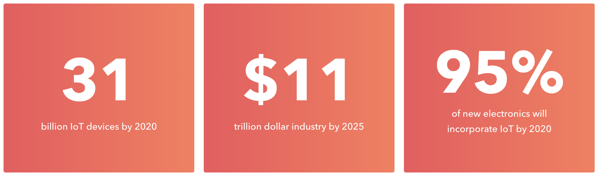
Your Apple Watch? That’s part of IoT. Google Home? Yup, that’s an IoT device too. Heck, the entire city of Barcelona is made up of IoT devices. Over the last few years, IoT has quietly taken the world by storm, and it isn’t slowing down anytime soon. In fact, by 2020 there will be 31 billion devices connected to the Internet of Things. To put things into perspective, that’s more than three IoT devices for every person on earth.
IoT Devices
So we have a general idea of what IoT devices are — you’re currently using one to read this article. But phones and computers only make up a small part of IoT. IoT devices include anything that can connect to the internet to send and receive data. And it turns out that almost anything can be connected this way.
There are IoT coffee machines that send out alerts when you’re running low on coffee. IoT connected beds monitor your sleep and adjust the temperature to optimize your sleep patterns. More practical applications of IoT include connected cars that can drive and update themselves and Amazon’s dash buttons that allow customers to reorder everyday products like Tide Pods or razor blades at the touch of a button. The Dash Replenishment Service takes this one step further by allowing the products to automatically reorder themselves when a sensor records that supplies are running low. When extending a market is as easy as slapping a button onto something, it’s not hard to see how companies will start to adopt this new level of connectivity.

Department stores like Macy’s are using in-store iBeacons to send customers targeted rewards and experiences like celebrity meet and greets on Black Friday. Beacons are small, Bluetooth transmitters that connect with corresponding apps installed on connected devices like iPhones or iPads. iBeacon technology allows businesses to have multi-channel communications with their customers — to reach them where they are. It also enables companies to connect with a mass audience. Before iBeacons, individual sales associates would have to tell each customer about a promotion, leaving room for error. With iBeacons, anyone who enters a store with that store’s app can receive an alert.
Let’s say you own a small business, can you still benefit from the Internet of Things? (Spoiler alert: Yes, you totally can). Actually, you may already be benefiting from it. If you use Square to accept payments, you’re using an IoT device. Since 2014, the popular credit card processing company has been connecting and sharing its data via the internet — making it easy for small businesses to receive payments.
According to Forbes, only 18% of small businesses and 13% of mid-sized companies considered IoT a priority in 2015. However, many SMBs are already reaping the benefits of the technology.
Quansett Nurseries, in Westport, Massachusetts, grows microgreens to sell to restaurants year round. Because all of the greens require different microclimates, the nursery set up sensors throughout the greenhouse so farmers could remotely control factors like humidity, temperature, and hydration. The system also automatically adjusts the climate if it senses that one of the elements is off. IoT enables Quansett Nurseries to deliver the best produce possible all year long and reduce waste.
IoT Platforms
The connected devices themselves are only half of the IoT equation though. For these connected devices to even exist, they first need to be created. And to create an IoT device, you need an IoT platform.
IoT platforms allow developers to manage the applications they build as well as store, share, and analyze data. Think about the iOS and Android platforms. Both the iOS and Android platforms allow developers to create apps faster and for less money by providing the underlying technology to solve a specific problem or need. For example, the basic technology behind optimizing connected HVAC systems to lower heating costs is the same regardless of whether a developer is using it for a small apartment or a 50-story office building. However, unlike smartphone apps, developers can choose from hundreds of IoT platforms. Amazon, Google, and IBM are a few of the major platform providers, but countless others offer different solutions for specific needs.
IoT Applications By Industry
All of these IoT devices and platforms around us accomplish a diverse range of tasks that go way beyond just reordering coffee capsules. According to Forbes, 84% of the growing IoT applications will be dominated by a few main industries: Smart Cities (26%), Industrial IoT (24%), Connected Health (20%), and Smart Homes (14%). What does that mean? Let’s find out.
Home and Security
This first category hits close to home … because it’s about your home. A few years ago, 83 million smart home devices shipped to consumers. By 2020, that number will swell to 193 million new devices per year. While seemingly every area of IoT is rapidly expanding, IoT devices within our homes are some of the most noticeable. A world where your house can talk to you and make decisions? Yeah, that’s already a thing. Connected devices currently inside homes include the usual suspects like lights you can control with your smartphone, as well as more advanced options like smart refrigerators that allow you to reorder food from built-in interfaces.
Amazon’s Alexa is currently one of the most popular and well-known smart home devices, with over 10 million new devices shipped in 2017 alone. Alexa can perform a wide variety of tasks like calling an Uber, reading you a recipe, and of course, ordering items instantly from Amazon. Affordable smart devices like Alexa, Google Home, and Apple HomePod help make IoT technology accessible to a broad audience and allow more people to become comfortable with bringing IoT into their personal spaces.
From a home security standpoint, homeowners can install IoT connected doorbells that broadcast live video to their phone when someone approaches the door or smart locks that can be pre-programmed to allow access during certain hours of the day. Say goodbye to ding-dong ditch.
Once again, Amazon is leading the way with their Amazon Key service. Using a compatible smart lock and Amazon’s cloud cam, couriers can scan the barcode on their package to unlock the door and drop it off inside your home. When the door opens, the camera starts recording and then sends a video confirming the delivery to the homeowner. It may sound creepy, but consumers have found this technology to be so useful that Amazon has already rolled it out in 37 cities.
Smart security features aren’t just good for consumers; they’re beneficial to businesses, too. By placing your products directly inside the safety of consumers’ cars or homes, businesses can avoid uncomfortable customer service calls about stolen or damaged packages, and customers get their packages on-time. It’s a win-win.
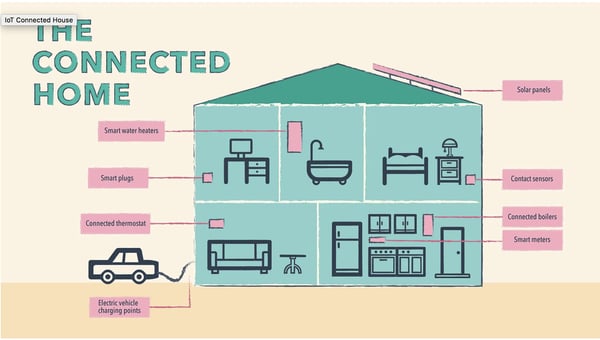
Energy
Okay, we briefly touched on how smart energy appliances can impact your home. Smart lights, like the Philips Hue bulb, and smart thermostats allow users to remotely control their heating, cooling, and lighting. And while these might seem like just cool, tech gadgets, they can have a significant impact on both homes and businesses.
IoT connected lights can help homeowners save on energy costs by automatically shutting lights off when no one is home. Smart thermostats work similarly by automatically adjusting the temperature to reduce heating and cooling costs.
Consider this: When you walk into your home, you automatically flip on the lights, adjust the temperature, and go about your business. Now, what happens when you go away for the weekend? I’m sure you occasionally forget to adjust your energy settings. So what? Your energy bill may go up a little that month, but it’s nothing you can’t handle. Right?
Now imagine that same scenario taking place in a multi-story office building. The energy cost doesn’t seem so nominal anymore, does it? Smart energy appliances can automatically combat unnecessary energy usage to help increase savings.
And the benefits don’t stop there. IoT devices can collect energy data at a granular level, making it easy for home and business owners to identify issues and plan for the future.
IoT Healthcare
Outside of the home, IoT is beginning to revolutionize the healthcare and health monitoring industries. Hospitals are already able to remotely monitor their patients’ health and collect data using connected medical devices like insulin pumps and heart monitors. This allows doctors to catch early signs of problems and take preventive action.
Within hospitals themselves, connected devices help staff more efficiently manage resources and space. In some cases, that can literally save a life. Sensors on hospital beds that tell when and where beds are open reduce wait times by up to four hours. And monitoring on critical equipment prevents vital hardware from breaking when it is needed most.
Outside of the ER, connected activity trackers like Fitbits enable athletes of all kinds to track their performance and progress. If you’re like me and consider walking the quarter of a mile from your car to the office an athletic activity, you can track and log all of those precious steps. (Ed note: I also walk from my couch to the refrigerator.)
In all seriousness, connected fitness trackers are so helpful even insurance companies are encouraging their customers to wear one. Aetna recently starting giving their employees Apple Watches to keep track of their health and fitness goals, but soon they may be handing them out to all their eligible customers. Why? They hope the watch will encourage users to lead healthier lives, which means fewer insurance claims.
Urban Planning
Imagine a world where there’s always Wi-Fi, city trash cans never overflow, and parking spots are readily available. With the Internet of Things, that world can be a reality. The technology is increasingly influencing urban planning and design to make cities smarter — or wicked smart as we like to say in Boston. The adoption of IoT by smart cities is also increasingly important for a larger portion of the population. Every week, 1.3 million people move into cities. This type of mass migration can put a massive strain on a city’s infrastructure.
By building up information and communication technology, or ICT infrastructure, and sharing data through IoT connected devices, cities can alleviate some of the issues that come with all that growth. In smart cities, sensors embedded in roadways that detect traffic volumes and adjust street lights accordingly reduce commute times. Once you arrive at the office, other sensors send the location of all nearby available parking spaces directly to your GPS.
Smart cities are pristine because smart garbage cans and dumpsters automatically compact the trash or send alerts to waste management officials to be emptied. The structural integrity of bridges, tunnels, and buildings can be monitored in real time to avoid catastrophes.
All this technology is closer than you think. London, New York, Philadelphia, and Kansas City are just a few of the many cities who have appointed Chief Technology Officers to pursue smart city technology. San Diego is already installing 3,200 roadway sensors and may add an additional 3,000 to help manage traffic and parking. Connected trashcans are present in numerous cities including Boston and Pasadena. We may still be waiting for flying cars, but free Wifi in Seoul, Tel Aviv, and Helsinki is a pretty cool perk while we wait.

Transportation
Smart roads. Smart parking. Sounds good, right? Now imagine driving on those smart roads and parking in those smart spots in a new smart car. In two years, experts project 250 million smart cars will be on the roads. 10 million of those cars will drive themselves. And that’s only the start.
Remember those little electronic speed boats you played with as a kid? Imagine if those were life-size and filled with millions of dollars in consumer goods and commodities. Rolls-Royce is currently working on remote-controlled drone ships operated from a central hub. They predict the first fully autonomous ship will set sail by 2020.
And who can forget Amazon’s infamous drone delivery service? Amazon’s Prime Air promises to deliver small packages in 30 minutes or less via autonomous aerial vehicles. With the Internet of Things, the drone can use connected sensors to track potential hazards both on the ground and in flight. While this delivery method has only been tested on a small scale in England, it has the potential to reach millions of consumers — allowing users to safely ship and receive products.
Now you may be thinking, this all sounds cool, but is it really necessary? Smart transportation doesn’t just include self-driving cars and drones, sensors inside airplanes can alert maintenance crews of any issues, GPS apps can help safely navigate you to your destination, and IoT car sharing programs allow you to access a vehicle when you need one. IoT is revolutionizing the way humans and physical goods get from point A to B.
Manufacturing
If smart transportation is revolutionizing the way goods get to customers, smart manufacturing is revolutionizing how those goods are produced and tracked. Industrial IoT, or IIoT, while not as attention-grabbing as smart lights and cars, is one of the most successful applications of IoT.
According to a TATA Consultancy Survey and Business Insider, “Manufacturers utilizing IoT solutions in 2014 saw an average 28.5% increase in revenues between 2013 and 2014.”
That’s pretty substantial growth.
IIoT allows business to quickly and precisely track their merchandise. According to Forbes, “New RFID and GPS sensors can track products ‘from floor to store.’” Retailers can now collect data on how long a package was in transit, the condition it arrived in, and even the temperature it was stored at — making it easier for companies to deliver their products on-time and in perfect condition.
And not only can smart manufacturing track shipments, but it can also track inventory. All of the data it collects makes it easier to forecast manufacturing trends — no more missed deadlines, no more missing packages.
How the Internet of Things (IoT) is Changing Business
For Customers
So far, the future is looking pretty exciting thanks to the Internet of Things. Cities are cleaner and more efficient, you’re saving money on your electric bill, and you never run out of household essentials. But what does this all mean for business owners? We’ll get to that in a minute, but first, let’s talk about what the adoption of IoT means for customers.
The greatest thing IoT will change for consumers is their experience with customer service representatives. Companies, instead of customers, will start initiating customer service interactions, and these exchanges will often begin before a problem has even occurred. Essentially, customer service will switch from a reactive to a preventative model.
For example, sensors in Michelin truck tires allow the company to monitor the wear and tear of the tire tread and air pressure and alert transportation companies to change their tires before a dangerous blowout occurs.
When customers do get in touch with companies to solve a problem, IoT will also allow customer service representatives to enter the interaction with a trove of information. Instead of describing your problem, you’ll be able to skip right to solving it thanks to the information sent to the manufacturer from your connected device. With this data, customer service will be ready to quickly identify the source of the problem and walk you through a solution or ship out a replacement.
IoT’s impact on customer service extends far beyond just simple problem-solving. For example, Diageo used IoT whiskey bottles to allow people to send personalized messages to their dads on Father’s Day.
In 2013, Disney launched one of the most impressive IoT use cases with their MyMagicPlus Program. With this program, the park now provides a connected MagicBand bracelet to every guest. Once guests enter the park, their connected bracelet lets Disney guide them towards attractions with shorter lines, find them if they need help, unlock their hotel room, and make purchases. With access to more data, there are even more possibilities for enhancing the MagicBands. Disney characters could use data from the bands to greet guests by name, guests who get stuck in long lines could automatically be given food and drink vouchers, and photos taken by connected cameras could be sent to guests every day. In a world where IoT is increasingly integrated into consumer experiences, this level of service will become the new normal.
This doesn’t need to be intimidating. SMBs can start experimenting with low-cost, low-risk Internet of Things implementation to determine the best use of the technology for their business. IoT can be as simple as attaching an external sensor to a package to track its shipment or setting aside a small portion of funds to invest in experiments with IoT. Dedicate a small, separate team to exploring new types of innovation. By keeping this team separate from day-to-day operations, they will be able to focus on using IoT to solve big-picture problems instead of day-to-day ones. Companies that use IoT to reduce friction in their customer experience will see the greatest benefits as adoption grows.
For Business Operations and Supply Chain
Internally, connected devices within companies will improve operational efficiency by allowing management to identify unprofitable or unproductive processes and remove or enhance them. By converting the physical world into digital data, IoT allows every step to be measured and managed. In the short term, this may result in staff reductions within less productive areas or staff increases to support the implementation of IoT into the business.
Once IoT is integrated into a business’s day-to-day process, it can become a powerful enabler for monitoring and improving operations. Manual data collection is slow and inefficient, but connected devices allow information to be continuously gathered and analyzed which enables employees to focus on more strategic, impactful tasks. In one example, Shimane Fujitsu, a leading manufacturer of notebooks and tablets, used IoT tracking technology to reduce lead times by 20% and reduce shipping costs by 30%. This optimization freed up their employees to work on new projects.
Opportunity for Alternative Business Models
Widespread adoption of the Internet of Things will also create entirely new fields of opportunity for savvy companies. John Rossman, a former Amazon executive, discusses several options in his book The Amazon Way on IoT. Based on what he observed, we think there are three major options for small- to medium-size businesses to adjust their current business model with IoT. These include building a platform business, switching to an outcome-based model, or using data as your business.
Some, but not all, businesses will be able to create their own platforms using IoT. Although this option is not right for every company, organizations with widespread reach and the infrastructure to support an IoT platform can spin off their investment into an entirely new business. Amazon’s Alexa platform is one of the strongest examples of this approach with over 15,000 third-party skills already available.
With new IoT-collected data, some businesses may want to switch to an outcome-based model. For example, Progressive introduced Progressive Snapshot, a program that uses a detachable sensor connected to clients’ vehicles to track their driving and adjust their insurance rate accordingly. Customers are increasingly becoming used to paying for results instead of a flat rate for a product or service, and it’s not hard to see why. For Progressive customers, the company’s experiment with IoT has generated over $600 million in insurance discounts.
Every implementation of IoT produces volumes of information and, just like user data from social networks, IoT collected data is already creating new markets for sellers and buyers. Companies who can successfully manage customer data from their IoT devices can sell that information to other marketers and research organizations. According to Rossman, 10% of organizations will soon have entire departments dedicated to selling and trading IoT collected user data. And that’s got some people concerned…
IoT Security
Okay, now we’ve discovered the true hidden gem of the Internet of Things: data. Just imagine what marketers and businesses could do with all this new data.
But while IoT is extremely useful, it doesn’t come without baggage. Data security in the age of IoT is more crucial than ever. While the mountain of consumer data is useful for businesses and governments looking to help their customers and citizens, it’s also useful for malicious groups seeking to disrupt the system. In 2015, hackers used an unprecedented cyber attack to shut down the power grid in Western Ukraine, which left over 230,000 people without power or heat. As more infrastructure and consumer goods become connected to the internet, they also become vulnerable to these kinds of cyber attacks.
According to a report from the FTC, fewer than 10,000 smart homes can produce over 150,000,000 data points … in a single day. Those points represent more opportunities for hackers to enter a system and steal customer information. In the wake of disastrous incidents like the Equifax breach in 2017, companies have scrambled to maintain consumer confidence by adding additional protections and security measures. However, the rapid pace of IoT evolution and implementation makes it hard to keep up.
Currently, no foolproof solution exists for securing IoT devices. Government regulators are still catching up to the technology, which means some IoT products are not entirely secured. For now, that means companies and consumers need to make security a priority of their own. For consumers, the benefits of more secure IoT devices are fairly obvious, but businesses that prioritize IoT security will likely benefit in the long term by avoiding damaging lawsuits and public relations disasters. As a first step, the Department of Justice recommends that IoT devices implement secure password practices and that users keep their devices’ firmware updated to help protect against cyber attacks.
Conclusion
With the promise of 31 billion connected devices by 2020, it’s safe to say that the Internet of Things has arrived, and it’s here to stay. And with the rise of IoT, comes an onslaught of data. Connected communities will have the luxury of total convenience and personalization, as well as access to massive amounts of data. This data will allow businesses and consumers to proactively engage instead of react.
While this data will have a significant impact on marketing as we know it, it will also require unprecedented amounts of security. Without the proper protection in place, individuals or entire infrastructures could be at risk.
IoT and the data it collects will change life as we know it, but the technology alone will not help businesses. Companies that hope to flourish must use IoT to up-level the customer experience, increase operational effectiveness, and improve how they grow their businesses.

How to Add a Secondary Axis to an Excel Chart
Have you ever wanted to create a single chart for two different (yet related) pieces of data? Maybe you wanted to see the raw number of leads you’re generating from each channel and what the conversion rate of the channel is.
Having those two sets of data on one graph is extremely helpful to picking out patterns and identifying full-funnel trends. 
But there’s a problem. Those two sets of data have two Y axes with two different scales — the number of leads and the conversion rate — making your chart look really wonky.
Luckily, there’s an easy fix. You need something called a secondary axis: it allows you to use the same X axis with two different sets of Y-axis data with two different scales. To help you solve this pesky graphing problem, we’ll show you how to add a secondary axis in Excel on a Mac, PC, or in a Google Doc spreadsheet.
(And for even more Excel tips, check out our post about how to use Excel.)
Note: Although the following Mac and Windows instructions used Microsoft Excel 2016 and 2013, respectively, users can create a secondary axis for their chart in most versions of Excel using variations of these steps. Keep in mind the options shown in each screenshot might be in different locations depending on the version of Excel you’re using.
.png?t=1538007429278&width=600&name=Free%20Download_%20Facebook%20Live%20Guide%20for%20Business%20(2).png)
How to Add Secondary Axis in Excel
- Gather your data into a spreadsheet in Excel.
- Create a chart with your data.
- Add your second data series.
- Switch this data series from your primary Y axis to your secondary Y axis.
- Adjust your formatting.
On a Mac Computer (Using Excel 2016)
1. Gather your data into a spreadsheet in Excel.
For the purposes of this process, we’ll create three rows of data on Nike shoe sales in a blank spreadsheet:
- Shoe sizes
- Number of shoes sold per size
- Percentage of that size’s inventory that was sold
Make Row 1 your X axis and Rows 2 and 3 your two Y axes. For this example, Row 3 will be our secondary axis.

2. Create a chart with your data.
Want a detailed guide to creating a chart in Excel? Click here.
Otherwise, you can highlight the data you want to include in your chart and click “Insert” on the top-lefthand corner of your navigation bar. Then, click “Charts,” navigate to the “Column” section, and select “Clustered Column” — the first option, as shown below.
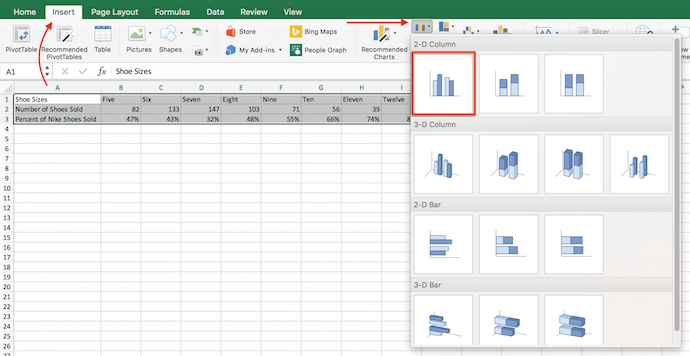
Your chart will then appear below your data set.
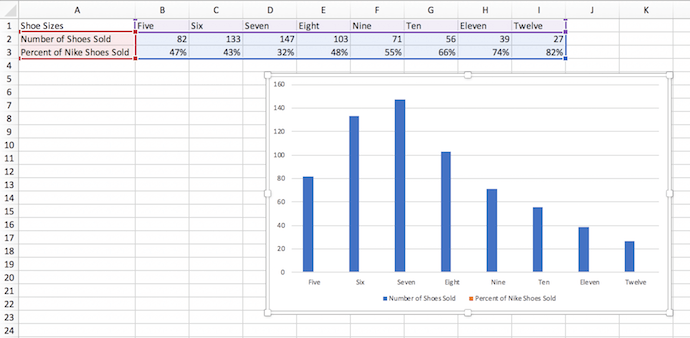
3. Add your second data series.
Now it’s time to turn the “Percent of Nike Shoes Sold” data — currently row 3 in the spreadsheet — into your chart’s secondary Y axis. Head over to your top navigation bar and click on “Format.” This should pop up in dark green next to “Chart Design,” as shown to the far right in the screenshot below.
Having selected “Format,” navigate to the dropdown menu on the top-lefthand corner of your menu bar, where it might currently say “Chart Area.” Click this dropdown and select “Series ‘Percent of Nike Shoes Sold'” (or whichever series you want as your secondary axis).
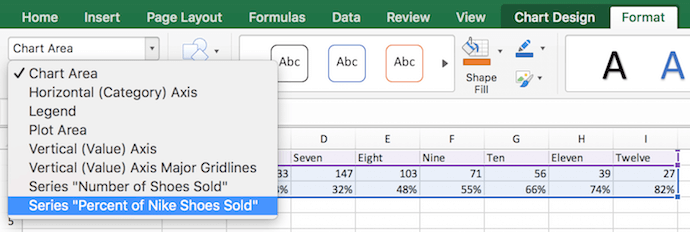
After you select “Series ‘Percent of Nike Shoes Sold,'” click on the “Format Selection” button — it’s right below the dropdown. A pop-up will come out that gives you the option to select a secondary axis. If you’re using a version of Excel that doesn’t provide you with this formatting button, move on to the fourth step below.
4. Switch this data series from your primary Y axis to your secondary Y axis.
You’ll see your new data series added to your chart, but currently, this data is being measured as a low-laying series of columns on your primary Y axis. To give this data a secondary Y axis, click on one of these bars just above the X axis line until they become highlighted.
Having highlighted this additional data series on your chart, a menu bar labeled “Format Data Series” should appear on the right of your screen, as shown below.
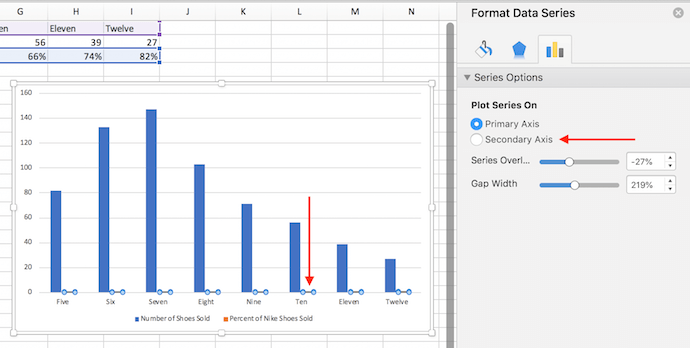
In this menu bar, click the “Secondary Axis” bubble to switch your Percentage of Nike Shoes Sold data from your primary Y axis to its own secondary Y axis.
5. Adjust your formatting.
You now have your percentages on their own Y axis on the right side of your chart, but we’re still not done. See how you have “Percent of Nike Shoes Sold” overlapping with the “Number of Shoes Sold” columns? Ideally, you want to present your secondary data series in a different form than your columns. Let’s do that.
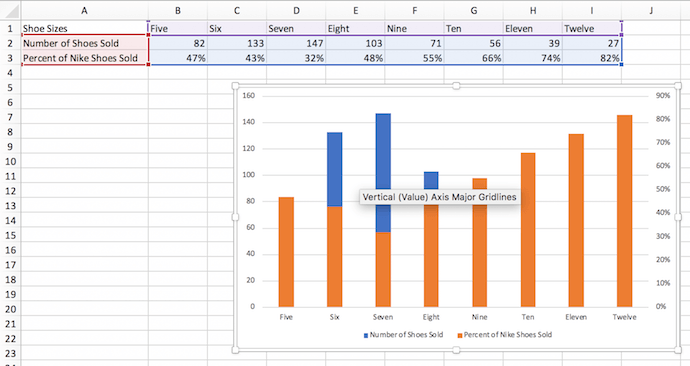
Click your orange columns — as shown in the screenshot above — to highlight your second data series again. Then, click into “Chart Design” on the menu bar on top of your Excel spreadsheet.
On the far righthand side, select the “Change Chart Type” icon and hover over the “Line” graph option. Select the first line graph option that appears, as shown below.
Voilà! Your chart is ready, showing both the number of shoes sold and percent, according to shoe size.
On a Windows PC (Using Excel 2013)
1. Gather your data into a spreadsheet in Excel.
Set your spreadsheet up so that Row 1 is your X axis and Rows 2 and 3 are your two Y axes. For this example, Row 3 will be our secondary axis.
2. Create a chart with your data.
Highlight the data you want to include in your chart. Next, click on the “Insert” tab, two buttons to the right of “File.” Here, you’ll find a “Charts” section. Click on the small vertical bar chart icon at the top left of this section. You’ll now see a few different chart options. Select the first option: 2-D Column.
Once clicked, you’ll see the chart appear below your data.
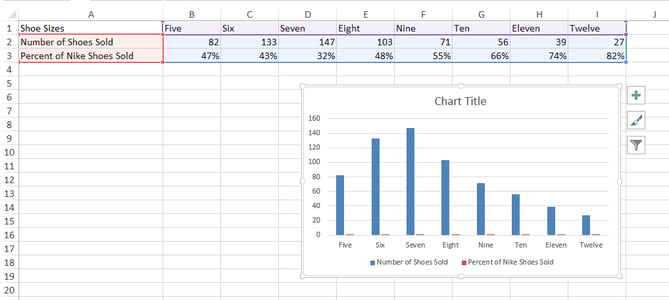
3. Add your second data series.
Now it’s time to add the “Percent of Nike Shoes Sold” data to your secondary axis. After your chart appears, you will see that two new tabs appear at the end of your dashboard: “Design,” and “Format.” Click on “Format.”
Then, on the far left where it reads “Current Selection,” click on the dropdown that reads “Chart Area.” Select “Series ‘Percent of Nike Shoes Sold'” — or whichever you want your secondary axis to be.
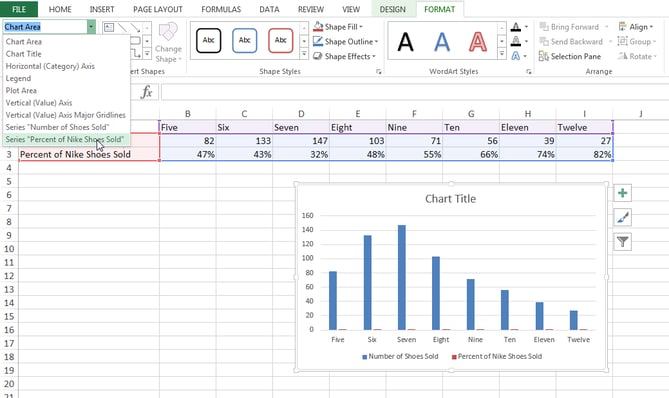
4. Switch this data series from your primary Y axis to your secondary Y axis.
You’ll see your new data series added to your chart, but currently, this data is being measured as a low-laying series of columns on your primary Y axis. To give this data a secondary Y axis, double-click on one of these bars just above the X axis line until they become highlighted.
Having highlighted this additional data series on your chart, a menu bar labeled “Format Data Series” should appear on the right of your screen.
In this menu bar, click the “Secondary Axis” bubble to switch your Percentage of Nike Shoes Sold data from your primary Y axis to its own secondary Y axis.
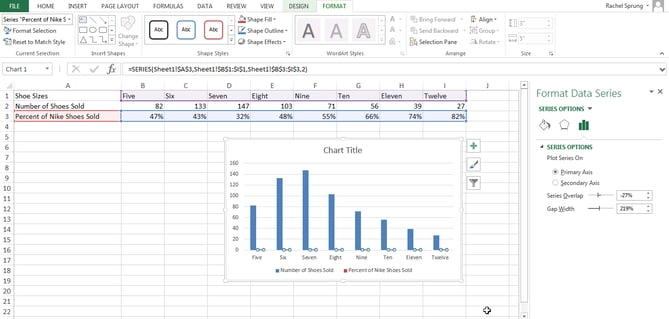
5. Adjust your formatting.
Notice how your “Percent of Nike Shoes Sold” data is now overlapping with your “Number of Shoes Sold” columns? Let’s fix that so your secondary data series is presented separately from your primary data series.
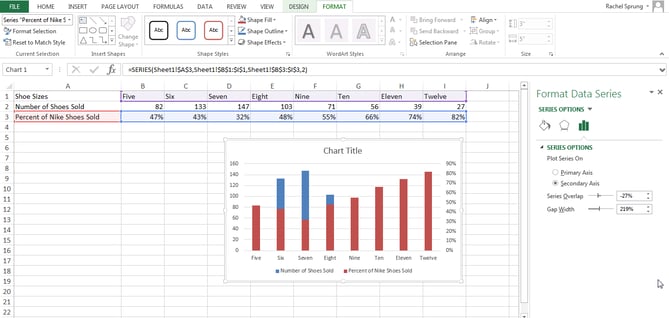
Click and highlight your secondary bar data — the red columns — and select the “Design” tab (which is located next to the “Format” tab at the top of your screen). Then, click “Change Chart Type.”
You will see the following pop-up modal. Next to “Percent of Nike Shoes Sold” at the bottom, click on the dropdown, and select an option below “Line.” This will change this data series into a line graph.
Make sure the “Secondary Axis” check box next to the dropdown is selected as well.
Voilà! Your chart is ready.
How to Add a Secondary Axis in a Google Doc Spreadsheet
Step 1: Gather your data into the spreadsheet.
Make Row 1 your X-axis and Rows 2 and 3 your two Y-axes.
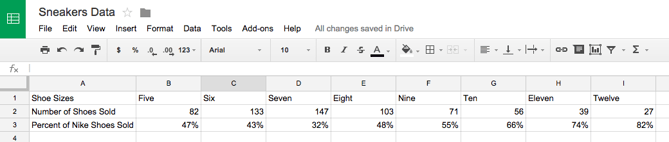
Step 2: Create a chart with your data.
Highlight your data. Then click on “Insert” on your menu, and click “Chart” — it’s located toward the bottom of the drop-down. This module will appear.
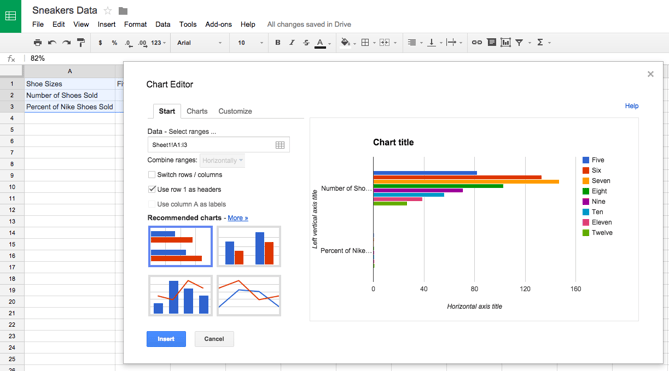
Step 3: Add your secondary axis.
Under the “Start” tab, click on the graph at the bottom right showing a bar graph with a line over it. If that doesn’t appear in the preview immediately, click on “More >>” next to the “Recommended charts” header, and you will be able to select it there.
Make sure that “Use column A as headers” is checked at the top. If the chart still doesn’t look right, you can also check the option to “Switch rows / columns.”
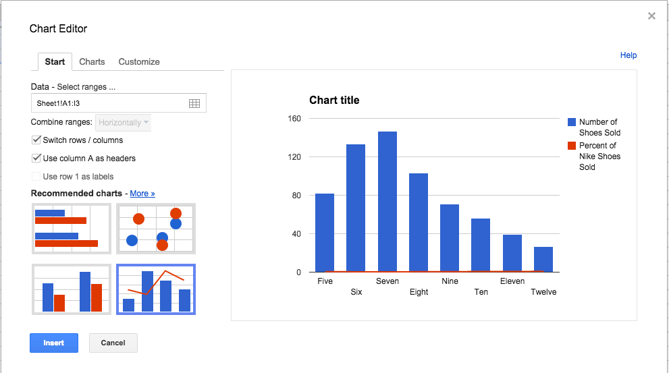
Step 4: Adjust your formatting.
Now it’s time to fix your formatting. Under the “Customize” tab, scroll down to the bottom where it says “Series Number of Shoes Sold.” Click on that dropdown, and click on your secondary axis name, which, in this case is “Percent of Nike Shoes Sold.” Under the “Axis” drop-down, change the “Left” option to “Right.” This will make your secondary axis appear clearly. Then click “Insert” to put the chart in your spreadsheet.
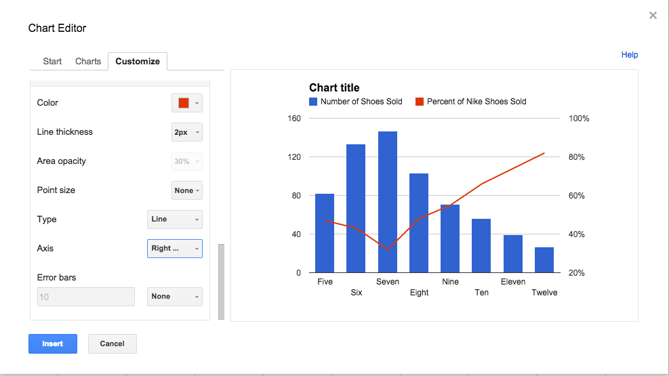
Voilà! Your chart is ready.
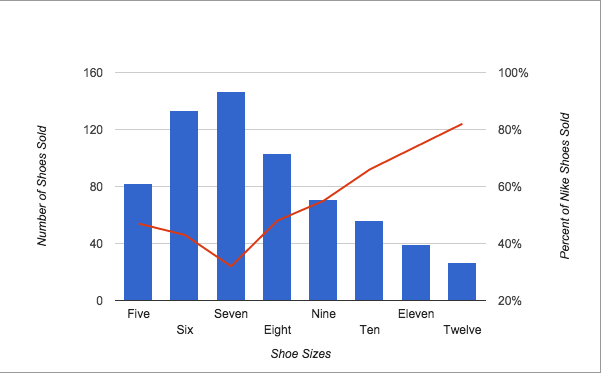
Want more Excel tips? Check out this tutorial on how to create a pivot table.


Why I’m Worried About the Future of VR
It’s not often that I leave a tech conference keynote feeling like I had just attended an academic seminar in which I had mistakenly enrolled.
Of course, being a natural cynic, I have left them with skepticism. Will that product actually ever roll out? Does the technology really work the way it appears to in video demos?
But today’s opening keynote at Oculus Connect — Facebook’s annual virtual reality (VR) mega-conference — was different. I left not feeling incredulous, but rather thinking to myself, “That … was anticlimactic.”
The Timing of Oculus Connect
It’s been a dramatic week for Facebook.
On Monday, it was revealed that the co-founders of Instagram — which was acquired by Facebook in 2012 — were stepping down. (Oculus, for context, was acquired by Facebook in 2014.)
Today, Forbes published a controversial interview with Brian Acton, the co-founder of WhatsApp who departed the company earlier this year, only to prompt a contentious response from David Marcus: the former VP of Messenger who now oversees a small Blockchain group at Facebook. WhatsApp is also among Facebook’s acquisitions.
Maybe it was the context of a week of concentrated executive theatrics –among what has been a year of turmoil and bad PR for Facebook — that not-so-subtly caused the anti-climactic sentiment of today’s keynote.
But more than that, as others have been keen to point out, it could have been caused by the seemingly “slow roll” of VR, which the public has been slow to receive in a tangible way, and whose user base still largely consists of early adopters.
Oculus’ annual #OC5 conference feels anti-climactic as slow VR adoption and tech advances minimize progress. These Expressive Avatars are cool, but there aren’t enough VR owners to use them https://t.co/hxGRz3IVyz pic.twitter.com/AF99M9tJVN
— Josh Constine (@JoshConstine)
September 26, 2018
Looking Back, Looking Forward
The Road to One Billion
At last year’s Oculus Connect, Facebook CEO Mark Zuckerberg waxed bold about his goal of one billion people using VR, though by when, he didn’t quite say. Today, almost laughably, he pointed to the reality — no pun intended — that he’s less than 1% of the way there.
Zuck is feeling funny today. Here’s a graphic showing the progress to his projection/goal last year of getting 1 billion people into VR #oc5 pic.twitter.com/hsHmmIo0s9
— Amanda Zantal-Wiener (@Amanda_ZW)
September 26, 2018
But in order to get to one billion, Zuckerberg said, the “how” needs to be prioritized over the “when.” And that, he explained, requires a better overall VR ecosystem — to get more users on each Oculus headset, and to build the technology in a way that allows new models and platforms to cooperate with old ones.
I like to think of this concept in terms of iPhones — how older models of the device tend to stop working as well as newer generations of the iOS are loaded onto it. In order to make the market for VR truly permeable, Zuckerberg said, the platforms can’t work that way.
So, what does that look like — today, at least? It starts with the Oculus Quest: the company’s “first all-in-one VR system … that lets you look around in any direction and walk through virtual space just as you would in the physical world.” It will ship next spring — at Facebook’s annual F8 developer conference, I predict — and comes with a $399 price tag.
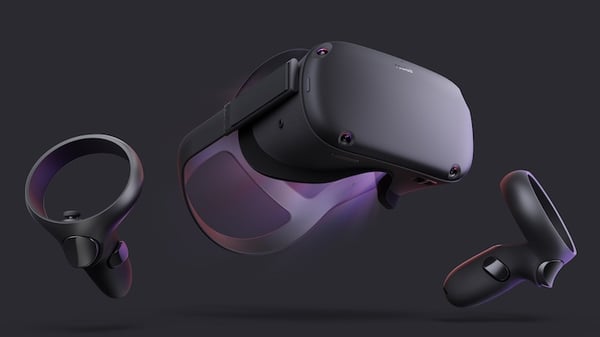
But is that really the way to the hearts of the non-early-adopter’s heart — a nearly-$400 price tag on hardware that many people haven’t even started tinkering with?
People First
After Zuckerberg unveiled the Oculus Quest, Facebook’s VP of Consumer Hardware took the stage to discuss the responsibility of tech to put people first — to use developments like VR to break down distance and barriers between people, rather than silo them.
But it seems that the focus on connecting people in this realm seems to be, if you’ll excuse the play on words, virtual. The Oculus’s gaming capabilities and features like Oculus Venues — which allows users to “attend” live events like sports games and concerts in VR — does connect people and allow them to use VR in a social way.
It’s still purely online, however — arguably siloing users in a virtual world that doesn’t invite human interaction in a way that our species has evolved to exist and function.
And should VR go mainstream — it’s that potential encouragement of “getting inside and getting online” that I find most worrisome about its future.
A Future of VR That Doesn’t Shine So Bright
What We Expected
When I outlined my key predictions for Oculus Connect yesterday, I was perhaps approaching it from an over-optimistic point-of-view (which, if you know me at all, is out of character).
I had hoped to see more use cases for VR that involved training people in the workplace, of helping them get to know each other in a safe (virtual) environment before meeting in person — a possible integration with Facebook for Dating — and donating VR headsets to underserved schools to aid learning.
But what we heard today didn’t reflect that. Instead, we received one major announcement — the future launch of the Oculus Connect — a heavy emphasis on new gaming features, and an extensive history lesson on how Big Tech came to be, and how it will dictate VR’s future, from Oculus Chief Scientist Michael Abrash.
What We Got
The man clearly has a lot to say — “once Abrash gets started, all bets are off” I heard a PR rep say in the press lounge later — and seems bullishly optimistic on the future of VR.
In a few years, that is.
In order to make the mass market for VR truly permeably, Abrash suggested, it has to become a social norm. That is, it has to be accessible and acceptable in a way that allows it to be used any where, any time — including in public.
Part of that future — which Abrash says he foresees coming true within the next four-to-five years — includes modifications to both the technology and the hardware. Here’s where he started to lose me … and others.
I no longer understand what’s happening at this Oculus event 🤘🏼 pic.twitter.com/OIyG8k99od
— Kurt Wagner (@KurtWagner8)
September 26, 2018
First, the technology has to evolve to be able to mix different layers of reality, Abrash said. It has to allow users to enjoy VR experiences in a “see-through” way that also allows them to see the physical environment around them, sometimes combining the two.
It also has to integrate what we do on our other devices, such as our phones, where we receive message and social media notifications.
A look “under the hood” of the Oculus Connect. This image depicts how the technology/camera combines in-real-life object detection with the position of the user to overlay VR features with that environment #oc5 pic.twitter.com/LNQiovgm9h
— Amanda Zantal-Wiener (@Amanda_ZW)
September 26, 2018
And for the hardware, it has to be okay to wear in public without 1) walking into trees, walls, and other people, or 2) looking weird. That means that the ultimate mixed reality headset — the one that truly leads to a mass adoption of VR — can’t be a headset at all. It has to be a pair of glasses.
The Many Sides of VR Coming to the Masses
As with most emerging technologies, there are both positive and negative sides to a future where, as Abrash put it, we’re able to “combine the real with the virtual whenever you want.”
On the plus side, you have benefits for those with something like panic disorders: a future in which these users instantly converge something calming, like a positive environment replete with a guided breathing exercise, with the actual environment or situation around them that’s causing panic.
But when evaluating the drawbacks of such usability, I point to the fact that so many of us — myself included — already engage in the unhealthy habit of constantly looking down at or checking our phones, no matter what we’re doing or who we’re with.
Now, layer that present reality with the future one — where we’re already over-connected, but are also potentially both existing in silos from real-life engagement with others and, even when we do venture into public, can easily replace what’s actually happening around us with a virtual “improvement”?
It’s a future that’s a bit of a way’s off — and that’s even if Abrash’s vision of mass consumption of VR comes to fruition — but if so, the long-term implications should be considered.
Technology has already caused us to evolve to a point of being addicted to mobile devices in a way that’s diminished our attention spans and empathy — especially among younger generations who could actually live to see this future.
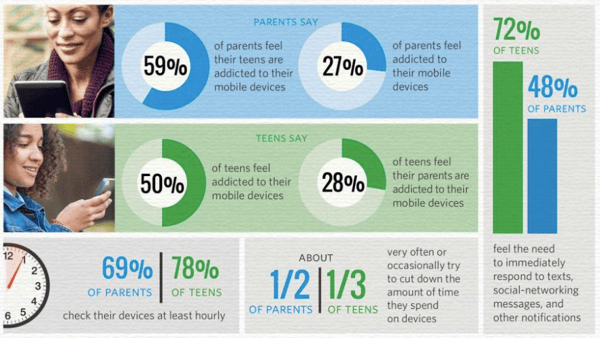
Source: Common Sense Media
Should this future come true — one where we can quickly overlay actual reality with something that we prefer — also evolve us to the point of no longer being able to cope with conflict, stress, or other scenarios in which we’ve historically relied on survival instincts?
Many other things would need to happen first. More people would have to start using VR, perhaps at the extent to which we use smartphones. More people will have to be able to afford it, too. And there might have to be rules, too — perhaps within the same vein of barring texting while driving, or using phones in the classroom among a certain age group.
But again, these possibilities should be considered. If Oculus truly wishes to put people first, and bring us back to the human side of technology — its long-term impact on the very people into whose hands these products will go should be carefully and thoroughly evaluated.
We’ll be at Oculus Connect tomorrow, too. Check back for our coverage of Day 2.

What Is a Product Manager? (Job Description Examples and Salary)

Unriddled: A Secret Google Memo, Alexa Microwave, and More Tech News You Need
“Unriddled” is HubSpot’s weekly digest of the tech headlines you need to know. We give you the top tech stories in a quick, scannable way and break it all down. It’s tech news: explained.
Unriddled: The Tech News You Need
1. Amazon is building a new kind of delivery fleet — starting with a whole bunch of vans.
Amazon ordered 20,000 Mercedes-Benz vans for its new delivery program, which allows contractors around the country to sign up to deliver packages for the retail giant. Amazon hopes the program will help it expand its same-day delivery capabilities, and rely less heavily on conventional delivery services like the U.S. Postal Service, FedEx, and UPS. Read full story >>
2. Uber and other US employers have been advertising jobs to men only on Facebook.
A ProPublica review found that Facebook was permitting employers to target job-related ads exclusively to men. The Supreme Court ruled in 1973 that it’s illegal for employers to advertise jobs exclusively to one sex. Fifteen US employers — including Uber — were found to be targeting only men with job ads on the social network. Read full story >>
3. Google reminds us that, yes, third-party apps can still read our emails.
Google stopped scanning Gmail messages for ad-targeting purposes earlier this year, but apparently that doesn’t apply to third-party apps. Google’s VP of public policy and government affairs confirmed this week that third-party Gmail apps still have the ability to read your emails — as long as they get consent from you first. Read full story >>
4. Instagram wants to influence the US mid-term elections — in a positive way.
According to a study by Nature, the simple message, “Get out the vote,” above Facebook News Feeds might have driven up to 340,000 additional votes in 2010. In light of this promising data, Instagram plans to run Stories ads encouraging U.S. users who are over 18 to register to vote in the upcoming midterm elections. Read full story >>
Image via TechCrunch
5. Snapchat’s new feature wants you to buy even more stuff on Amazon.
Starting this week, Snapchat is testing a new visual search feature that will let you identify and buy Amazon products with your phone’s camera. The new shopping feature is being rolled out gradually to users, and will let you complete purchases without leaving the Snapchat app. Read full story >>
Image via Snapchat
6. Facebook saw Messenger partnerships with banks as an opportunity to obtain sensitive financial data from users.
Back in 2016, Facebook made a big push to get banks to develop Messenger bots for customer service purposes. A new Wall Street Journal article says Facebook saw these partnerships with banks as a way to gather users’ sensitive financial data and leverage users’ spending habits for ad targeting. Read full story >>
7. A Twitter bug might have exposed some DMs to third-party apps.
Twitter announced last week that a now-resolved issue with one of its APIs might have sent some users’ direct messages (DMs) to third-party developers who “weren’t authorized to see them.” Read full story >>
8. Google asked employees to delete a memo about secret plans to launch a censored search app in China.
Back in mid-August, Google CEO Sundar Pichai said in an all-hands meeting that Google was “not close to launching a search product in China.” A recently surfaced internal memo seems to contradict this, asserting that Google engineers had been working to get a search product “launch ready” for Chinese officials by late July. The memo also explained that the Chinese search system would require users to log in to make searches, and would share their location and search history directly with a Chinese partner. Read full story >>
9. Amazon is determined to hit a hardware home run as big as the Echo — even if it means making every hardware product imaginable.
Amazon unveiled a slew of new products at its annual hardware event, including an Alexa microwave, Alexa clock, a security camera, and an Echo Dot that’s exactly the same as the original Echo Dot, but louder. The company also announced some notable new features for Alexa, like a new security mode and a feature that tracks your home habits and makes suggestions when something seems out of place (e.g., forgetting to turn off a light). Read full story >>
10. Facebook wants to find you a life partner.
Colombia will be the first country to experience Facebook’s new dating app, with a country-wide test run launching there this week. The dating app, which was announced at the company’s F8 developer conference this May, will soon be rolled out internationally if all goes to plan. Ready full story >>
11. Instagram’s co-founders are leaving the company, and it looks like they might be launching a native resharing feature.
Instagram co-founders, Kevin Systrom and Mike Krieger, announced yesterday that they are departing from the company — which they created in 2010, before it was acquired by Facebook in 2012 for a cool $1 billion. Meanwhile, The Verge obtained screenshots of what looks like a native content resharing feature for Instagram — something Instagram has resisted developing for years for fear of corrupting the personal nature of the app. Read full story >>
That’s all for today. Until next week, feel free to weigh in on Twitter to ask us your tech news questions, or to let us know what kind of events and topics you’d like us to cover.

The Ultimate Guide to Virtual Reality
Imagine your favorite vacation. Where was it? What did you do? Who went with you? How was the weather? What were you wearing? Can you remember every little detail? If you’re anything like me, you can remember the overall vacation, maybe some specific moments here and there, but most of the fine points have faded. It’s a bummer, right?
What if you could relive your first time seeing the Eiffel Tower or that rock concert you attended last summer whenever you wanted? With virtual reality (VR), you can. The technology lets you travel to distant destinations, escape to new worlds, and even recreate your favorite moments.
Sound unbelievable? It kind of is. While the technology has existed for decades, it’s only recently made its way into consumers’ homes. VR headsets like Google Cardboard and Oculus Rift make it easier than ever for users to completely immerse themselves in their favorite video games and take a hands-on approach to learning new skills. Users can now interact with people and items in a totally different reality.
But while most people associate virtual reality (VR) with gaming and tourism, it’s currently used for a wide variety of applications. From medicine to marketing, there is no limit on what you can do with this technology.
We understand VR can be intimidating. Virtual worlds sound like they belong in a science fiction film, not in marketing. That’s why we created this guide to walk through the history of virtual reality, how it works, its applications, and how growing businesses can use it. Follow along to learn more.
The History of Virtual Reality (VR)
Virtual reality may seem like the hottest new piece of technology, but in fact, it was used long before innovators coined the term. That’s right, people have been obsessed with the idea of escaping reality and entering immersive experiences for decades. In fact, 360-degree murals from the 19th century could be considered some of the earliest attempts at virtual reality. The paintings aimed to make viewers feel like they were present in the scene. When you think about the amount of urbanization and cultural change that took place during the 1800s, it’s no wonder why people were so interested in visualizing different cities and civilizations. But to understand modern virtual reality, we have to travel back to the 1930s.
In 1931, Edward Link created the Link Trainer — the first commercial flight simulator. The simulator mimicked in-air turbulence and other common issues, allowing the military to train pilots during World War II safely.
Several years later, Sawyer’s View-Master debuted at the World’s Fair in New York. The childhood toy was a pair of plastic binoculars that allowed users to view single 3D images by inserting stereoscopic reels. In 2015, Mattel announced that sales had reached 100 million devices.
Following the introduction of the View-Master, cinematographer Morton Heilig developed the Sensorama. The machine allowed viewers to experience fully immersive films by sitting in an arcade-style theater cabinet that stimulated all the senses. Then in the 1960s, the first head mounted display was invented, allowing viewers to experience 3D worlds with stereo sound through a single, wearable device.
Throughout the 1960s and 1970s, engineers created several variations of VR headsets, but it wasn’t until the 1980s that people started using the name virtual reality. In 1987, Jaron Lanier coined the term while developing numerous VR accessories at his company VPL. And inventing the name virtual reality isn’t the only thing VPL is known for — the company also made history by becoming the first to sell VR goggles and gloves.
Over the next decade, VR wiggled its way into mainstream entertainment as users interacted with it in arcade games and gaming consoles. VR was so popular in the 1990s that Hollywood made a blockbuster hit about the technology — “The Matrix“.
In the 21st century, we’ve seen rapid advancements in virtual reality.
Facebook,
Google,
Samsung, and
Microsoft have all started developing their own VR devices, and with the rise of smartphones, it has never been easier for users to have an entirely immersive, interactive experience.
By now you know that virtual reality can instantly transport you to the moon or the bottom of the ocean, but how does it work? The most common types of virtual reality rely on headsets so we’ll start there. Virtual reality head-mounted displays, or HMDs, create immersive experiences with the help of two tiny screens — one for each eye. HMDs are also known as a stereoscopic display. Each screen shows images at a slightly different angle from the other to imitate depth. Virtual reality headsets use foam or other materials around the edges of these screens to block out all external distractions like the light.
Accelerometers and position sensors within the headset provide the necessary inputs to make the experience responsive. By tracking where the user is looking and how quickly they are turning their head or moving it up and down, these sensors allow the screens to respond instantly with new images, mimicking natural vision.
More advanced forms of virtual reality devices can incorporate actions, gestures, and sound into the experience. To interact with objects in the virtual world, users wear special gloves that serve two purposes. The first is to track their hands so they can project into the virtual world and the second is to simulate textures and objects by activating hundreds of tiny components within the glove. With VR gloves, users standing in a virtual reality rainstorm can actually feel the drops of water against their skin and can even reach out within the experience to grab a digital umbrella.
To simulate 360-degree sound, special binaural microphones are used to record the way sounds refract around the human head and ear. These microphones are actually shaped like human heads and can create the illusion that sounds are coming from different places around the user — or even from inside their own head. When combined with ambisonic or 3D audio that responds based on where a user is looking, virtual reality experiences can become even more realistic.
Augmented Reality (AR) vs. Virtual Reality (VR)
We’ve covered some ins and outs of virtual reality, but you may still be thinking, “all of this still sounds a lot like augmented reality.” So what’s the difference? Augmented reality (AR) is essentially the precursor to the fully immersive VR experience. In simple terms, augmented reality (AR) is an embellished or altered form of reality where content lays over users’ real-world views. The less intrusive technology allows people to add digital assets to their physical environment.
In comparison, VR actually makes the user feel like they’re in a completely different world by creating a new digital experience. When using VR, what you see and experience is different from what’s actually around you.
But how do you create these immersive virtual worlds? It’s important to note that filming a video for a VR experience is very different from filming a typical video. For starters, filming VR videos requires different equipment and is more expensive to produce. The special video equipment, VR talent, and video editing will cost you, on average, between $13,000 and $20,000.
Most importantly, VR experiences always need to be designed with your audience in mind. Before you dive into creating an expensive VR experience, think about why you need VR over another type of content like video. Remember that people have almost 180 degrees of vision and unlike standard video, VR requires a 360-degree view. It’s also essential to consider motion sickness when designing a VR experience. Because the platform completely alters people’s perception and senses, it can cause some viewers to feel nauseous. Try filming fairly still shots so viewers can interact with the content at their own pace.
Make sure the investment is worth your time, energy, and money. While virtual reality is challenging and expensive to create, it can be an incredible piece of content for your company if you have a clear vision and a high-quality production.
Virtual Reality Applications and Examples
It isn’t hard to think of fun and entertaining ways to use virtual reality — years of watching the holodecks on Star Trek along with more recent examples like Ready Player One have shown off the fun side of VR. However, many companies struggle to find practical applications for the technology. Let’s talk through a few ways some industries are already using VR.
Education
While VR has been helping pilots learn to fly for years through flight simulators, imagine the impact VR could have on other forms of education. Lowes recently introduced virtual reality “how to” experiences into 19 of their stores to help teach hopeful DIYers how to correctly complete tasks ranging from painting their home to tiling a bathroom. When compared to people who simply watched YouTube videos on the topics, the virtual reality DIY videos had a 36% higher recall.
And VR isn’t just used by consumers. Walmart is using the technology to help train its employees. According to Forbes, “Soon, all 200 of the company’s U.S. training centers will use VR instruction to educate the estimated 150,000 employees going through the program annually.” VR training will help ensure that all Walmart employees receive the same level of training and development.
VR is also being used by doctors, architects, educators, and other professionals to practice complicated procedures and learn challenging subjects. A recent study found that “93% of teachers say their students would be excited to use virtual reality, and 83% say that virtual reality might help improve learning outcomes.” For people who are visual learners or have learning disabilities, VR could present a new, viable substitute to traditional learning methods.
Medicine
Recently, hospitals have started using VR to help patients cope with all kinds of illnesses. A study from Duke University showed that, by moving simulated limbs with VR, paraplegic patients were able to regain some control over their own bodies. The test was so impactful that half the patients got upgraded to partial paraplegics instead of full paraplegics. VR has also been used to treat PTSD and serve as an alternative to drugs to minimize pain. In fact, a 2011 study involving burn victims found VR to be more effective than morphine in reducing pain.
For medical residents, practical VR experiences can also help them train for future procedures. Companies like Immersive Touch simulate the way different tools interact with patients’ bodies to better prepare residents for surgeries. VR training even allows hospitals to save money by replacing pricey plastic mannequins which can cost over $400,000 annually to maintain.
Travel and Tourism
Virtual reality’s ability to digitally transport users to far away places is also being used to encourage people to visit the physical locations. In 2017, Visit Wales created six VR videos to encourage travelers to visit the country. The videos showcased Wales’ natural beauty with shots of the ocean, dolphins, birds, and other wildlife. According to Visit Wales, 85% of people who viewed the videos indicated that they would visit the locations they saw.
VR is used to encourage tourism in places ranging from Australia to the state of Delaware. In addition to attracting visitors, VR also helps travelers plan their trips. In 2017, Expedia introduced VR “try before you buy” experiences for select hotel rooms booked through the site that allows viewers to take a virtual walk around the room and even sample the view outside.
Marketing and Customer Experience
If you’re like me, you’d never buy a car without test driving it first. The test drive is the only way to get a feel for the car. But it may not be the only way for long. Volvo’s EX90 experience allows users to take a virtual ride in their newest car using a VR device or their phone. While VR may not entirely replace a test drive, this teaser could help bring more people to dealerships to see the car in person.
In addition to bringing in new customers with immersive product trials, VR can also help retain existing customers by keeping them happy. How many times have you been on a customer support call where you wish the other person could see what you’re seeing? With virtual reality, that’s now possible. By simultaneously viewing the same experience, issues can be resolved faster and with less frustration.
The Future of Virtual Reality: How SMBs Should Use VR
OK, you’re probably getting pretty excited to start experimenting with VR, but before you go out and create your own VR experience, there are a few important facts to consider. The reality of virtual reality is that it may not make sense for all SMBs. Because VR requires specialized hardware to create and use, it’s more expensive to develop than alternatives like augmented reality. The number of VR users, while growing rapidly, is also still relatively small with only a couple million VR headsets currently in use. For most businesses, the costs to create custom experiences for this limited audience probably isn’t worth it yet.
However, for some businesses, VR could be a perfect fit. Industries like gaming, hospitality, entertainment, and real estate are great candidates for virtual reality. For the rest, it never hurts to get ahead of the trend by creating a VR strategy to implement down the line. If you do want to incorporate VR now, here are a few tips:
1. Start with your existing audience.
Where and how do your customers engage with your brand? If you have a mobile app or produce video content, these could be great starting places to add VR experiences. For example, StubHub looked at the seat preview feature their users were already interacting with and decided to incorporate a 360 view into the experience.
2. Use VR to expand your customer base.
Virtual product trials, demos, and store walkthroughs allow people all over the world to experience your brand and products at their leisure. This potential gives VR a tremendous power to draw in new customers from across the globe who may have never heard of your brand before.
3. Think like a content creator.
The novelty of VR will only draw in so many people. For long-lasting results, your virtual experiences will need to provide real value and captivate your audience. Think of ways to introduce emotion and intrigue into your VR content. For example, the National Museum of Australia used VR to let people swim with virtual sharks and explore the Great Barrier Reef. VR is an incredible way for people to experience things they never imagined seeing.
Although consumer adoption of virtual reality will likely be a slow process, several roadblocks have already disappeared. In 2015, YouTube began supporting 360-degree videos and Facebook followed suit shortly after. The ability to view VR videos on these leading platforms made the content significantly more accessible. Costs are also coming down for VR equipment. You can now buy a 360-degree camera that shoots in 4K video for under $400. As VR becomes easier to create and view, SMBs with VR content plans will benefit from being able to hit the ground running (even if that ground is just a digital projection).
Conclusion
Virtual reality has a long way to go before it’s entirely part of mainstream content, but many companies using the technology are already seeing impressive results. Growing companies should keep up with the technology as it develops and continue to look for opportunities to create a VR experience. While it doesn’t make sense for every business to invest in VR now, new advancements could make it easier (and cheaper) to create content in the future.
Virtual reality presents users with the fantastic opportunity to immerse themselves in entirely new experiences. It may take awhile for consumers to adopt this technology, but we only see it continuing to grow in popularity. After all, who couldn’t use a break from reality?
